Health Workforce Modelling, Northern Territory, 2006 2022 - Rosalyn Malyon Yuejen Zhao Steven Guthridge
←
→
Page content transcription
If your browser does not render page correctly, please read the page content below
Health Workforce Modelling,
        Northern Territory,
               2006 - 2022

                    Rosalyn Malyon
                       Yuejen Zhao
                   Steven Guthridge
Acknowledgements This project was undertaken for the Strategic Workforce Committee of the Department of Health and Families. In undertaking the project, the project team was assisted by many people and gratefully acknowledge their advice and support. © Department of Health and Families, Northern Territory 2010 This publication is copyright. The information in this report may be freely copied and distributed for non- profit purposes such as study, research, health service management and public information subject to the inclusion of an acknowledgement of the source. Reproduction for other purposes requires the written permission of the Chief Executive of the Department of Health and Families, Northern Territory. Suggested citation Malyon R, Zhao Y, Guthridge S. Health workforce modelling, Northern Territory, 2006 -2022. Department of Health and Families, Darwin, 2010 ISBN 978 0 9805326 4 7 Printed by the Government Printer of the Northern Territory, 2010 An electronic version is available at: http://www.health.nt.gov.au/Publications/Health_Gains_Planning_Publications/index.aspx General enquiries about this publication should be directed to: Director, Health Gains Planning, Department of Health and Families PO Box 40596, Casuarina, NT 0811 Phone: (08) 8985 8074 Facsimile: (08) 8985 8075 Email: ntghealth.gains@nt.gov.au ii HEALTH WORKFORCE MODELLING, NORTHERN TERRITORY
Table of contents
Summary                                                                  v
Introduction                                                             1
Method                                                                   3
 NT modelling approach                                                   3
 Data parameters and sources                                             3
    Demand module data parameters                                        3
    Supply module data parameters                                        6
    Graduate projections                                                 8
Results                                                                 10
 Workforce analysis: demand versus supply                               10
    Medical workforce                                                   10
    Nursing workforce                                                   12
 Pressure point analysis                                                15
 Regional analysis: nursing                                             16
 Benchmark analysis                                                     17
Discussion                                                              19
Appendix 1 Methods for estimating the future health workforce           22
Appendix 2 NT Government statistical regions                            33
References                                                              34
List of tables                                                          38
List of figures                                                         39
Selected Health Gains Planning publications                             40

                              HEALTH WORKFORCE MODELLING, NORTHERN TERRITORY   iii
Abbreviations ABS Australian Bureau of Statistics AHW Aboriginal health worker AIHW Australian Institute of Health and Welfare AR-DRG Australian Refined Diagnosis Related Group BoD Burden of disease and injury CDU Charles Darwin University CCIS Community care information system COPD Chronic obstructive pulmonary disease DALYs Disability adjusted life-years DEEWR Department of Education, Employment and Workplace Relations DEST Department of Education, Science and Training DHF Department of Health and Families DHS Department of Human Services FTE Full-time equivalent GDP Gross domestic product GP General practitioner HCSLF Health and community services labour force HGP Health Gains Planning Branch, NT Department of Health and Families IHD Ischaemic heart disease LFS Labour force survey NHWT National Health Workforce Taskforce NT Northern Territory NTG Northern Territory Government PCIS Primary care information system PIPS Personnel information and payroll system iv HEALTH WORKFORCE MODELLING, NORTHERN TERRITORY
Summary
The Northern Territory (NT) medical workforce model and the NT nursing workforce
model project the requirement for, and supply of, medical practitioners and registered
nurses and midwives (nurses) from 2006 to 2022. The models were produced as part
of the Health Workforce Modelling Project established by the Strategic Workforce
Committee of the Department of Health and Families (DHF) to inform workforce
planning by projecting future numbers of health professionals in the NT. Three reports
have been produced under the project. This report presents projections from the
medical and nursing models and discusses key issues identified by the modelling. The
two other reports provide a technical description and more detail on the outputs from
the models.
Growth in population and patterns of population ill health were used to project the
future need for treatment and the medical and nursing workforce required to meet that
need. To estimate the supply of these health professionals, the current workforce was
moved forward in time based on expected inflows and outflows from the workforce
including migration, new graduates and retirements; and important trends and
influences on those flows.
The key data sources for the models were:
The Burden of Disease and Injury in the Northern Territory, 1999-2003 (Zhao Y,
You J and Guthridge S, DHF)
Population estimates (NT Government/Charles Darwin University)
National hospital cost data (Australian Government Department of Health and
Ageing)
Census data (Australian Bureau of Statistics, published by the Australian Institute
of Health and Welfare; AIHW)
Medical Labour Force Surveys and Nursing Labour Force Censuses (AIHW)
Student data (Charles Darwin University)
The projections from the medical model indicated that over the period 2006 to 2022
growth in the supply of medical practitioners would exceed the growth in requirements
for their services. The nursing model initially projected a shortfall, but after 2015 the
supply of nurses was expected to exceed requirements. Should these projected
increases in supply occur, there would be a greater number of health professionals
available to address the burden of disease and injury in the NT. Such an increase
could improve access to services and contribute to closing the gap in health status
between Indigenous and non-Indigenous Territorians.
The absolute numbers of health professions are, however, less meaningful than the
issues that will enhance or impede growth. The modelling highlighted the key impacts
on growth. Most critical was the mobility of medical practitioners and nurses. The
modelling assumed that past migration patterns would persist into the future. Should
the NT become less successful at attracting or retaining health professionals, it could
alter the projections considerably. Current levels of turnover are high, particularly in the
younger age groups. This churn is costly and results in the NT needing to attract ever
larger numbers of health professionals each year to maintain and expand its workforce.
There are also indirect effects from mobility, both positive and negative, through
changes it can make to the age structure of the health workforce.
HEALTH WORKFORCE MODELLING, NORTHERN TERRITORY vGraduates were an important inflow in the models. They contributed to growth in size of the workforce and they have the potential to contribute more years of work than health professionals that migrate to the NT later in life. Local graduates also offer the advantage of being more likely to stay in the NT and they may be better prepared for the unique work environment than health professionals from other states and countries. A potential risk for the NT was the projected increase in the number of local nursing graduates. Their number may exceed the places available on DHF’s graduate nurse program if this is not expanded, leaving some graduates to find alternative pathways into the workforce or consider interstate positions or other careers. Regardless of where they come from, the entry of more graduates than are presently taken is needed if supply is to exceed demand. The modelling identified key pressure points in the requirement for medical and nursing services. The most pressure was expected to come from elderly patients whose collective needs were expected to more than double over the projection period. In terms of specialty areas, the increase in demand was expected to be highest for cardiology, neurology and oncology services. Across the regions, Darwin was expected to experience the strongest growth in the demand for nursing services, followed by East Arnhem and Alice Springs. Medical practitioners would also be needed to support remote services in those regions. This growth in demand represents the minimum workforce requirement to maintain the health of the population at current levels. Disability adjusted life-years (DALYs) were used as the measure of population health and estimates were available for both Australia and the NT. When the 2006 workforce was benchmarked against the national average, it showed that there were a third fewer medical practitioners and nurses in the NT to treat every 100 DALYs in the population than there were nationally without considering the loss in efficiency from servicing small, remote communities. This differential is likely to increase the pressure on NT health professionals and give Territorians less access to services. It is hoped that the projections will facilitate more sophisticated discussion in the NT about the demand and supply of health professionals by highlighting minimum growth requirements, key areas of vulnerability in supply, indirect effects from workforce mobility and emerging issues such as the placement of graduates. The modelling was, however, limited by the integrity and availability of current data sources. Most notably, there was no reliable source to estimate the NT health workforce. Census data was used, but it can only be updated every five years and it only captures resident health professionals. Better information on the current NT health workforce including graduates could enhance the modelling. The modelling would also benefit from further research on exits and re-entries into the health workforce and measures of need that can capture the workforce requirements associated with the prevention of disease and injury. vi HEALTH WORKFORCE MODELLING, NORTHERN TERRITORY
Introduction
With a substantial proportion of health workforce nearing retirement age and demand
for health services from an ageing Australian population increasing, there is much
concern about whether there will be sufficient health professionals to meet the future
need for their services.1,2 In the Northern Territory (NT), these issues are compounded
by high mobility in the workforce, the poor health of Indigenous people and the need to
provide services to remote communities.3,4 In the face of these pressures,
understanding workforce requirements and the capacity to meet those requirements
will be important for ensuring that service provision can be sustained into the future.
Forecasting the supply of, and demand for, health professionals has a substantial
history, beginning in the United States of America. In 1976, the Graduate Medical
National Advisory Committee was tasked with advising on the need for medical
practitioners and produced estimates of supply and demand for 1990 and 2000.5 In the
past decade, the Health Resources and Services Administration has modelled the
supply and demand of medical practitioners, nurses and pharmacists and made its
methods available for use by others.6-8 Other researchers built on these models5 and
created alternative approaches (e.g., Birch et al.,9 Scheffler et al.,10 Lin et al.11). Early
models tended to predict that the supply of physicians would exceed requirements, but
more recent models have tended to predict that there will be shortages of health
professionals.10 Although this change could reflect policy that constrained supply in
response to the predictions of early models, it is also likely to reflect improvements in
the variables, data, assumptions and approaches used in more recent models.
In Australia, a substantial amount of workforce modelling has occurred over the past
two decades under the sponsorship of the Australian Health Workforce Advisory
Committee,12 state and federal governments (e.g., Department of Human Services,13
Access Economics14) and other bodies such as the Pharmacy Guild of Australia,15 and
the Council of Deans of Nursing and Midwifery.16 Most recently, the National Health
Workforce Taskforce (NHWT) has been tasked with development of projections of
supply and demand for the medical, nursing, dental and allied health workforces.17 A
key purpose of this modelling has been to guide policy and funding on the educational
and training places required to maintain the supply of health professionals.17 Despite
large increases in Australian medical school places since 2000, recent models indicate
that future requirements for medical practitioners will still exceed local supply and
Australia will remain dependent on overseas trained practitioners to make up the
shortfall.18 Shortfalls in the nursing workforce are also expected without continued
expansion of university places.19
Current modelling by the NHWT applied a standard methodology and data sources
across the states and territories to estimate the requirements for, and supply of, health
professionals. This approach facilitated the aggregation of jurisdictional projections into
a national estimate, but limited the inclusion of circumstances unique to each
jurisdiction. In particular, the modelling did not effectively capture the high level of
mobility in the NT workforce and unmet need in the NT Indigenous population. The
modelling also used data sources that poorly estimated the size and characteristics of
the current NT workforce and future graduate streams.
The NT Health Workforce Modelling Project, established by the Strategic Workforce
Committee of the Department of Health and Families (DHF), sought to inform
workforce planning in the NT by modelling the future requirements for, and supply of,
health professionals in the NT. The project aimed to identify the best approach to

                                     HEALTH WORKFORCE MODELLING, NORTHERN TERRITORY             1
modelling that could incorporate variables of specific importance to the NT. The
project’s purpose was to produce projections for the medical and nursing workforces
and to compare workforce levels in the NT with the national average. Ethical approval
for the project was obtained from the Human Research Ethics Committee of the NT
Department of Health and Families and Menzies School of Health Research.
This report presents a summary of the project’s outcomes. More detailed information
on the project’s outcomes and technical information on the models can be found in two
accompanying reports – Health Workforce Modelling, Northern Territory, Technical
Report for the Medical Workforce Model and Health Workforce Modelling, Northern
Territory, Technical Report for the Nursing Workforce Model. These reports are
available through the DHF website. a
This report is structured as follows: first, the approach for modelling the NT health
workforce is discussed. Second, the data parameters of the model are outlined and
issues with current data sources noted. Third, baseline projections of demand and
supply are presented for the medical and nursing workforces and key influences on the
projections discussed. Pressure points with regard to specialty, subgroups within the
population and regional areas are then investigated and the level of the current NT
health workforce compared with the national average. Finally, the implications of the
modelling are discussed and summarised.
a
At http://www.health.nt.gov.au/Publications/Health_Gains_Planning_Publications/index.aspx
2 HEALTH WORKFORCE MODELLING, NORTHERN TERRITORYMethod
NT modelling approach
The best approach for modelling the future requirements (demand) for, and supply of,
health professionals in the NT was identified by evaluating the strengths and
weaknesses of prior modelling approaches in terms of their ability to incorporate
circumstances specific to the NT and provide robust projections. The full review of the
models is provided as an appendix to this report (Appendix 1). The review determined
that different approaches were required for the demand and supply modules of the
model. For the supply module, the predominant method used in previous models was
the stock and flow approach and this was followed in the NT model. The stock and flow
approach identifies the size and activity of the current workforce (stock), sources of
inflows and outflows from the stock, and important trends or influences on the stock
and flows. It allowed inclusion of the key flows of importance to the NT and use of the
most relevant NT data sources. This approach did, however, have high data
requirements and the results were dependent on the quality of the data available.
There were more options for the approach to modelling demand, but each had
strengths and weaknesses. b A needs-based approach, which uses the health of the
population as the basis for determining workforce requirements,20 was determined as
the best available approach for capturing the unmet needs of the Indigenous population
and suitable data was available for use in the model. The limitations of this approach
were its inability to reflect the impact of substitution between occupational groups and
allow for infrastructure, funding and other constraints on service provision.
Data parameters and sources
Two workforce models were developed: the NT medical workforce model (the medical
model) projects the supply and demand of medical practitioners and the NT nursing
workforce model (the nursing model) projects the supply and demand of registered
nurses and midwives (nurses). Figure 1 shows the data parameters for each module of
the models. The sources of data differed between the medical and nursing models for
some parameters. In particular, the estimation of nursing graduates was more complex
than for medical practitioners and necessitated the inclusion of an additional element
(the graduate component) in the supply module of the nursing model. The models were
populated using best available data at the time of their development.
Demand module data parameters
Table 1 shows the data parameters and data sources for the demand modules of the
medical and nursing models. The population parameter provided an estimate of the
population in each year of the projection period. It was segmented into 36 sub-groups
to capture differences in the nature and occurrence of disease and injury by age,
gender and Indigenous status.21,22 The data source for this parameter was NT
Government/Charles Darwin University (NTG/CDU) projections of the NT population,
b
The literature included needs-based, utilisation-based, effective demand, effective infrastructure, models of care,
macro-economic and benchmarking models. Further analysis is provided in the report reviewing these models
(Appendix 1).
HEALTH WORKFORCE MODELLING, NORTHERN TERRITORY 34
Figure 1 NT workforce model
DEMAND
Burden of Health need Workforce
disease and need
injury
Population Mapping
Expansion Workforce
projection table
Figure 1 NT workforce model
factor demand
(age, sex, (disease by
projection
Indigeneity) profession)
Workforce
analysis:
demand vs.
Graduates Migration Trends – supply
productivity,
SUPPLY working hours
HEALTH WORKFORCE MODELLING, NORTHERN TERRITORY
Workforce
Current supply
workforce projection
(2006)
Age related Maternity Other exits
retirement and re-entriesbased on data compiled by the Australian Bureau of Statistics (ABS) on population
numbers, migration, births and deaths.
Table 1 Parameters and data sources for the demand module of the NT health workforce
models
Parameter Data source (medical and nursing models)
Population NT Government/Charles Darwin University estimates based on ABS data.
Health need Zhao Y, You J, Guthridge S. Burden of Disease and Injury in the Northern
Territory 1999-2003. Darwin: DHF, 2009.
Medical/nursing Department of Health and Ageing. National Hospital Cost Data Collection,
weights Cost Weights for Primary AR-DRG Version 5.1, Round 11 (2006-07),
Northern Territory.
2006 workforce Number parameter from supply module.
Expansion factor User defined.
The health need parameter measured the extent of ill health in the NT population.
Disability adjusted life years (DALYs), which incorporate both fatal (years of life lost
due to premature mortality) and non-fatal outcomes (‘healthy’ years lost due to
disability) were used as the data source.23 This source provided estimates of the level
of ill-health for the 36 population sub-groups across 190 categories of disease and
injury. The categories were condensed into 185 groups (burden of disease and injury
[BoD] groups) for the workforce models.
To translate health need into a workforce requirement, the necessary treatments for the
BoD groups were mapped to hospital treatments using Australian Refined Diagnosis
Related Groups (AR-DRGs). Estimates of the medical (medical weights) and nursing
resources (nursing weights) required to treat an AR-DRG were based on costings of
NT hospital separations from the National Hospital Costs Data Collection (Round 11;
2006-07).
A starting workforce was required to translate the workforce requirement into a
numbers of health professionals. The starting workforce was set at the headcount
number of medical practitioners or nurses from the supply module to reflect the total
number of health professionals providing services regardless of their provision of
hours. The last parameter in the demand module was an expansion factor, which
provided the capacity for workforce planners to increase the requirement for medical
practitioners or nurses by a specified amount (to meet expected policy changes,
technological advancements or other goals and developments). The expansion factor
was set at zero (no expansion) in both models.
Key limitations with the data sources for the demand module were:
The DALY only captures ill health; no assessment is made of the resources
needed to achieve the present levels of incidence (prevention).
The burden of disease was held constant over the projection period. No allowance
was made for changes in the incidence of disease and injury even though the
occurrence of some chronic conditions may be increasing.
BoD studies only occur periodically, limiting the ability to update the module.
The workforce requirement was based on hospital services, which may not be
reflective of requirements in other sectors such as primary health and aged care.
HEALTH WORKFORCE MODELLING, NORTHERN TERRITORY 5Supply module data parameters
Table 2 shows the data parameters and data sources for the supply modules of the
medical and nursing models. A profile of the current medical and nursing workforces
(the stock) segmented by age and sex was required to project workforce supply. The
number, age and sex parameters formed this initial stock, which was then moved
forward over time based on inflows and outflows from newly trained professionals
(graduates), retirements, maternity, migration and other factors. ABS census data from
the AIHW’s Health and Community Services Labour Force (HCSLF) publication was
used for working population component of the stock.1 AIHW’s Medical Labour Force
Survey and Nursing Labour Force Census (AIHW labour force surveys), which gather
demographic and labour force information from health professionals, were used to
estimate the non-working population.24,25
Table 2 Parameters and data sources for the supply module of the NT health workforce
models
Parameter Data source (medical and nursing models except where indicated
separately)
Number (headcount) Australian Institute of Health and Welfare Health and Community Services
Labour Force 2006 (AIHW HCSLF);
AIHW labour force surveys.
Age AIHW HCSLF.
Sex AIHW HCSLF.
Average working hours AIHW labour force surveys.
Full-time equivalent Medical: Medical Officers (NT Public Sector) Workplace Agreement 2008-
benchmark 2010.
Nursing: NT Public Sector Nurses’ 2008 – 2011 Union Collective
Agreement.
Graduates Medical: DHF, Intern numbers (Royal Darwin and Alice Springs hospitals),
unpublished data.
Australian Government Department of Education, Employment and
Workplace Relations (DEEWR), Students 2006 [full year]: selected
higher education statistics.
Nursing: Refer Table 3
Immigration Australian Bureau of Statistics (ABS), unpublished census data (multiple
years), obtained by request, 2007
Emigration ABS, unpublished census data (multiple years), obtained by request, 2007
Retirement exits ABS, Retirement and retirement intentions survey, Australia, Jul 2006 to
Jun 2007, Cat no. 6238.0
Maternity exits and re- Health Gains Planning (HGP) NT Midwives Collection, Mothers and
entry Babies, 2005;
HGP population estimates 2005, unpublished data based on ABS data;
ABS, Australian Social Trends 2007, Cat no. 4102.0, Maternity Leave
Arrangements.
Mortality and morbidity HGP, Fact sheet: Mortality in the NT, 2006.
DHF, exit interview data, unpublished.
The average working hours parameter accounted for differences by age and sex in
actual hours worked. The AIHW labour force surveys were the data source for this
parameter and trends in average working hours over time incorporated into this
6 HEALTH WORKFORCE MODELLING, NORTHERN TERRITORYvariable. The Full-Time Equivalent (FTE) benchmark is the average hours that a
medical practitioner or nurse would be expected to work in a full-time position. This
information was used to count the number of FTE positions that were supplied in each
year of the projection period and to determine the additional hours provided by the
workforce. The FTE benchmark was set at 38 hours per week, which was consistent
with the standard hours of a full-time public sector medical practitioner or nurse as DHF
is the primary employer of health professionals in the NT.26,27
Interstate and international movements are key flows to and from the NT workforce.
ABS census data on present and past place of usual residency by professional group
was used to calculate immigration and emigration rates.4 This source captured most
forms of migration with the exception of international emigration and rates could be
calculated at a suitable level of detail for the supply module. The average over five
censuses was used so that the estimates would be less sensitive to random
fluctuations in any census year. Emigration rates were applied to the workforce of the
previous period to derive the starting workforce for the following period and immigration
rates were applied to the workforce in each period after all other flows had been
accounted for.
Ageing is a key concern with much of the health workforce being over 50 years of
age.24 The ABS Retirement and Retirement Intentions Survey was used to determine
retirement rates for the supply module.28 Rates were based on the intentions of the
general population and were the same for females and males. No age related
retirements were assumed to occur below 50 years of age for medical practitioners and
below 45 years of age for nurses. The age by which all health professionals had retired
differed. Male medical practitioners were assumed to have all retired by the end of their
80th year and female practitioners by the end of their 70th year, to reflect the tendency
of some medical practitioners, particularly males, to continue to work well past the
standard retirement age of 65.24 Nurses were assumed to have all retired by the end of
their 70th year as there were relatively few working past this point.1
Maternity absences were calculated based on the proportion of women likely to have a
birth, the proportion of birthing women likely to take leave for maternity, the average
length of maternity leave and the proportion of women who return at the end of their
leave. Non-Indigenous data for the general population were used (the data sources are
indicated in Table 2). The proportion of women who take leave was 73% and the
average duration of leave was 34 weeks. No data were available on the proportion of
women returning from leave so this was set at one (i.e., all return). No allowance was
made for paternity leave by male health professionals.
The capacity to include exits due to mortality and morbidity was incorporated in the
supply module, but mortality data and DHF exit interview data for nurses did not
indicate that these exits occurred to such an extent that their inclusion would
substantially refine the projection.29,30 More generally, the exit interview data
suggested that about 2.9% of the nursing stock would have been likely to leave due to
study, poor work environment and other reasons.30 The responses to the AIHW labour
force surveys indicated that there are also nurses re-entering the workforce after an
absence although no detail was available on the reason for their absence. In 2005,
about 1.3% of non-working nurses in Australia were seeking to return to work in
nursing.24 These rates were applied across all age groups in the supply module of the
nursing model to account for the occurrence of other departures and re-entries in that
workforce. Similar data was not available for medical practitioners so no allowance was
made for morbidity, mortality and other exits and re-entries in the medical model.
The output (productivity) of health professionals may be influenced by factors such as
change in the acuity of cases, technology, work practices or the stability of the
HEALTH WORKFORCE MODELLING, NORTHERN TERRITORY 7workforce. The productivity parameter adjusts for these impacts. Crude measures of
productivity based on separations and FTE staff drawn from DHF’s annual reports did
not support inclusion of an adjustment so this parameter was set at 1 (i.e., no change
in productivity).
Key limitations with the data sources for the supply module were:
Census data is only available every five years, limiting the ability to update the
module.
Census data may omit health professionals who provide visiting services to the NT;
those that were not working in a medicine or nursing role during the census; and
those working in medicine or nursing as a secondary role.4
Low response rates to the AIHW labour force surveys in the NT mean that this
source is not presently suitable as an alternative to the census for the stock.
Exit interview data was only available for nurses and was incomplete as interviews
are not compulsory.
Maternity exits did not account for women who exit the workforce to care for older
children.
Graduate projections
The NT does not yet have a medical school, but there are students studying through
the NT Clinical School who complete their placements in the NT. A medical school will
be established in the NT; however, data is not yet available on the likely flow and
profile of graduates.31 Royal Darwin and Alice Springs hospitals take interns (medical
practitioners in their first postgraduate year). The actual number of interns in each year
to 2009 was included in the model then numbers were held constant over subsequent
years in the projection period. Graduates were assumed to be under 30 years of age
and that females comprised 55.6% of graduates based on the current gender mix of
Australian medical students.32
For nursing, two institutions provide undergraduate nursing courses in the NT –
Charles Darwin University (CDU) and the Batchelor Institute of Indigenous Tertiary
Education (Batchelor). In 2006, 357 students commenced studies in nursing programs
with these institutions – 30 at Batchelor and 327 at CDU.33 Although the majority of
Batchelor’s students were expected to be NT residents,34 most of CDU’s students were
based interstate35 and are unlikely to move to the NT at the completion of their study.
This situation means that there is not a simple relationship between the number of
university places and the expected flow of graduates into the NT nursing workforce.
A separate element (the graduate component) was added to the supply module in the
nursing model to project the expected flow of local nursing graduates. The data
parameters and data sources for the graduate component of the nursing supply module
are shown in Table 3. The numbers of local nursing graduates were projected based
on:
Available tertiary places estimated from the numbers of commencing students in
2006 and 200733 and new Commonwealth supported nursing places on tertiary
courses.32
Fill rates (of available places) based on advice from CDU and Batchelor34,35 and
allowing for a reduction in the fill rate after 2008 due to increased competition and
difficulties obtaining clinical placements for students.36
Attrition during the course.37
8 HEALTH WORKFORCE MODELLING, NORTHERN TERRITORY The proportion of part-time and local (Australians, residing in the NT) students.35
The CDU age/sex profile for local students.35
Table 3 Parameters and data sources for the graduate component of the supply module
of the nursing model
Parameter Data source
Available tertiary places Australian Government, Department of Education, Science and Training
(DEST). Students 2007 [full-year]: selected higher education statistics,
nursing & prior years.
DEEWR. New Commonwealth supported NT nursing place targets.
Proportion of places filled DEST. Applications, offers, acceptances and unmet demand time series,
2001-2008.
Student attrition rate Gaynor et al. (2008)37
Proportion part-time Charles Darwin University (CDU), unpublished data.
students
Proportion of local CDU, unpublished data.
students
Course duration CDU, standard completion timeframe
Actual local graduates CDU, unpublished data.
Proportion female CDU, unpublished data.
graduates
Graduate age CDU, unpublished data.
DHF graduate nurses DHF, graduate nurse program, unpublished data.
The projection of local nursing graduates was likely to be conservative as it excluded
growth in full-fee paying students and places sponsored by entities other than the
Australian Government. The projection could be improved by the collection of
demographic data and other characteristics of graduates entering the DHF workforce. It
would also be useful to examine the length of stay in the workforce of local graduates
compared with interstate graduates and other nurses that migrate to the NT.
HEALTH WORKFORCE MODELLING, NORTHERN TERRITORY 9Results
Workforce analysis: demand versus supply
Medical workforce
The medical model projects the requirements for, and supply of, medical practitioners
over the period 2006 to 2022. Figure 2 presents the baseline projections of demand
and supply for the medical workforce. Over the projection period, the requirement for
medical practitioners was projected to increase by 49.9% from 559 practitioners in
2006 to 838 practitioners in 2022. By 2022, the key contributors to the need for medical
services were: ischaemic heart disease (IHD); diabetes; chronic obstructive pulmonary
disease (COPD); breast cancer and vascular conditions (stroke, aortic aneurysm).
Together, they accounted for at least a third of medical requirements.
Figure 2 Demand for and supply of NT medical practitioners, 2006 to 2022
No. of medical Demand (headcount)
practitioners Supply (headcount)
1100
1000
900
800
700
600
500
400
2006 2008 2010 2012 2014 2016 2018 2020 2022
Year
The supply of medical practitioners was projected to increase by an even greater
amount – 74.4% (from 559 to 975 practitioners) and to exceed the growth in
requirements. Headcount numbers of medical practitioners exceeded FTE numbers
and the gap widened over the projection period from 13 FTE in 2006 to 31 FTE in
2022. There was also a sizeable reduction (41.3%) in the additional supply of labour
from the workforce (hours in excess of FTE benchmark). The reduction in hours
worked arose from an anticipated reduction in the average working hours of male
practitioners over the projection period (1.0% per annum based on national trends) and
an increase in the proportion of female and older practitioners who tend to work shorter
hours. The proportion of females in the NT medical workforce increased over the
projection period from 45.3% in 2006 to 48.7% in 2022. The increase was largely due
to the assumption that more than half of the graduate intake would be female.
Figure 3 shows the change in the age distribution of the medical workforce over the
projection period. The key area of change was the increase in practitioners aged over
60 years with their proportion increasing from 6.6% in 2006 to 15.9% in 2022. The
10 HEALTH WORKFORCE MODELLING, NORTHERN TERRITORYageing of the workforce and positive net migration drove the increase in this age group.
In contrast, large declines occurred in the 40-49 age group. Initially, this group
comprised the largest proportion of the workforce (31.1%), but by 2022, it accounted
for only 18.4% of the workforce. The reduction was due to ageing of the initial
population and migration losses. Although the proportion of the 30-39 age group grew,
its impact on the overall growth of the workforce was constrained by high turnover with
large migration in-flows being matched by equally large out-flows.
Figure 3 Age distribution of NT medical workforce, selected years: 2006, 2014 and 2022
Proportion of 2006
practitioners 2014
35% 2022
30%
25%
20%
15%
10%
5%
0%Figure 4 Alternative scenarios of demand and supply, NT medical workforce, 2006 to
2022
No. of practitioners Needs-based demand
Trend-based demand
1200 Supply
Supply 2006 mobility
1100
1000
900
800
700
600
500
400
2006 2008 2010 2012 2014 2016 2018 2020 2022
Year
On the supply side, the projection was very sensitive to the mobility of the medical
workforce and this is shown in Figure 4 by using the 2006 Census trends. In 2006, net
migration was negative except for male practitioners aged 40 years and over.39 If these
rates were indicative of future patterns of migration, it would mean that in 2022 there
could be 27.5% fewer medical practitioners than in the baseline projection and a
shortfall of 15.7% between demand and supply. It would also alter the structure of the
workforce by substantially increasing the proportion of the workforce aged over 50.
This change would leave the NT vulnerable to older practitioners’ decisions on the
amount of time they will spend in the workforce.
The other key influence on projected supply, but not illustrated in Figure 4, was the flow
of medical graduates. The number of Australian graduates is predicted to increase
substantially in coming years (81.3% between 2005 and 2012)40 and combined with the
proposed NT medical school, it presents an opportunity for the NT to increase its
graduate intake. A 50.0% increase in the annual number of graduates (from 28 to 42)
from 2012 onward increased the size of the medical workforce in 2022 by 22.7%
compared with the baseline projection. If they could be convinced to stay in the NT
then it could have an even greater impact on growth and rebalance the age structure of
the workforce.
Nursing workforce
As with the medical model, the nursing model projected the requirements for, and
supply of, nursing professionals over the period 2006 to 2022 and Figure 5 presents
the baseline projections from the model. Over the projection period, the requirement for
nurses was projected to increase by 50.9% from 1888 nurses in 2006 to 2849 nurses in
2022. As for medical practitioners, diabetes, IHD and COPD were key contributors to
the requirement for services. Lung cancer and stroke were the other major contributors
and together the top five accounted for 37.0% of the nursing requirement in 2022.
The growth in the supply of nurses was projected to be lower than the growth in
requirements in the early years of the projection period. The shortfall widened to 3.4%
of requirements in 2010 then diminished as an increased flow of local graduates
provided a steady boost to the workforce. From 2015 onward, the supply of nurses was
12 HEALTH WORKFORCE MODELLING, NORTHERN TERRITORYprojected to exceed demand and the gap widened over the remainder of the projection
period. By 2022, there would be 9.7% more nurses than were needed to meet growth
in demand. Headcount numbers of nurses exceeded the FTE supplied at the beginning
of the projection period and this gap widened from 221 FTE in 2006 to 336 FTE in
2022.
Figure 5 Demand for and supply of NT nurses, 2006 to 2022
Demand (headcount)
No. of nurses
Supply (headcount)
3200
3000
2800
2600
2400
2200
2000
1800
2006 2008 2010 2012 2014 2016 2018 2020 2022
Year
Figure 6 shows the change in the age distribution of the workforce over the projection
period. The key area of change was the increase in nurses aged less than 40 years
compared with those over 40 years. In 2006, 44.4% of the workforce was aged under
40, but by 2022 it had increased to 64.1%. This change was driven by the inflow of
graduate nurses who were mostly in younger age groups; positive net migration in the
30-39 year group; and the exit from the workforce of older workers due to retirement
and emigration. The proportion of males in the nursing workforce was expected to
increase from 10.9% in 2006 to 13.4% in 2022 and this was driven by the expected
gender profile of graduates.
Figure 7 shows the projected number of undergraduate places, local graduates and
places on DHF’s graduate nurse program. Despite the large number of tertiary places
in NT institutions, a maximum of 130 local students per annum were expected to
graduate during the projection period. The number of local graduates was projected to
exceed the number of places available on the DHF graduate nurse program in 2010.
Without an increase in the places on the program, up to 40 graduates per annum could
be left to seek entry to the workplace through other avenues.
HEALTH WORKFORCE MODELLING, NORTHERN TERRITORY 13Figure 6 Age distribution of NT nursing workforce, selected years: 2006, 2014 and 2022
2006
Proportion of nurses
2014
35%
2022
30%
25%
20%
15%
10%
5%
0%Figure 8 Alternative scenarios of demand and supply, NT nursing workforce, 2006 to
2022
No. of nurses
3900 Needs-based demand
3700 Trend-based demand
Supply
3500
10% less migrants
3300 No extra graduates
3100 Only maternity and migration
2900
2700
2500
2300
2100
1900
1700
2006 2008 2010 2012 2014 2016 2018 2020 2022
Year
Two other key issues for the NT are the mobility of the workforce and graduate
numbers. Any reduction in immigration without an equivalent reduction in emigration
may mean that supply does not match demand. For example, a 10.0% decrease in
immigration had more than twice the impact on the size of the workforce, reducing the
number of nurses in 2022 by 23.7%. Such a situation could occur if competition for
nurses increases from other states and countries. The projections will be equally
sensitive to changes in emigration rates with decreases enabling greater growth in the
workforce and/or reducing the need to attract interstate or overseas nurses. Increases
would, however, have the opposite effect.
A final scenario shown in Figure 8 is the effect of holding graduate numbers constant at
the current level of places on the DHF graduate nurse program. It meant that the
growth in supply was insufficient to meet the growth in needs across the entire
projection period. Such a situation could occur if a lesser number of local students
undertake nursing studies than was projected or excess local graduates are unable to
find alternative pathways into the NT workforce.
Pressure point analysis
The projected demand for medical and nursing services does not fall evenly across
diseases or groups within the population. To examine the relative impact on different
areas, ‘Specialties’ were identified by either the relevant population (Paediatrics – age
14 years and under; Geriatrics – age 65 years and over; Aboriginal Health) or
allocation of BoD groups to a disease-based specialty areas based on the judgement
of a health professional experienced in data analysis.
As shown in Figure 9, the greatest growth was expected to occur in servicing the needs
of elderly people. Demand for medical services from this group more than doubled over
the projection period. This growth means that health services will be treating much
greater numbers of elderly patients in future years and their needs may be more
complex due to their age. The major medical service requirements of the over 65 year
age group were for heart disease, COPD, diabetes, dementia and lung cancer.
Demand from Indigenous Territorians was expected to grow by 50.0% over the
HEALTH WORKFORCE MODELLING, NORTHERN TERRITORY 15projection period. As with the elderly, heart disease, diabetes and COPD were key
drivers of demand for Indigenous Territorians, but their other major requirements –
renal disease and road traffic accidents – differed. In terms of specific disease groups,
the key pressure points for medical services will be the increase in demand for
cardiology (65.4%), oncology (60.1%), internal medicine (55.3%), neurology (54.9%)
and rehabilitation (53.6%) services.
Figure 9 Growth in medical demand by specialty, selected years relative to base year of
2006
2012
Specialty 2018
Geriatrics 2022
Cardiology
Oncology
Internal medicine
Neurology
Rehabilitation
Surgical
Radiology
ENT
Emergency medicine
Renal
Aboriginal health
General medicine
Endocrinology
Infectious disease
Dermatology
Orthopaedics
Psychiatry
Obstetrics/gynaecolo
Paediatrics
1 1.2 1.4 1.6 1.8 2 2.2 2.4
Growth in demand relative to 2006
Note: 2006 is the base year and not shown
For nursing, pressure points were similar to those for medical services with the greatest
growth in need coming from the elderly. In terms of specific disease groups, the key
pressure points for nursing services were expected to be the increase in demand for
cardiology (65.5%), neurology (62.7%), oncology (62.2%), radiology (54.4%) and
internal medicine (53.6%).
The supply of medical practitioners and nurses to work in speciality areas was not
projected due to the lack of a sound data source. The AIHW labour force surveys
gather information on principal areas of practice and specialty areas, but the low
response rate to the surveys mean that many health professionals may not be captured
and estimates based on those who did respond may be biased. Further, the small
numbers of specialists and high mobility of the health workforce means that any data
are unlikely to be stable.
Regional analysis: nursing
The NT needs to provide health services to a small population dispersed over a large
geographic area. Presently, hospitals and other key health services (GPs, aged care
services) tend to be located in the largest, most accessible population centres, namely,
Alice Springs, Darwin, Katherine, Nhulunbuy and Tennant Creek. Beyond these main
urban areas, nurses operate health clinics in small, remote communities complemented
by visiting services from medical practitioners.41 A regional analysis was conducted to
16 HEALTH WORKFORCE MODELLING, NORTHERN TERRITORYshow where the future growth in the nursing requirements was expected to occur. This
analysis also implies where additional support services by medical practitioners would
be needed.
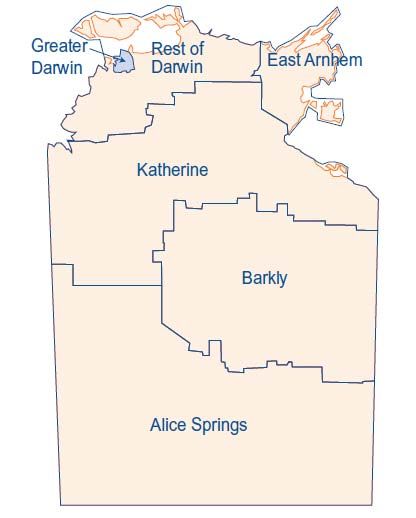
Figure 10 shows the demand for nursing services for six regions based on statistical
reporting areas. A map of the regions is at Appendix 2. The population forecasts by
region were only available up to 2021 so the analysis was restricted to that year.
Between 2006 and 2021, the greatest growth in the requirement for nursing services
was expected from residents in Darwin, Palmerston and nearby settlements. Their
nursing requirements were expected to be 60.0% higher in 2021 than in 2006. The next
greatest increase was expected in East Arnhem (53.3%). Growth was expected to be
lowest in the Katherine region, but the requirement for nursing services from residents
in this area were still expected to be 26.7% higher in 2021 than in 2006.
Figure 10 Growth in nursing demand by region, selected years relative to base year of
2006
Region
2011
2016
Greater Darwin
2021
Darwin balance
East Arnhem
Katherine
Barkly
Alice Springs
1 1.1 1.2 1.3 1.4 1.5 1.6 1.7
Growth in demand relative to 2006
Note: 2006 is the base year and not shown
Benchmark analysis
A key issue for the NT is the adequacy of the current health workforce. To investigate
this matter, the NT workforce was compared with the national average. The number of
health professionals per 1000 population was used as an indicator of availability and
the number of health professionals per 100 disability adjusted life years was used as a
measure of the workforce available to treat the amount of disease and injury in the
population.
As shown in Table 4, the comparison revealed that in 2006 the numbers of health
professionals per 1000 population in the NT were similar to the national average.
Numbers of nurses were slightly less than the national average, but this was offset by
higher numbers of Aboriginal health workers (AHWs). When, however, health need
was considered, circumstances changed considerably. The burden of disease and
injury in the NT was 50% more than in the nation as a whole (198.6 age standardised
DALYs per 1000 population compared with 132.4 nationally). When matched to the
number of health professionals, the NT had at least a third fewer medical practitioners
HEALTH WORKFORCE MODELLING, NORTHERN TERRITORY 17and nurses to treat every 100 DALYs in the population than nationally. The NT has
more AHWs, but as their number is relatively small it does not substantially affect the
total number of health professionals per 100 DALYs.
Further, these ratios do not account for the additional demand associated with the high
levels of comorbidity in Indigenous patients and the loss in efficiency associated with
servicing small, remote communities. These losses include time spent in travel,
minimum staffing requirements and absences or temporary (less efficient) staff for
leave, professional development and other absences. The national figures should,
however, be interpreted with caution as it is not clear that they represent efficient and
effective health care. Rather, they could reflect over-servicing or historical legacies
unrelated to the need for health services.
Table 4 Comparison of the national and NT health workforce by population and burden
of disease, 2006
Workforce Professionals per 1000 Professionals per 100
population DALYs1
Medical practitioners
NT 2.65 1.34
Australia 2.75 2.08
Registered nurses
NT 8.96 4.51
Australia 9.79 7.40
Enrolled nurses
NT 0.75 0.38
Australia 0.94 0.71
Aboriginal health workers
NT 1.07 0.54
Australia 0.05 0.04
Total
NT 13.44 6.77
Australia 13.54 10.22
1
Disability Adjusted Life Years
Sources:
ABS. Australian demographic statistics, June 2008. Cat. no. 3101.0, Table 4. Canberra: ABS, 2008.
AIHW. Health and community services labour force 2006, Table A4.6. Cat. no. HWL 43. Canberra: AIHW, 2009.
Begg S, Vos T, Barker B, Stevenson C, Stanley L, Lopez A. The burden of disease and injury in Australia 2003, Table 5.5. Cat. no. PHE
82. Canberra: AIHW, 2007
18 HEALTH WORKFORCE MODELLING, NORTHERN TERRITORYDiscussion
The baseline projections from the NT workforce models indicated that over the period
2006 to 2022, the supply of medical practitioners should exceed the growth in
requirements for their services from a growing and ageing population and this gap
widened over time. For nurses, the projection initially showed the requirement for
nursing services exceeding supply, but after 2015 this reversed and the excess supply
of nurses increased over the remainder of the projection period. These results depend,
however, on the NT’s ability to continue to attract and retain health professionals at
past levels and to accommodate an increasing number of nursing graduates.
Mobility in the health workforce is an important issue for the NT4 and the modelling
further emphasised the NT’s vulnerability to changes in migration patterns. If inflows of
health professionals were to reduce or outflows increase relative to past patterns, the
NT’s ability to grow its workforce could be substantially impaired. The NT’s requirement
for health professionals is, however, relatively small compared with the large pool of
interstate (and international) medical practitioners and nurses upon which it could draw
so maintaining flows may be more dependent on the cost of recruitment (budget
implications) and the attractiveness of the NT as a location rather than the number of
potential candidates. Recent expansions in university placements also present an
opportunity to secure more graduates and provide a steady, reliable source of growth
for the workforce. The NT appears to be an attractive location for young health
professionals so they may be readily enticed to come. The challenge, however, will be
to retain them as younger health professionals appear equally prepared to leave if
employment and training opportunities are perceived to be better elsewhere.4,42
Reducing outflows would be particularly beneficial to the NT. It could enhance
expansion of the workforce, reduce recruitment costs and improve productivity.4 DHF
has reduced turnover in the nursing workforce over recent years, but about 40% of the
workforce still leaves each year.4 These departures mean that a large number of
nurses need to be recruited to replace those departing as well as extra nurses to
expand the workforce. If turnover is not reduced, the number of nurses that need to be
recruited each year will increase in line with the size of the workforce. In addition to the
recruitment burden, turnover also reduces productivity as newly hired staff are likely to
be less effective than those they replace and remaining staff may become less efficient
as they train new employees, take on extra tasks or responsibilities and increase the
time spent on recruitment.4 No allowance was made for this reduction in productivity in
the modelling, but if stability improves, less of these efficiency losses may mean that
more services can be provided without additional staff.
Mobility also influences the age structure of the workforce. For medical practitioners,
net migration was positive in older age groups leading to an increase in the proportion
of practitioners aged 50 years and over and a reduction in middle aged practitioners.
These patterns had implications for the amount of working hours (older practitioners
tend to work fewer hours) and retirement exits. For nurses, net migration was negative
in older age groups and combined with a large intake of graduates who were expected
to be mostly in younger age groups, resulted in a reduction in the proportion of older
nurses. Although this meant that the NT’s vulnerability to the retirement decisions of
nurses diminished, turnover may increase and the depth of experience reduce.
Local graduates present an opportunity to secure health professionals at the beginning
of their career and they are more likely to remain in the NT than interstate graduates.
Accordingly, increasing their number could reduce mobility. They will also have a
HEALTH WORKFORCE MODELLING, NORTHERN TERRITORY 19greater knowledge of the unique aspects of work in the NT. The establishment of an NT medical school in the near future should increase the number of local medical graduates.31 There are already local nursing graduates, but their number is presently less than the number of places available on the DHF graduate nursing program. This circumstance is, however, likely to change and it could be that local graduates exceed the number of places available on the program. The risk for the NT of this situation is that should these graduates be unable to find alternative pathways into the nursing workforce, they may choose other careers or move interstate to find positions. Although positive, the projections from the models would still mean that Territorians are likely to be disadvantaged relative to Australians as a whole in their access to health professionals. There are far less medical practitioners and nurses available to meet the NT population’s health needs than there are at a national level. This deficit is likely to mean that NT health professionals face a more pressured work environment than their interstate counterparts and Territorians find it more difficult to access their services. The growth projected by the models may narrow the gap, but it would be unlikely to eliminate it. For example, given its burden of disease and injury, the NT would have needed to have a workforce of 3095 nurses (63.9% larger) in 2006 to be comparable to the national average. A level similar to this was projected to be achieved in 2022. Without a change in the burden of disease and injury, 3919 nurses would be required in 2022 to be comparable to the national average. With the majority of nurses in the NT being employed by DHF, such an increase would have implications for recurrent funding with sizeable increases or redistributions required. Capital funding would also need to increase in order to expand hospitals and other health service infrastructure. In addition to the overall size of the health workforce, it is important to ensure that health professionals are located where they are most needed and have expertise in areas of high demand. The regional analysis showed that the greatest increase in the requirement for nurses would be in the Darwin region and it may be relatively easy to attract nurses to work there, but the next area of greatest need, East Arnhem, may be more problematic as it would require recruiting nurses with an aptitude for work in remote areas and typically, new recruits tend to require substantial training and support.4 Retention can also be a challenge.4 Meeting the needs of the elderly Territorians will be a challenge for both professions with demand from people aged over 65 expected to double over the projection period. This group may have multiple conditions complicated by their age that make care more complex and resource intensive. From a disease perspective, key specialty areas where more expertise will be needed are cardiology, oncology and neurology. The results of the NT modelling differ from previous work by the NHWT and Preston.16,19 These models indicated that the NT needed additional graduates for supply to meet demand. The disparity arises for several reasons: first, NHWT and Preston allowed for a shortage of health professionals at the start of the modelling period and this enhanced the gap throughout the projection period. Second, the NHWT model estimated demand using a constant annual increase of 3.8% based on population growth with weightings for Indigenous status and the elderly. Preston applied a population age profile factor of between 2.2% and 3.7%.16 The factor was based on age related usage of nursing services in hospitals, aged care homes and other health and non-health setting that require registered nurses.16 The needs approach of the NT models produced lower annual growth rates: 3.2% at the beginning of the projection period, which then declined to 2.4% by the final year. As noted previously, this growth only accounted for the effects of population growth and ageing; levels of ill-health remained unchanged. Third, the national model set inward and outward migration at the same rate so there was no growth from this source. It also 20 HEALTH WORKFORCE MODELLING, NORTHERN TERRITORY
You can also read