High Level Modeling and Analysis Results from ENSA/DOE Test - PNNL-SA-140105 - Spent Fuel and Waste Science and Technology SFWST
←
→
Page content transcription
If your browser does not render page correctly, please read the page content below
Spent Fuel and Waste Science and Technology (SFWST))

                                                       NRC Division of Spent Fuel
High Level Modeling and Analysis                       Management Regulatory Conference
Results from ENSA/DOE Test
                                                       Washington, DC
Brady Hanson, PNNL            PNNL-SA-140105           December 11, 2018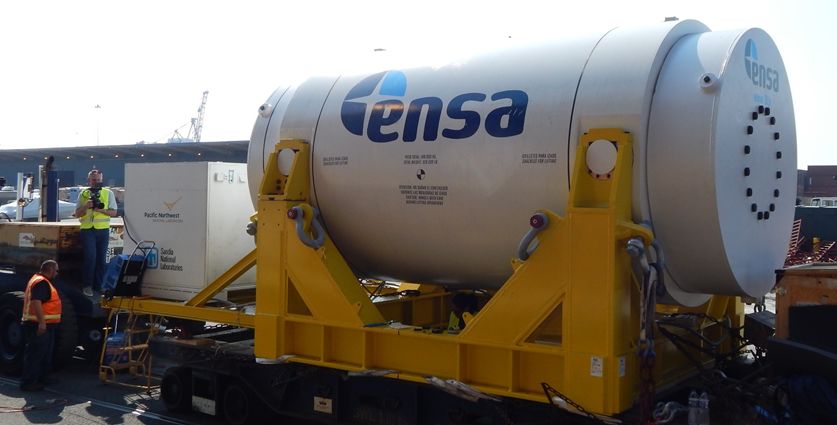
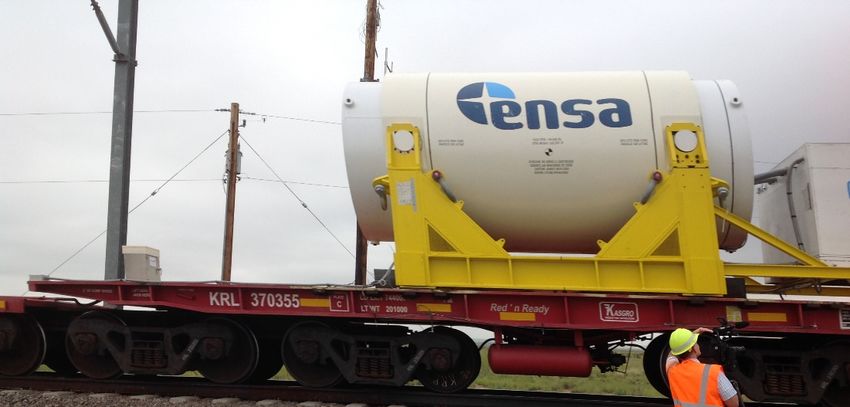
Accelerometers Outside the Cask
These data channels capture the dynamic response of the conveyance system.

           Cask
           Cradle

           Railcar Deck
                                       2                                     energy.gov/ne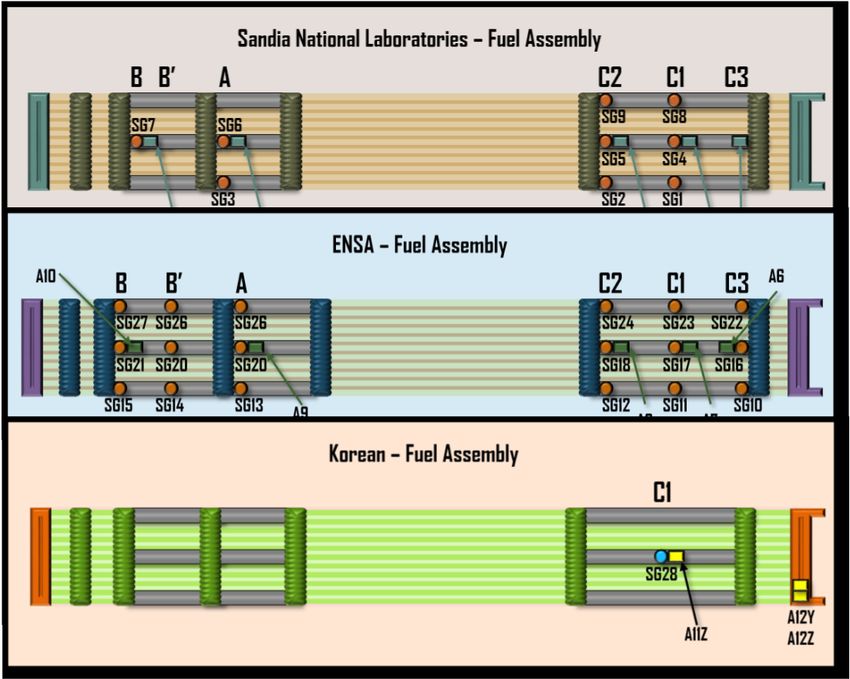
Instrumentation Inside the Cask

These data channels capture the dynamic response of components inside the cask.

      •   Three fuel assembly locations chosen based on PNNL modeling.
      •   37 channels of strain gage data. Locations informed by PNNL modeling.
      •   13 accelerometers located on fuel assemblies.
      •   2 triaxial accelerometers on basket
                                          3                                       energy.gov/ne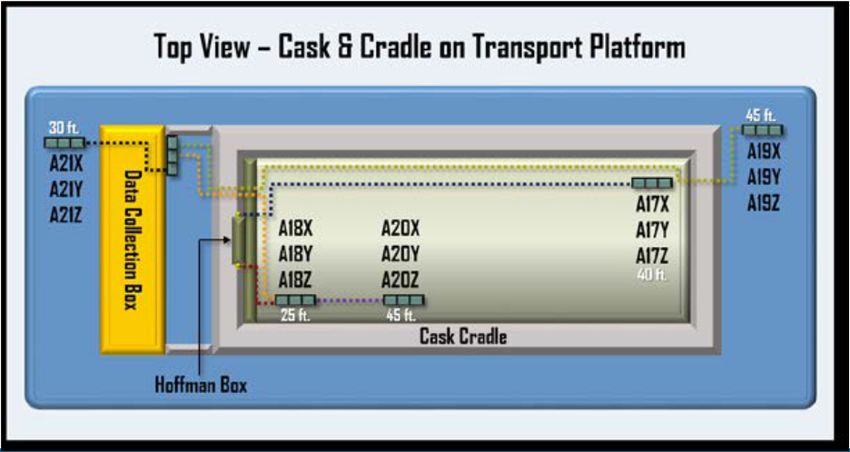
Peak Data Summary from PNNL Filtering
                Highway         Ship         West Rail     TTCI       East Rail
  Peak
                    17           7.2            46          96           74
  Strain (uE)
  Peak Fuel
  Assembly          0.6          1.5            1.4        15.1          2.3
  Acc.
  Peak
                    0.2          1.3            0.3         0.8          1.2
  Basket Acc
  Peak Cask
                    0.2         0.17            0.3         1.2          0.7
  Acc
  Peak
                    0.2         0.17            0.6          6           2.8
  Cradle Acc
  Peak Deck
  Acc              15/5          1.6           8/0.9       27/7         24/5
  (ends/mid)
     •   PNNL data filtering and Power Line Noise reduction applied
     •   1uE = 1 microstrain = .000001 mm/mm = 1 µmm/mm
                                         4                                        energy.gov/ne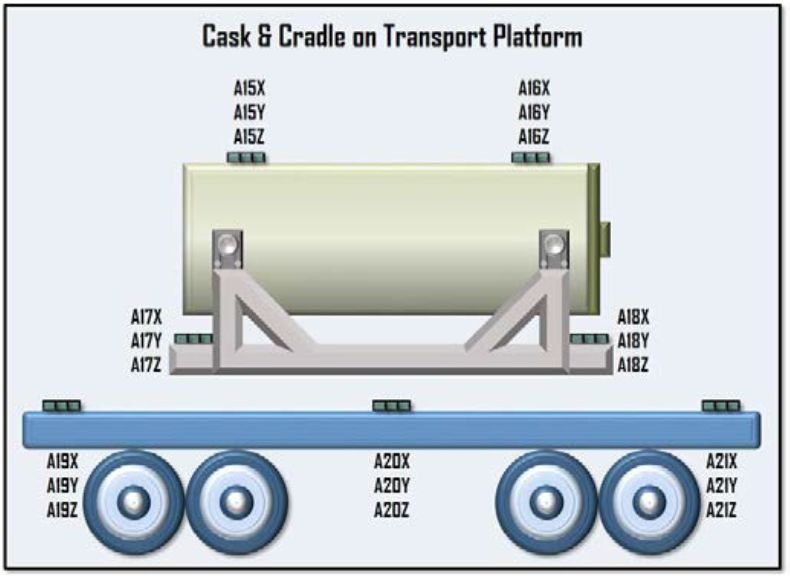
Strain Energy Perspective:
UNF Rod Shock and Vibration Energy Comparisons
Structural-dynamic models predict that the strain energy implied by the strain
values recorded on the fuel cladding is so low that it is comparable to the kinetic
energy in one raindrop.
     Moving Object                Specific Example              Kinetic Energy (mJ)
  Bullet               AR-15                                              1,854,000.0
  (Muzzle Energy)      9 mm Handgun                                         467,000.0
  Golf Ball            PGA Tour, Male (168 mph)                             129,000.0
  (Off the Tee)        Amateur, Bogey Golfer (131 mph)                       77,000.0
  Bird Flying          Robin (25 mph)                                         4,400.0
                       European Swallow (19 mph)                              1,200.0
  Ping Pong Ball       World Record (70 mph)                                  1,300.0
  (Table Tennis)       Average (25 mph)                                         168.0
  Single Raindrop      Heavy Thundershower (130 mg, 20 mph)                       5.2
                       Moderate Rain (37 mg, 17 mph)                              1.0
                       Light Drizzle (8 mg, 14 mph)                               0.1        1 Rod
  Fuel Rod Vibration   Single Rod Model Estimate (50 mph P&B)                     1.3
  (Strain Energy)      Gravity                                                    0.7
  Flying Insect        Wasp (15 mph)                                               2.2
                       Housefly (4 mph)                                          < 0.1

                                               5                                         energy.gov/ne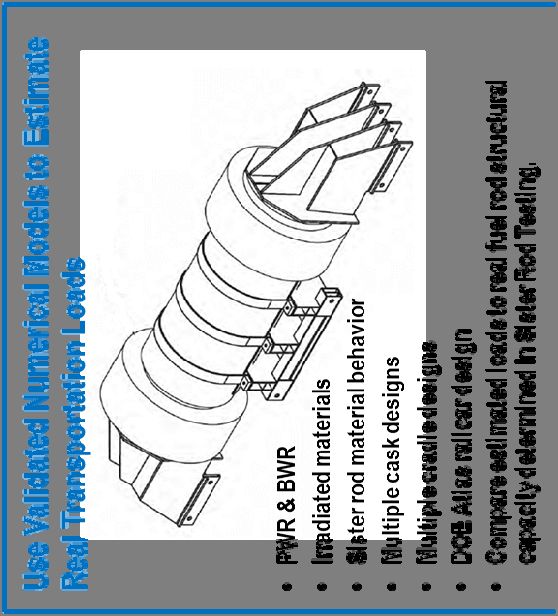
Cladding Fatigue Summary
                            Westbound Rail Accumulated Fatigue Damage

  Westbound rail total accumulated fatigue damage for each strain gage. All damage fractions
  are less than 1E-10, when a damage fraction of 1.0 indicates fatigue failure. Damage is
  calculated according to Miner’s Rule, ASTM rainflow counting, and the O’Donnell irradiated
  zircaloy S-N curve.

 10,000,000,000+ trips of 2,000 miles before fatigue failure would occur
                                                6                                              energy.gov/ne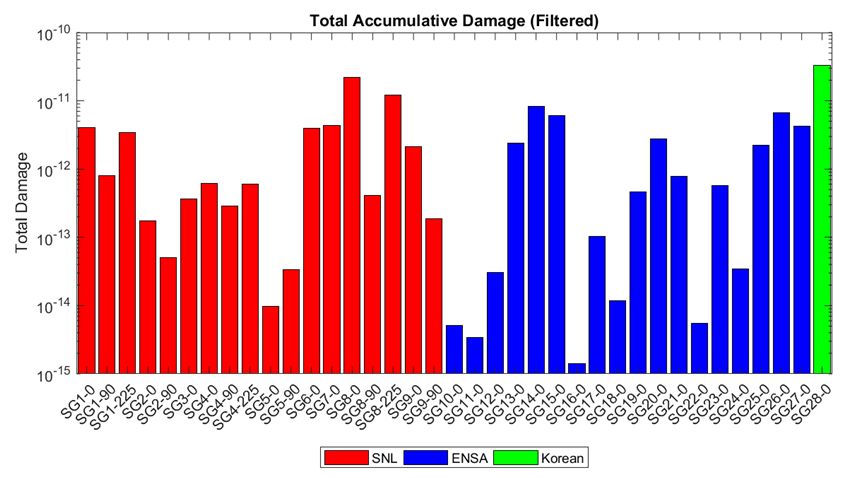
Conclusions and On-going Work

• The shock and vibration loads on the fuel rods recorded
  in the MMTT are approximately zero.
   – The cladding strains are below normal engineering notice.
   – Cladding fatigue damage is below the practical endurance limit.
   – The peak strain energy in the cladding is comparable to the
     kinetic energy of a raindrop.
• Structural-dynamic models are validated against test
  data.

                                  7                                energy.gov/ne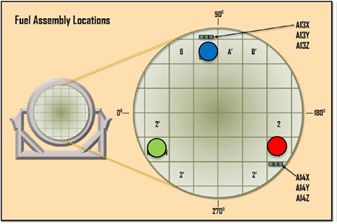
Key DOE NE Reports on MMTT

•   McConnell PE, SB Ross, CA Grey, WL Uncapher, M Arviso, R Garmendia,
    IF Perez, A Palacio, G Calleja, D Garrido, AR Casas, LG Garcia, W Chilton,
    DJ Ammerman, J Walz, S Gershon, SJ Saltzstein, K Sorenson, NA
    Klymyshyn, BD Hanson, R Pena, and R Walker. 2018. Rail-Cask Tests:
    Normal-Conditions-of- Transport Tests of Surrogate PWR Fuel Assemblies
    in an ENSA ENUN 32P Cask. SFWD-SFWST-2017-000004, Sandia
    National Laboratories, Albuquerque, New Mexico.
•   Kalinina EA, C Wright, N Gordon, SJ Saltzstein, L Lujan, KM Norman.
    2018. Data Analysis of ENSA/DOE Rail Tests. 2018. SFWD-SFWST-2018-
    000494, Sandia National Laboratories, Albuquerque, New Mexico.
•   Klymyshyn N.A., P. Ivanusa, K. Kadooka, C.J. Spitz, P.J. Jensen, S.B.
    Ross, B.D. Hanson, D. Garcia, J. Smith, S. Lewis. 2018. Modeling and
    Analysis of the ENSA/DOE Multimodal Transportation Campaign. 2018.
    PNNL-28088. Richland, WA: Pacific Northwest National Laboratory.
     –   This presentation is a summary of this report. See this report for additional information.
•   Klymyshyn et al. 2019 (Final modeling report)

                                                     8                                                energy.gov/ne
Questions?
9 energy.gov/neYou can also read