HOTEL INSIGHTS A quarterly digest of key trends in the hospitality sector - COLLIERS INSIGHTS - Colliers International
←
→
Page content transcription
If your browser does not render page correctly, please read the page content below

COLLIERS INSIGHTS               HOTELS | ASIA | Q2 2019

        Govinda Singh
      Executive Director
  Valuation & Advisory | Asia
        +65 6531 8566
  Govinda.Singh@colliers.com

                                HOTEL INSIGHTS
                                A quarterly digest of key trends in the hospitality sector
COLLIERS INSIGHTS    HOTELS | ASIA | Q2 2019

                                                                FOREWORD
                    ‘’Robot‐assisted hotel services get
                    generally high marks in a study of guests
                    at 88 hotels in China.
                    Guests reported making fairly frequent
                    use of the robots, primarily for such
                    relatively simple functions as turning on
                    the lights and turning off the TV.
                    Chief problems occur when the robot
                    cannot recognise operation commands,
                    when guests must repeat their request,
                    and when the robot isn’t actually
                    programmed for a particular operation.
                    Asked what services they expect from a      Welcome to the Q2 2019 edition of Colliers Hotel Insights, our quarterly magazine for hotel and other
                    hotel robot, guests cited food              accommodation stakeholders across Asia. This edition features key destination trends across Asia, a
                    distribution, delivering goods, handling    highlight of key industry disruptors, and a technical section. We also provide insights and opinions on
                    check‐in and checkout, and providing        topical issues within the gaming and leisure sectors.
                    travel information and consumption          Hotels across Asia Pacific have had a tough Q1 in 2019 when compared to the corresponding period in
                    recommendations.                            2018, with overall room occupancy and average daily rate (ADR) showing decreases to 67.4% and
                    Two‐thirds of customers considered that     US$103.46, respectively. This resulted in RevPAR for the region showing a decline of some 7.2% year‐
                    “robot rooms” present a good value, and     on‐year. We note this figure would have been negatively impacted by forex currency movements
                                                                together with economic fundamentals. In terms of room occupancy, Delhi‐NCR, Metro‐Manila and Seoul
                    a similar proportion were willing to make
                                                                were the stand out performers, with year‐on‐year growth in excess of 3%, according to STR. HCMC, KL,
                    a return visit to rooms equipped with       and Phuket led the crowded field in being the worst performers.
                    robots.
                                                                In local currency terms, Bali, Hanoi, Mumbai, all witnessed increases in excess of 7% in terms of ADR.
                    Keys to the acceptance of hotel robots      KL, Phuket, Sanya, Seoul and Shanghai witnessed declines, with Osaka slipping significantly.
                    are that they must provide worthwhile
                                                                It is evident that the recent escalation in the trade dispute and political impasse between the USA and
                    services and be easy to use.”
                                                                China is starting to weigh on business and consumer confidence, thereby tempering demand growth.
                    – Extract from “Robot Rooms” How Guests     This, combined with movements in forex, the Mount Agung eruption, and the fall in the number of
                    Use and Perceive Hotel Robots – Cornell     Chinese visitors to Thailand, together with new supply in some destinations has all significantly
                    Centre For Hospitality Research (2019)      impacted performance. However, we note that intra‐Asia and growing domestic travel in the larger
                                                                destinations across Asia, is likely to continue to underpin demand in the region. As such, we would
                                                                expect some upturn in performance in the coming months. On that note, good reading!
    2
COLLIERS INSIGHTS    HOTELS | ASIA | Q2 2019

                    TABLE OF CONTENT
                                                                 Page                             Page

                    HOTELS                                        3     GAMING UPDATE             11

                    Opinion: Hotel Feasibility Studies            4     About Colliers Hotels     13

                    Destinations of the Quarter – Singapore       5     Next Quarter / Contacts   13

                    Destinations of the Quarter – Kuala Lumpur    8

                    HOTEL INVESTMENT AND VALUATION               10

                    Capital markets insights                     11

                    Recent notable transactions                  11

    3
COLLIERS INSIGHTS   HOTELS | ASIA | Q2 2019

                                              HOTELS OPINION
                                              The hotel feasibility study – Is it worth the time and cost?
                                              Our specialists take on the do’s and don’ts of hotel investment
                                              As the time for build it and they will come ends for many destinations as they mature,
                                              and with an ever increasing competitive environment, investors have begun to ask
                                              the right questions. Questions, that in our opinion must always be asked before a
                                              hotel is built.
                                              First of all it is important to differentiate between a market research report and a
                                              feasibility study. Whilst a market research report may do well in providing enough
                                              information for decision making for ‘traditional’ assets, for hotels and other any
                                              property type that has dynamic cash flows such as casinos, golf, meetings, incentives,
                                              conference and exhibitors (MICE) etc., this is hardly sufficient. The true value in a
                                              feasibility study is not to gain market data (most of which is readily available in this
                                              age) but in obtaining insight, information and recommendations from specialists who
                                              have had hands on experience in the industry. Developing a proposition that is:
                                              > Relevant – Will it still be relevant three years plus from now (i.e. for new projects
                                                allowing time for construction)? Will it still be relevant 20 years from now?
                                              > Focused – What should be the number of rooms and mix? What market
                                                positioning and facilities/amenities should be provided to ensure success? Suite
                                                mix, number of covers, destination concepts or not? To brand or not to brand?
                                              > Consider competitive environment – what is the impact of demand generators in
                                                the area and how will the hotel integrate with the wider development and
                                                destination seamlessly? How can it be leveraged to add value? What does the
                                                existing and future competitive landscape look like and what would the impact be
                                                on the proposed development?
                                              > Maximises ROI – Even if the motivation is not to make a profit, it is important for
                                                the hotel to be self sufficient to avoid future operating challenges. Does the
                                                business model stack up for lending and operating cashflows?
                                              In an increasingly competitive environment, it is vital that hotels stay relevant well
                                              into the future, at least taking their fair market share. Preconceived concepts may
                                              work in less mature destinations, but as experience has taught us, these have a habit
                                              of not remaining relevant, at tremendous cost to the owner over time.

    4
COLLIERS INSIGHTS       HOTELS | ASIA | Q2 2019

                    DESTINATIONS OF THE QUARTER
                    Singapore
                     Singapore tourism statistics 2011–2019F

                                                           Room stock          Tourism arrivals (m)             Tourism receipts (S$bn)            Visitor days (m)
                      100                                                                                                                 68,444            69,214        70,929       80,000
                                                                                                      60,841            63,706
                        80                                        55,018          57,050
                                  49,719         51,579                                                                                                                    63.4        60,000
                                                                                                                         56.3             58.8               61.6
                        60                        51.4             54.2            56.1                55.0
                                  49.1
                                                                                                                                                                                       40,000
                        40                                                                                                                26.8               27.1          27.9
                                  22.3            23.1             23.5            23.6                21.8              24.8
                        20                                                                                                                                                             20,000
                                  13.2            14.5             15.6            15.1                15.2              16.4             17.4               18.5          19.2
                         0                                                                                                                                                             0
                                  2011            2012            2013             2014               2015              2016              2017               2018         2019F

                    Source: STB

                    Hotels in the Garden City continue to do well                                             2016, increasing by a whopping 8% into 2017 and another circa 1% in 2018.
                                                                                                              The increase in tourism receipts was boosted by more tourist arrivals from
                    Tourism arrivals in Singapore are expected to grow by 3.5% in 2019                        high‐spending markets such as China, South Korea, the US and the UK. In
                    following a relatively strong performance in 2018. In 2019, visitor arrivals are          addition, the forecast for tourism receipts is to grow by another circa 3% in
                    expected to reach 19.2m, with a further 3% growth forecast for 2020. This is              2019 mainly attributed to higher spending in sightseeing, entertainment,
                    a robust performance after the stagnant figures in 2015, and strong growth                gaming and shopping for health and wellness products.
                    in 2016, and is mostly underpinned by an increase in visitation from North
                    and South Asia, and in particular China, Indonesia and India. Tourist arrivals            According to the Singapore Tourism Board (STB), circa 55% of overnight
                    from India have seen the highest spike of 13% with cruise arrivals going up               stays are in hotels (latest available), of which 47% of visitors are repeat
                    by 27%. This growth represents a compound annual growth rate (CAGR) of                    guests. The main purpose of visit is leisure/VFR (Visit Friends/Relatives)
                    6% between 2010 and 2019f. In 2018, the average length of stay fell to 3.3                (70%), with circa 14% here on business/MICE visits. Considering these
                    days, from 3.4 days previously recorded. However, total visitor stays (what               statistics, it suggests that Singapore still requires a significant amount of
                    really matters to hotels), grew by a CAGR of 4.8%. With the changing travel               hotel rooms to accommodate its visitors, with growth in visitation being
                    habits of travelers from nearby source markets, the average length of stay is             tempered by the low level of room supply especially at the mid‐market to
                    expected to dip slightly as day trips and shorter corporate trips become a                lower end. This is despite the addition of 2,865 rooms in 2016 and the
                    common sight in Singapore. This is perhaps not surprising given the relative              significant 7.4% increase in 2017 (4,738 rooms). Although there were only
                    high costs of staying in hotels in Singapore, with ADR increasing 1.7% to                 770 rooms added in 2018, we note that an estimated 1,700 rooms are
                    S$219 by the end of 2018.                                                                 expected to enter the market in 2019, as room supply continues to be
                                                                                                              moderated in Singapore.
                    Tourism receipt per capita decreased from S$1,691 in 2011, to S$1,430 in
                    2015, a drop of 15.4%. However, tourism receipts started to rebound in
    5
COLLIERS INSIGHTS       HOTELS | ASIA | Q2 2019

                    Hotel supply to remain muted in the short term                                   From our analysis, in 2012, given that 65% of overnight visitors would stay in
                                                                                                     a hotel, based on the total number of available rooms at that time gives an
                    With the recent tender of the government land site at Club Street, the white     implied room occupancy of 134%. From the hotel statistics provided by STB,
                    sites at Pasir Ris Central and Marina View, which can together potentially       which indicates that room occupancies for 2012 were 87%, this suggests
                    accommodate circa 930 rooms, in our estimation, we expect another 2,500          only circa 64.9% of those requiring accommodation were able to do so
                    rooms to be added between 2022 and 2025. Significant new hotels                  in a hotel.
                    scheduled to open beyond 2021 include the Pullman Singapore (342 rooms),
                    Banyan Tree Mandai (400 rooms), and Club Street (390 rooms). In addition,        Fast forward to 2018, when hotel room occupancies have dipped slightly to
                    in circa 2025 we expect Marina Bay Sands (MBS) and Resorts World Sentosa         86% for the year, indicating that only 46% of the 55% requiring rooms would
                    (RWS) to add 2,100 rooms as part of their integrated resort (IR) expansion       have been accommodated. We note that the implied room occupancy for
                    plans. It is therefore likely that demand will continue grow as the IRs expand   2017 would have dropped to 107%, given the increase in new supply. This
                    their offerings.                                                                 remained rather stagnant in 2018, nevertheless, we expect implied room
                                                                                                     occupancy to rebound in 2019, given the growing demand from
                     Singapore hotel room stock vs overnight stays                                   international arrivals. Perhaps its time to reconsider more development and
                                                                                                     investment in this sector.
                                                        Room stock   Overnight stays                 In 2018, occupancy grew to 86%, with average daily rate (ADR) increasing by
                      100,000                                                                  80    1.7% resulting in a revenue per available room (RevPAR) growth of 3.5% to
                                                                                                     S$188.6. This was mainly underpinned by the substantially low supply of
                        80,000                                                                       new hotels entering the market against a backdrop of surging visitor arrivals.
                                                                                               60
                                                                                                     Hoteliers were therefore able to maximise their yield strategy through
                        60,000
                                                                                               40
                                                                                                     higher room rates.
                        40,000
                                                                                                      Singapore hotel KPIs
                                                                                               20
                        20,000
                                                                                                                       ADR (SGD)    RevPAR (SGD)         Room occupancy (%)
                               0                                                               0
                                                                                                       300                                                                      88
                                      2008
                                      2009
                                      2010
                                      2011
                                      2012
                                      2013
                                      2014
                                      2015
                                      2016
                                      2017
                                      2018
                                     2019f
                                     2020f
                                     2021f
                                     2022f
                                     2023f
                                     2024f
                                     2025f
                                     2026f
                                                                                                                                                                                87
                                                                                                       250                                                                      87
                                                                                                       200                                                                      86
                    Source: STB, URA and Colliers forecast                                                                                                                      86
                                                                                                       150                                                                      85
                                                                                                                                                                                85
                    In terms of hotel performance, room occupancy remains well in excess of            100                                                                      84
                    83% despite the new supply. In any event, a closer look at the room stock            50                                                                     84
                    versus demand, suggest that hotels in Singapore are full almost all the time                                                                                83
                                                                                                          0                                                                     83
                    during peak periods, and especially during Monday to Thursday, and
                                                                                                                   2012 2013 2014 2015 2016 2017 2018              Feb Feb
                    Saturday nights. This suggests that there is a high degree of existing                                                                        2018 2019
                    frustrated and latent demand, whereby visitors who wish to come to                                                                            YTD YTD
                    Singapore either cannot find rooms or have to turn to alternative
                    accommodation providers.                                                         Source: STB
    6
COLLIERS INSIGHTS      HOTELS | ASIA | Q2 2019

                    Going forward, as tourist arrivals increase, and given a positive economic
                    and geo‐political outlook, we expect room occupancy to continue to grow
                    slightly in 2019 and beyond. In addition, given the already high room
                    occupancy levels, and the continued low levels of new supply anticipated,
                    hoteliers can be expected to drive room rates even higher. This would
                    ultimately result in year‐on‐year income growth over the coming years.
                    However, much of this will depend on the global economic outlook, and
                    the fallout from the trade disputes between the US and the rest of the
                    World. Indeed, much will also rest on the outcome of the 2020 US
                    elections.
                    In our view, Singapore will continue to remain as a global hub, largely
                    drawing on its largest source markets across the Asia Pacific region. The
                    planned new attractions and infrastructure projects scheduled between
                    2020 and 2030 bodes well for future visitation and combined with the
                    relatively low level of new room supply, we consider this should continue
                    to underpin hotel fundamentals over the medium term. In addition, the
                    Singapore government constantly monitors land use to ensure there is
                    minimal demand/supply imbalance.
                    As such, given this background, recent and anticipated trends, we expect
                    overnight stays to continue to outstrip hotel room stock, as is evident in
                    previous years. This therefore bodes well for any planned new hotel supply
                    over this period.
                    Final thoughts – capital values
                    Given the government’s recent announcement of the hike in development
                    charges, we expect this to put a dampener on hotel development projects.
                    This, combined with the already high land costs, is therefore likely to put
                    off any new development and refocus capital on existing projects or those
                    properties that can be easily converted to hotel use within the existing plot
                    ratio. As such, we expect this to continue to fuel interest in existing
                    properties, with the hunt for yield giving away to long term capital
                    appreciation for investors in the city state. REITs’ anyone?

    7
COLLIERS INSIGHTS      HOTELS | ASIA | Q2 2019

                    DESTINATIONS OF THE QUARTER
                    Kuala Lumpur
                    A storm in a teacup
                    Being amongst the fastest growing metropolitan regions in Southeast Asia,
                    Kuala Lumpur holds firm as the national capital and largest city in Malaysia.
                    According to the Department of Statistics Malaysia, from 2010 to 2017 (latest
                    available statistics), Kuala Lumpur registered a Compound Annual Growth
                    Rate (CAGR) of 7.7% in real Gross Domestic Product (GDP) growth, higher
                    than most cities in the region. This was primarily backed by strong growth in
                    the construction and services sector, which contributed 12.8% and 6.6% to
                    the city’s GDP growth respectively. Although growth is holding up, albeit at a
                    slightly slower pace than before, in the short term, any geo‐political risk such
                    as potential risk of trade war, slowdown in overseas remittances, and
                    fluctuations in the exchange rate in key source markets will affect the
                    country’s economic growth.
                    Kuala Lumpur is currently the 7th most visited city in the world, and the 3rd
                    most visited city in South‐East Asia after Bangkok and Singapore. The city has
                    recorded 12.58 million international visitors in 2017, which saw an 11.5%              point as compared to the previous year. This further proves that tourism
                    increase in tourist numbers as compared to 2016. Although growth in tourism            plays an integral part in the country’s growth.
                    arrivals has largely stalled for Malaysia overall according to the latest statistics
                                                                                                           Kuala Lumpur is mainly seen as a corporate and a Meetings, Incentives,
                    by Tourism Malaysia, KL witnessed a 7.1% growth largely underpinned by a
                                                                                                           Conference and Exhibitions (MICE) hub with leisure demand coming from
                    strong domestic market with strong growth in the Indonesian, Vietnam, US
                                                                                                           regional and domestic visitors travelling to Kuala Lumpur for shopping and
                    Korean and Middle Eastern markets. Tourism in Kuala Lumpur has been
                                                                                                           entertainment. However, whilst foreign visitation to the city is significant,
                    heavily reliant on several key source markets, namely Singapore, Indonesia,
                                                                                                           even more so is the size of its domestic tourism market. Domestic tourism
                    China, Thailand and Brunei. The provision of Mandarin speaking desks, the
                                                                                                           dominates hotel market performance in Malaysia accounting for 20.5% of
                    addition of the Kuala Lumpur‐Frankfurt route and an increase of flight
                                                                                                           total arrivals to hotels in 2017 (latest available), of which Kuala Lumpur
                    frequency from Kuala Lumpur to various Korean cities should boost
                                                                                                           accounts for circa 19% of total domestic arrivals. Overall, the city attracted
                    connectivity and visitations from other source markets. As such, this might
                                                                                                           some 17 million visitors in 2016, reversing the downward trend witnessed in
                    have offset the significant slump in tourists from Singapore, China and Brunei.
                                                                                                           2015. In 2017 alone, 19 million domestic visitors were recorded to have
                    The average length of stay for international visitors in Kuala Lumpur is 5.5           taken trips into Kuala Lumpur, which was an increase of 11.8%.
                    nights, whereas domestic visitors recorded an average of 2.3 nights.
                    Staycations are growing in popularity among Malaysians and the nation’s
                    capital could expect to benefit from promising domestic business. The main
                    purpose of visiting Kuala Lumpur has been largely leisure, with 71.2% (latest
                    available) of total visitors taking leisure trips, an increase of 0.5 percentage
    8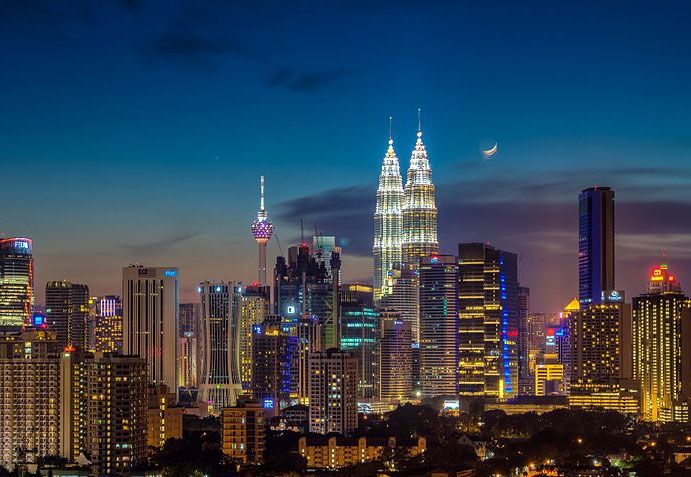
COLLIERS INSIGHTS       HOTELS | ASIA | Q2 2019

                    Domestic tourism boost with good investment opportunities                           as supply is being absorbed. However, when the region’s tallest skyscraper
                                                                                                        Merdeka PNB 118 completes in 2021, Park Hyatt Hotel will stand to occupy
                    According to the Malaysia Inbound Tourism Association (MITA), the increase          the top floors. 8 Conlay, which will include the world’s tallest spiraled twin
                    in domestic tourism can be attributed to the weakening of the Ringgit which         residential towers will also bring the Kempinski brand into the luxury
                    has pushed Malaysians to holiday at home. According to Tourism Malaysia,            market. Other luxury brands entering the market are in the likes of Jumeirah
                    the most common reasons for travelling within Malaysia are visiting friends         and Sofitel SO, whilst Singaporean property developer Oxley Holdings is set
                    and relatives (43.6%) closely followed by shopping (33.1%).                         to bring another set of towers in 2023, just nearby the famed Petronas
                                                                                                        Towers.
                    Kuala Lumpur hotel KPIs
                                                                                                        The entry of such luxury brands will be a disruptor to the market,
                                                                                                        suppressing ADR of the overall market. Occupancy levels will also face
                                    ADR (MYR)       RevPAR (MYR)           Room occupancy (%)
                                                                                                        downward pressure over the short to medium term but as the pipeline
                      400                                                                        72
                                                                                                        increases; we would therefore expect hoteliers to offer discounts to boost
                      350                                                                        70     room occupancy levels. While the outlook for upscale and above segments
                      300                                                                        68     looks optimistic, the 3‐star category and below face pressure in terms of
                      250
                                                                                                 66     occupancy and room rates due to rising competition from home‐sharing
                      200
                                                                                                 64     facilities such as Airbnb.
                      150
                      100                                                                        62     In terms of hotel transactions, recent deals include the 418‐key Royale
                       50                                                                        60     Chulan Bukit Bintang Hotel sold at RM197 million (RM471,292 per key) in
                        0                                                                        58     March 2019 and the 265‐room Hilton Garden Inn Kuala Lumpur Hotel sold
                                  2015   2016    2017      2018             Jan 2018 Jan 2019           by Singapore’s Royal Group in August 2018 with a transacted volume of
                                                                              YTD      YTD              RM240 million (RM905,660 per key). Another notable though related
                                                                                                        transaction was the sale of the Majestic Hotel Kuala Lumpur in May 2017 for
                    Source: STR
                                                                                                        RM380 million (RM1,266,667 per key) by YTL Corp Bhd to YTL Hospitality
                                                                                                        REIT.
                    Kuala Lumpur’s hotel occupancy was on an increasing trend from 2015 to
                    2017, recording a CAGR of 2.3% over the period. ADR, on the other hand              Overall, hotel investment in Kuala Lumpur is likely to be driven by HNWIs
                    registered a slight drop of 0.6%, giving an overall increase in RevPAR of 6.5%.     from Malaysia, the Middle East and Hong Kong looking for a primary
                    This was underpinned by an increase in tourist arrivals into the city, especially   residence or trophy assets. Buyers from China, Indonesia and Taiwan are
                    Mainland Chinese which saw a growth of 7.4% in 2017.                                also looking for investment opportunities, although there continues to be
                                                                                                        concern over China’s restrictive policy for outward investment and the
                    However, occupancy and ADR declined circa 3.3 percentage points and 3.5%
                                                                                                        country’s political aims. This remains a volatile challenge for developers of
                    respectively in 2018, resulting in RevPAR dropping by circa 6.6%. This impact
                                                                                                        mega‐projects who expect to tap into this market. Nevertheless, the market
                    can be attributed to the increasing supply of branded upper upscale and
                                                                                                        volume of mainland Chinese buyers looking to invest in rental properties is
                    luxury hotels in the market, adding 1,313 rooms into the sector in 2017
                                                                                                        expected to remain active, with fully‐furnished units preferred by foreign
                    alone. From 2018 to 2022, approximately 3,795 new rooms (17 hotels) will
                                                                                                        buyers who focus on recurring rental yields. In view of the slowdown in the
                    enter the market, with 85% of rooms categorised in the luxury segment.
                                                                                                        residential property market and the challenging office and retail sectors that
                    Over the short to medium term, Kuala Lumpur will have to manage their               are being swarmed by oversupply, the hotels sector in Kuala Lumpur may
                    demand and supply disparity, with ADR growth rates expected to remain low           then present itself as a more viable investment option.
    9
COLLIERS INSIGHTS HOTELS | ASIA | Q2 2019
HOTEL INVESTMENT AND VALUATION
Capital markets insights Recent notable transactions
After a strong 2016 and 2017, which witnessed a number of high profile In this quarter, most of the transactions across Asia were in gateway cities,
transactions, the dearth of supply has meant that the 2018 transaction where investors remain very active.
market was relatively subdued in comparison. Investment in the sector is
expected to come in more than 25% down on 2017, as Chinese capital and
pricing levels deterred investors. Hotel Location Value per room (USD)
In 2019, this trend has continued, as owners consolidate their portfolios and 300 million
Six Senses Hotels Resorts Spas Global
seek opportunistic investments as the bid‐ask gap remains at historically (Equity deal)
high levels. Indeed, attention will continue to swing towards more
acceptance of development risk as valuations remain high, and investors 2 billion
Citizen M Global
seek higher returns. (Equity deal)
Interestingly, as the market seeks returns, investors are turning to REIT’s,
and purchasing equity stakes in hotel operating companies. We have seen Hilton Tokyo Odaiba Tokyo 1.2 million
GIC taking a strategic stake in the budget lifestyle hotel operator Citizen M,
and IHG following Accor and Marriott in ramping up their luxury offering
through the acquisition of Six Senses. Royale Chulan Bukit Bintang Hotel Kuala Lumpur 0.1 million
We expect further consolidation and strategic investments to be the theme
for 2019. This will be supported by assets being injected into REITs, and even Source: Colliers Research.
Note: USD conversions are at time of transaction and represent approx. values.
consolidation of REITs to take advantage of high valuations.
Overall, despite strong demand driven by both family offices and private
equity with Asian real estate mandates, quality inventory remains scarce and
thus investors with disposition scenarios in the next 12 months, should
consider expediting their process in order to take advantage of favourable
market conditions, especially as the outlook for increases in interest rates
remains high.
Continuous investment into asset class by institutional investors and the
dearth of assets being sold show that yields have been low and are expected
to remain low, at least until interest rates increase significantly. In addition,
sites that have potential alternative use will continue to depress yields
derived on hotel income.
10COLLIERS INSIGHTS HOTELS | ASIA | Q2 2019
GAMING UPDATE
Update on Asian gaming market
2018 was a strong year for casinos across Asia. From Macau to Cambodia,
operators boasted strong gross gaming revenues (GGR) as the market
recovered from its slump. Whilst VIP revenues have continued to witness a
significant drop especially in Macau, mass market play continues to gain
ground, with 2018 gross gaming revenue increasing by 14%, recording the
second consecutive year of gain as demand from the Mainland Chinese
continued to rebound after a prolonged slump.
The big winner of the continued VIP fallout from the mature destinations
appears to be mainly benefitting those in emerging markets with Cambodia
largely benefitting from the fall out in Macau. NagaCorp, Cambodia’s largest
casino in Phnom Penh, witnessing a whopping 54% increase in GGR for 2018,
when compared to the previous year with the recently opened Naga 2
contributing to this result.
The Philippines also witnessed a strong 23% increase in GGR in 2018, most
of which were generated by the four integrated resorts in Manila’s In our estimation, the size of the Asian gaming market, which remains
Entertainment City. directly correlated with GDP growth in Asian source markets (0.91
correlation factor over last five years), is likely to slow in the short to
Gaming revenues in Vietnam are likely to have grown as well, albeit at a
medium term. We estimate that after a period when there was significant
slower pace. The destination continues to suffer from poorly located
latent demand for gaming in the region, supply has now caught up, and the
properties, visa restrictions, in addition to a very opaque and fragmented
sector is relatively mature. As such, any new supply will have to be
market. We note that the first casino to allow locals is expected to open in
competitive and offer a unique product that can capture demand from other
2019 with this potentially paving the way for others casinos?
established destinations in the short to medium term.
It is debatable how much additional GGR this could generate or would it
Our estimate of total potential GGR in 2019 is circa US$91.7 billion, with this
simply cannibilise demand from existing border casinos?
mostly driven by the traditional mature destinations of Macau and
Asian gaming has and continues to shift rapidly to new norms. Previous Singapore. Going forward, with the recent announcement of the integrated
levels of frustrated and latent demand are being quickly absorbed as new resort expansion in Singapore, and the impending concession review in
supply enters the market, and as governments across Asia realise they are Macau, this is likely to increase the competitive market in the medium to
leaving money on the table (or giving it away in some cases) by not long term, with these established markets potentially increasing market
penetrating the gaming market, regulating and taxing it at the right levels. share. This poses an interesting dilemma for properties in Japan.
This, combined with slowing growth in demand, has meant that investors
are no longer witnessing the eye watering returns as with previous
investments and must be more discerning.
11COLLIERS INSIGHTS HOTELS | ASIA | Q2 2019
Relationship between GDP and gaming revenue
2015 2016 2017 2018 2019F 2020F 2021F 2022F 2023F 2024F
GDP Asia Pac (US$bn) 22,669.7 23,712.0 25,272.2 27,105.4 28,654.6 30,949.0 33,359.4 35,909.2 38,652.8 41,595.7
Potential GGR Asia (US$bn) 79.3 83.0 83.4 89.4 91.7 95.9 103.4 111.3 119.8 128.9
GGR as % of GDP 0.35% 0.35% 0.33% 0.33% 0.32% 0.31% 0.31% 0.31% 0.31% 0.31%
Source: IMF WEO April 2019 and Colliers estimates
An increasingly crowded market Gaming is a key driver for international visitation in the region, and if done
correctly can add value to local economies, whether it be from income tax
The announcement that Japan will be legalising gaming in 2016 did not have contributions, or job creation, and the multiplier effect that can have. As
any impact at the operational level of existing properties, but it has impacted such, the feasibility and economic impact of new developments must be
decision making in terms of capital outlay strategy with some operators fully assessed especially as the market becomes more crowded and total
putting off large scale investments in existing properties. Given any IR potential GGR slows.
development in Japan will only likely evolve beyond 2023, with the
government, quite rightly, signaling a cautious approach in the likely number The recent announcement of the expansion of the IRs in Singapore, which
of licences (circa three is expected) to be granted in the first round, we could potentially coincide with Japan’s first openings, together with
believe Japan IR’s have the ability to be truly iconic and unique, largely NagaWord’s third complex in Phnom Penh, suggest the gaming market is set
tapping into the north Asia and domestic markets, with a potential market for challenging times ahead, especially given a potential slow down in the
share certainly larger than Singapore’s. growth of gaming revenue.
As such, we anticipate that the total potential GGR for Japan in 2023 to be
circa US$17 billion, taking into account an anticipated ‘novelty’ effect in the
first year of operation. This could fall to US$12 billion in year two, stabilising
around this figure. We note that this represents total potential GGR. Should
only say three licences be granted, depending on location, the fair share of
each metropolitan property could therefore be circa US$4.5 billion to US$6.0
billion per annum, stabilised. We would expect, operators in so called tier 2
locations to generate significantly less in GGR per annum.
12COLLIERS INSIGHTS HOTELS | ASIA | Q2 2019
ABOUT COLLIERS HOTELS
Colliers International launched its specialised hotels division in 1985.
Our dedicated hotel specialists are based in Australia, Hong Kong,
Singapore, Tokyo, London, Nairobi, Dubai, Boston and Los Angeles.
Whether you are a start‐up or well‐established We provide timely, relevant and forward‐looking NEXT QUARTER
owner, developer or investor, we will help you advice. This global division has exceptional
go through the business life cycle by providing relationships with investors worldwide, required
specialised, value‐added advices that are tailor‐ for the timely and effective sale of assets.
made to your specific needs:
Our specialised sector expertise includes:
OPINION
> Market and feasibility studies MICE in Asia
> Hotels and resorts
> Property and business valuation
> Theme parks
> Capital markets
> Travel trade
> Internal business reviews
> Golf DESTINATION OF THE QUARTER
> Operator search and selection
> Spas and wellness facilities > Phuket
> Due diligence
> Casinos > Okinawa
> Transaction advisory, IPO and REITs listing
> Conference and convention centers
> Management agreements and lease reviews (MICE venues)
> Extensions, refurbishments > Racecourses
> Benchmarking and forecasting > Sports stadiums GOLF UPDATE
> Tourism strategy and master planning > Integrated and mixed‐use
> Asset management > Destination consulting
> Needs analysis / economic impact studies
> Litigation support and dispute resolution
> Business restructuring – OpCo / PropCo
> Highest and best use / concept designs
> Project management and leasing
13Primary Authors: Govinda Singh Executive Director | Valuation & Advisory | Asia +65 6531 8566 Govinda.Singh@colliers.com Destination Consulting: Chris Wright Director | Valuation & Advisory | Asia +852 2822 0719 Chris.Wright@colliers.com Regional Contact: David Faulkner Managing Director | Valuation & Advisory | Asia +852 2822 0525 David.Faulkner@colliers.com About Colliers International Group Inc. Colliers International (NASDAQ, TSX: CIGI) is a leading global real estate services and investment management company. With operations in 68 countries, our 14,000 enterprising people work collaboratively to provide expert advice and services to maximize the value of property for real estate occupiers, owners and investors. For more than 20 years, our experienced leadership team, owning more than 40% of our equity, have delivered industry‐leading investment returns for shareholders. In 2018, corporate revenues were $2.8 billion ($3.3 billion including affiliates), with more than $26 billion of assets under management. For the latest news from Colliers, visit our website or follow us on Copyright © 2019 Colliers International The information contained herein has been obtained from sources deemed reliable. While every reasonable effort has been made to ensure its accuracy, we cannot guarantee it. No responsibility is assumed for any inaccuracies. Readers are encouraged to consult their professional advisors prior to acting on any of the material contained in this report.
You can also read