Hydrogeologic Framework, Geochemistry, Groundwater-Flow System, and Aquifer Hydraulic Properties Used in the Development of a Conceptual Model of ...
←
→
Page content transcription
If your browser does not render page correctly, please read the page content below
Prepared in cooperation with Llano Estacado Underground Water Conservation District,
Sandy Land Underground Water Conservation District, and South Plains Underground Water
Conservation District

Hydrogeologic Framework, Geochemistry,
Groundwater-Flow System, and Aquifer Hydraulic Properties
Used in the Development of a Conceptual Model of the
Ogallala, Edwards-Trinity (High Plains), and Dockum Aquifers
In and Near Gaines, Terry, and Yoakum Counties, Texas

Scientific Investigations Report 2021–5009

U.S. Department of the Interior
U.S. Geological Survey
Front cover:
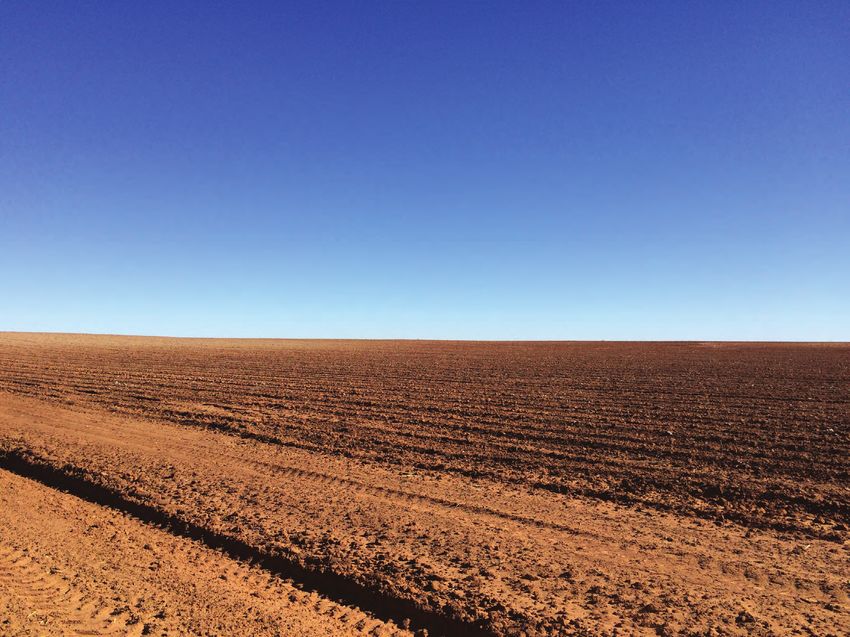
Background, Freshly plowed field in the study area in Gaines, Terry, and Yoakum Counties, Texas, March 2017. Photograph by Scott Ikard, U.S.
Geological Survey.
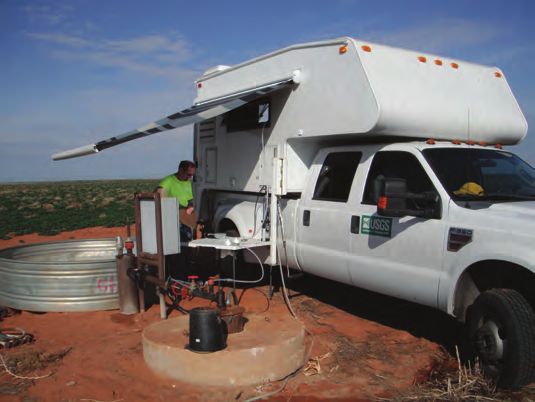
(A) U.S. Geological Survey scientist making a borehole nuclear magnetic resonance measurement in the study area in Gaines, Terry, and Yoakum
Counties, Texas, April 2018. Photograph by Kurt Kraske, U.S. Geological Survey.
(B) U.S. Geological Survey scientists preparing the borehole caliper tool for data collection in the study area in Gaines, Terry, and Yoakum Counties,
Texas, February 2014. Photograph by Andrew Teeple, U.S. Geological Survey.
(C) U.S. Geological Survey scientists preparing the borehole nuclear magnetic resonance tool for data collection in the study area in Gaines, Terry,
and Yoakum Counties, Texas, April 2018. Photograph by Kurt Kraske, U.S. Geological Survey.
(D) U.S. Geological Survey scientist assessing the physical properties of water before sample collection from a groundwater well in the study area
in Gaines, Terry, and Yoakum Counties, Texas, August 2014. Photograph by Scott Ikard, U.S. Geological Survey.
(E) U.S. Geological Survey scientists after collecting the last time-domain electromagnetic sounding for the trip in the study area in Gaines, Terry,
and Yoakum Counties, Texas, March 2017. Photograph by Andrew Teeple, U.S. Geological Survey.
(F) U.S. Geological Survey scientist setting up the receiver antenna for a time-domain electromagnetic sounding in the study area in Gaines, Terry,
and Yoakum Counties, Texas, March 2014. Photograph by Natalie Houston, U.S. Geological Survey.
(G) U.S. Geological Survey scientist assessing the physical properties of water before sample collection from a groundwater well in the study area
in Gaines, Terry, and Yoakum Counties, Texas, July 2016. Photograph by Chiquita Lopez, U.S. Geological Survey.
(H) U.S. Geological Survey scientist collecting water-quality samples in the study area in Gaines, Terry, and Yoakum Counties, Texas, July 2016.
Photograph by Chiquita Lopez, U.S. Geological Survey.
Back cover:
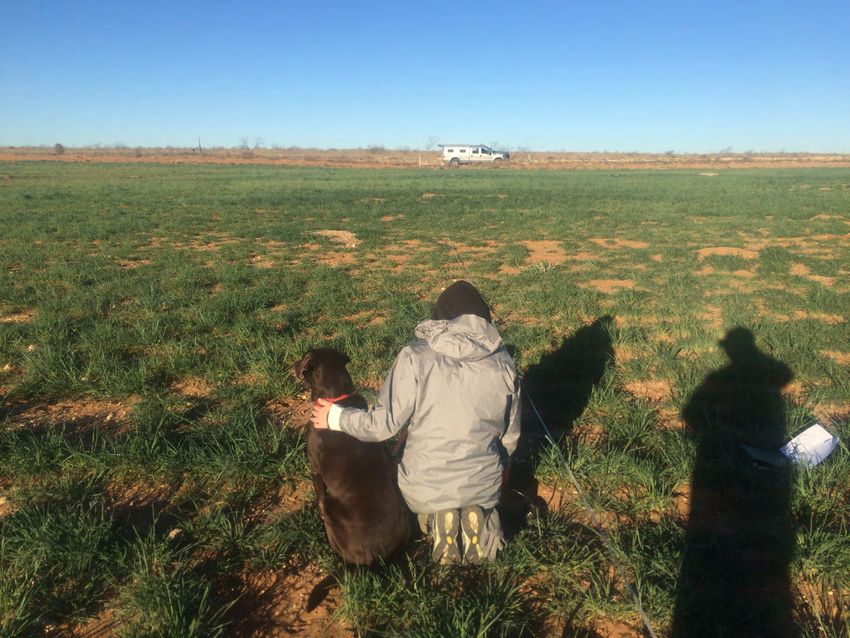
Background, U.S. Geological Survey scientist and field support dog collecting a time-domain electromagnetic sounding in the study area in
Gaines, Terry, and Yoakum Counties, Texas, February 2017. Photograph by Scott Ikard, U.S. Geological Survey.
(C) (D)
(A) (B)
(F)
(G)
(E)
(H)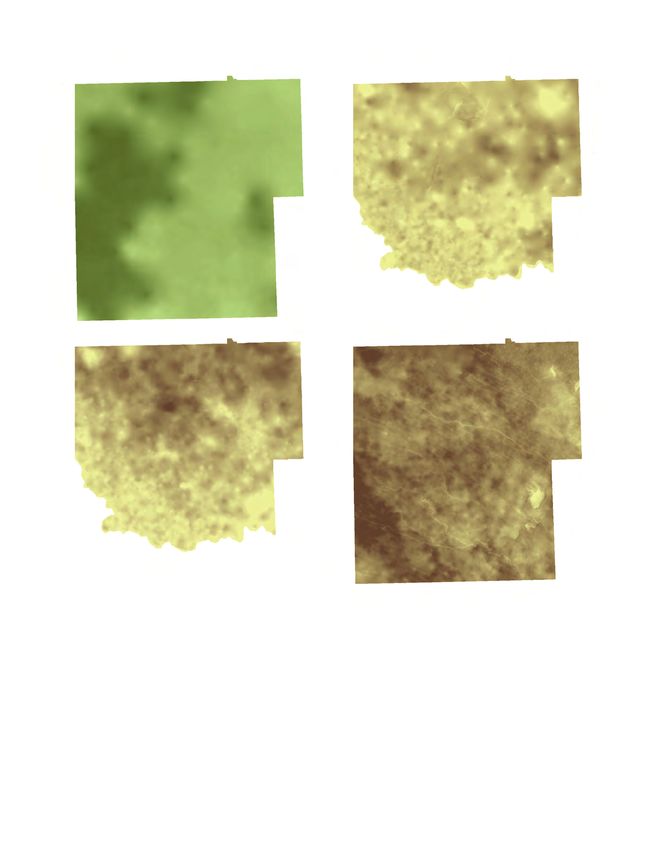
Hydrogeologic Framework, Geochemistry,
Groundwater-Flow System, and Aquifer
Hydraulic Properties Used in the
Development of a Conceptual Model of the
Ogallala, Edwards-Trinity (High Plains), and
Dockum Aquifers In and Near Gaines, Terry,
and Yoakum Counties, Texas

By Andrew P. Teeple, Patricia B. Ging, Jonathan V. Thomas, David S. Wallace,
and Jason D. Payne

Prepared in cooperation with Llano Estacado Underground Water Conservation
District, Sandy Land Underground Water Conservation District, and South Plains
Underground Water Conservation District

Scientific Investigations Report 2021–5009

U.S. Department of the Interior
U.S. Geological Survey

U.S. Geological Survey, Reston, Virginia: 2021 For more information on the USGS—the Federal source for science about the Earth, its natural and living resources, natural hazards, and the environment—visit https://www.usgs.gov or call 1–888–ASK–USGS. For an overview of USGS information products, including maps, imagery, and publications, visit https://store.usgs.gov/. Any use of trade, firm, or product names is for descriptive purposes only and does not imply endorsement by the U.S. Government. Although this information product, for the most part, is in the public domain, it also may contain copyrighted materials as noted in the text. Permission to reproduce copyrighted items must be secured from the copyright owner. Suggested citation: Teeple, A.P., Ging, P.B., Thomas, J.V., Wallace, D.S., and Payne, J.D., 2021, Hydrogeologic framework, geochemistry, groundwater-flow system, and aquifer hydraulic properties used in the development of a conceptual model of the Ogallala, Edwards-Trinity (High Plains), and Dockum aquifers in and near Gaines, Terry, and Yoakum Counties, Texas: U.S. Geological Survey Scientific Investigations Report 2021–5009, 68 p., https://doi.org/10.3133/sir20215009. Associated data for this publication: Payne, J.D., Teeple, A.P., and Thomas, J.V., 2020, Compilation of time-domain electromagnetic surface geophysical soundings, historical borehole characteristics, water level, water quality and hydraulic properties data throughout Gaines, Yoakum, and Terry Counties in Texas, 1929–2019: U.S. Geological Survey data release, https://doi.org/ 10.5066/P9N3WKQ5. ISSN 2328-031X (print) ISSN 2328-0328 (online)
iii

Acknowledgments
The authors thank the district managers, Lori Barnes of Llano Estacado Underground Water
Conservation District, Amber Blount of Sandy Land Underground Water Conservation District,
and Lindy Harris of South Plains Underground Water Conservation District. The district manag-
ers provided support in early project data compilation, orchestrated land-owner permissions and
property access for data collection efforts, and helped with other aspects of the project. Thanks
go to Layne Marlow of South Plains Underground Water Conservation District for logistical and
field assistance and to Don Harridge of Llano Estacado Underground Water Conservation District
for expediting the field collection efforts. Technical assistance from Ray Brady and Amy Bush of
RMBJ Geo, Inc., who shared their knowledge of the geology and hydrology of the study area, is
appreciated.

The authors also thank Natalie Houston, Scott Ikard, Kurt Kraske, Jeremy McDowell, Kelvey
Merrill, and George Umphres of the U.S. Geological Survey for assisting in collection of the
geophysical data. Assistance with groundwater geochemical data collection was provided by
Cassi Crow, Becky Lambert, Chiquita Lopez, Keith Mecum, Mike Nyman, and Aaron Pugh of the
U.S. Geological Survey.

v

Contents
Acknowledgments����������������������������������������������������������������������������������������������������������������������������������������iii
Abstract�����������������������������������������������������������������������������������������������������������������������������������������������������������1
Introduction����������������������������������������������������������������������������������������������������������������������������������������������������2
     Purpose and Scope������������������������������������������������������������������������������������������������������������������������������5
     Description of Study Area�������������������������������������������������������������������������������������������������������������������5
     Geologic Setting������������������������������������������������������������������������������������������������������������������������������������6
     Hydrogeologic Setting�������������������������������������������������������������������������������������������������������������������������6
     Synopsis of Previous Studies for This Multiphase Project������������������������������������������������������������8
Development of a Refined Hydrogeologic Framework����������������������������������������������������������������������������9
     Data Compilation and Collection��������������������������������������������������������������������������������������������������������9
     Methods of Interpretation�����������������������������������������������������������������������������������������������������������������10
     Hydrogeologic Framework Refinements����������������������������������������������������������������������������������������10
           Dockum Group����������������������������������������������������������������������������������������������������������������������������10
           Trinity Group��������������������������������������������������������������������������������������������������������������������������������17
           Fredericksburg Group���������������������������������������������������������������������������������������������������������������17
           Ogallala Formation���������������������������������������������������������������������������������������������������������������������20
Geochemistry�����������������������������������������������������������������������������������������������������������������������������������������������21
     Sample Collection and Analysis�������������������������������������������������������������������������������������������������������21
           Field Procedures������������������������������������������������������������������������������������������������������������������������21
           Analytical Methods�������������������������������������������������������������������������������������������������������������������21
           Environmental Tracers��������������������������������������������������������������������������������������������������������������21
                    Strontium Isotopic Ratios������������������������������������������������������������������������������������������������23
                    Hydrogen and Oxygen Isotopic Ratios��������������������������������������������������������������������������23
                    Tritium���������������������������������������������������������������������������������������������������������������������������������24
                    Carbon-14���������������������������������������������������������������������������������������������������������������������������24
     Quality-Assurance and Quality-Control Procedures��������������������������������������������������������������������25
           Field-Blank Analyses�����������������������������������������������������������������������������������������������������������������25
           Sequential-Replicate Analyses�����������������������������������������������������������������������������������������������25
           Matrix Spikes Analyses������������������������������������������������������������������������������������������������������������25
     Geochemical Characteristics�����������������������������������������������������������������������������������������������������������26
           Hydrochemical Facies��������������������������������������������������������������������������������������������������������������27
           Dissolved Solids�������������������������������������������������������������������������������������������������������������������������28
           Nutrients��������������������������������������������������������������������������������������������������������������������������������������28
           Organic Compounds������������������������������������������������������������������������������������������������������������������28
           Environmental Tracers��������������������������������������������������������������������������������������������������������������31
Groundwater-Flow System�������������������������������������������������������������������������������������������������������������������������35
     Water-Level Measurements�������������������������������������������������������������������������������������������������������������35
     Data Processing and Interpretation������������������������������������������������������������������������������������������������35
     Regional Groundwater Flow�������������������������������������������������������������������������������������������������������������36
           Ogallala Aquifer�������������������������������������������������������������������������������������������������������������������������36
           Edwards-Trinity (High Plains) Aquifer������������������������������������������������������������������������������������36
           Dockum Aquifer�������������������������������������������������������������������������������������������������������������������������39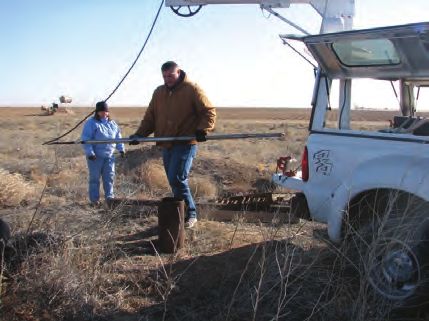
vi
Aquifer Hydraulic Properties���������������������������������������������������������������������������������������������������������������������39
Data Compilation���������������������������������������������������������������������������������������������������������������������������������39
Data Collection������������������������������������������������������������������������������������������������������������������������������������39
Borehole Electromagnetic Flowmeter�����������������������������������������������������������������������������������41
Borehole Nuclear Magnetic Resonance Sounding�������������������������������������������������������������42
Borehole Electromagnetic Induction�������������������������������������������������������������������������������������42
Methods�����������������������������������������������������������������������������������������������������������������������������������������������42
Compiled Data����������������������������������������������������������������������������������������������������������������������������42
Borehole Flowmeter������������������������������������������������������������������������������������������������������������������43
Borehole Nuclear Magnetic Resonance�������������������������������������������������������������������������������43
Time-Domain Electromagnetic Soundings����������������������������������������������������������������������������44
Resistivity and Total Porosity Regression Equation����������������������������������������������������44
Effective Porosity and Total Porosity Regression��������������������������������������������������������44
Application of Regression Equations to the Time-Domain Electromagnetic
Sounding Data�����������������������������������������������������������������������������������������������������45
Hydraulic Conductivity, Specific Yield, and Specific Yield Variability����������������������������������������47
Ogallala Aquifer�������������������������������������������������������������������������������������������������������������������������47
Edwards-Trinity (High Plains) Aquifer������������������������������������������������������������������������������������47
Dockum Aquifer�������������������������������������������������������������������������������������������������������������������������47
Conceptual Model���������������������������������������������������������������������������������������������������������������������������������������50
Summary�������������������������������������������������������������������������������������������������������������������������������������������������������57
References Cited�����������������������������������������������������������������������������������������������������������������������������������������59
Figures
1. Map of study area location in Gaines, Terry, and Yoakum Counties, Texas,
within the regional extent of the major aquifers and physiographic provinces
pertaining to this assessment ����������������������������������������������������������������������������������������������������3
2. Map of hydrogeologic data sites, land-surface altitude, downdip extent of the
Edwards-Trinity (High Plains) aquifer system, and study area extent ��������������������������������4
3. Map of National Land Cover Database 2011 land-cover categories and
locations of wells from which samples for water-quality data were collected in
Gaines, Terry, and Yoakum Counties, Texas, 2014 and 2016 �������������������������������������������������7
4. Chart of geologic and hydrogeologic units and lithologic descriptions in and
near Gaines, Terry, and Yoakum Counties, Texas �������������������������������������������������������������������8
5. Maps of revised (2020) hydrogeologic unit surfaces for the base (bottom) of the
Dockum Group, the base of the Trinity Group, the base of the Fredericksburg
Group, and the base of the Ogallala Formation in and near Gaines, Terry, and
Yoakum Counties, Texas �����������������������������������������������������������������������������������������������������������12
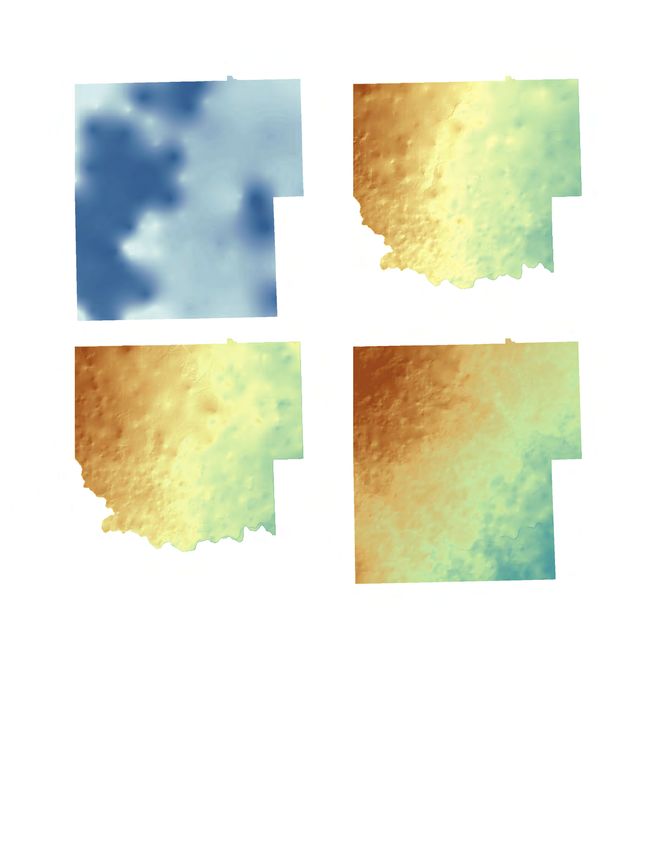
6. Maps of differences in mapped altitudes between the hydrogeologic unit
surfaces and the newly (2020) developed hydrogeologic unit surfaces for the
base (bottom) of the Dockum Group, the base of the Trinity Group, the base of
the Fredericksburg Group, and the base of the Ogallala Formation in and near
Gaines, Terry, and Yoakum Counties, Texas ��������������������������������������������������������������������������14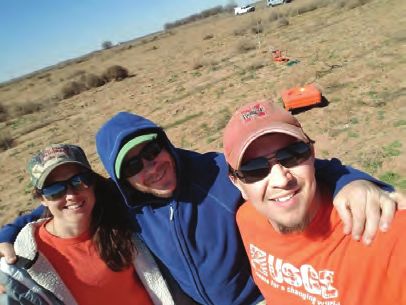
vii

 7.   Maps of results of trend-removal grids and hydrology toolset analysis used
      to identify paleochannel locations in the hydrogeologic unit surfaces for the
      base (bottom) of the Trinity Group, the base of the Fredericksburg Group, and
      the base of the Ogallala Formation in and near Gaines, Terry, and Yoakum
      Counties, Texas ��������������������������������������������������������������������������������������������������������������������������16
 8.   Maps of hydrogeologic unit thickness of the Dockum Group, the Trinity Group,
      the Fredericksburg Group, and the Ogallala Formation in and near Gaines,
      Terry, and Yoakum Counties, Texas �����������������������������������������������������������������������������������������18
 9.   Diagram of relations between major cations and anions measured in
      water-quality samples from groundwater wells in Gaines, Terry, and Yoakum
      Counties, Texas, 2014 and 2016 �����������������������������������������������������������������������������������������������27
10.   Map of dissolved-solids concentrations in groundwater wells sampled in
      Gaines, Terry, and Yoakum Counties, Texas, 2014 and 2016������������������������������������������������29
11.   Map of nitrate plus nitrite concentrations in water-quality samples from
      groundwater wells in Gaines, Terry, and Yoakum Counties, Texas, 2014 and 2016���������30
12.   Graph of relation between dissolved-solids and nitrate plus nitrite
      concentrations in water-quality samples from groundwater wells in Gaines,
      Terry, and Yoakum Counties, Texas, 2014 and 2016 ��������������������������������������������������������������31
13.   Maps of metolachlor concentrations detected in water-quality samples from
      groundwater wells in Gaines, Terry, and Yoakum Counties, Texas, for 2014 and
      2016 and for 2000–03������������������������������������������������������������������������������������������������������������������32
14.   Maps of deethylatrazine concentrations detected in water-quality samples from
      groundwater wells in Gaines, Terry, and Yoakum Counties, Texas, for 2014 and
      2016 and for 2000–03������������������������������������������������������������������������������������������������������������������33
15.   Boxplot of strontium isotopic values in water-quality samples from
      groundwater wells in Gaines, Terry, and Yoakum Counties, Texas, 2014 and 2016���������34
16.   Graph of relation between stable isotopes of hydrogen and oxygen in
      water-quality samples from groundwater wells in Gaines, Terry, and Yoakum
      Counties, Texas, 2014 and 2016 �����������������������������������������������������������������������������������������������35
17.   Graph of tritium and carbon-14 concentrations in water-quality samples from
      groundwater wells in Gaines, Terry, and Yoakum Counties, Texas, 2014 and 2016���������36
18.   Map of relative ages of groundwater in Gaines, Terry, and Yoakum Counties,
      Texas, 2014 and 2016 �����������������������������������������������������������������������������������������������������������������37
19.   Maps of potentiometric surfaces developed from groundwater-level
      altitudes measured during the dormant season in wells completed in the
      Ogallala aquifer, the Edwards-Trinity (High Plains) aquifer system, and the
      Dockum aquifer in and near Gaines, Terry, and Yoakum Counties, Texas �����������������������38
20.   Graph of relation between the borehole nuclear magnetic resonance total
      porosity and the formation factor computed from the borehole electromagnetic
      induction and fluid conductivity logs for wells in Gaines, Terry, and Yoakum
      Counties, Texas, 2012–18 ����������������������������������������������������������������������������������������������������������45
21.   Graph of relation between the borehole nuclear magnetic resonance total
      porosity and the estimated total porosity from the formation factor computed
      from the borehole electromagnetic induction and fluid conductivity logs for
      wells in Gaines, Terry, and Yoakum Counties, Texas, 2012–18 �������������������������������������������45
22.   Graph of relation between the borehole nuclear magnetic resonance total
      porosity and fluid fraction of the total porosity for wells in Gaines, Terry, and
      Yoakum Counties, Texas, 2012–18 �������������������������������������������������������������������������������������������46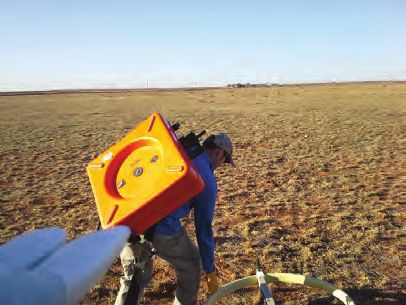
viii

          23. Graph of relation between the absolute difference of the mobile-water fraction
              of the borehole nuclear magnetic resonance total porosity with the estimated
              effective porosity and the formation factor for wells in Gaines, Terry, and
              Yoakum Counties, Texas, 2012–18 �������������������������������������������������������������������������������������������46
          24. Maps of hydraulic-conductivity values computed from historical aquifer
              test, borehole electromagnetic flowmeter, and borehole nuclear magnetic
              resonance data for the Ogallala aquifer, the Edwards-Trinity (High Plains)
              aquifer system, and the Dockum aquifer �������������������������������������������������������������������������������48
          25. Maps of estimated specific yield and specific yield variability values computed
              from borehole nuclear magnetic resonance and inverse modeling results of the
              time-domain electromagnetic data for the Ogallala aquifer, the Edwards-Trinity
              (High Plains) aquifer system, and the Dockum aquifer��������������������������������������������������������49
          26. Map of combined hydrogeologic unit thickness of the Trinity and
              Fredericksburg Groups and Ogallala Formation in and near Gaines, Terry, and
              Yoakum Counties, Texas������������������������������������������������������������������������������������������������������������51
          27. Map of groundwater groups for the water-quality samples collected in Gaines,
              Terry, and Yoakum Counties, Texas, 2014 and 2016 ��������������������������������������������������������������52
          28. Maps of saturated thickness of the Ogallala aquifer and the combined Ogallala
              aquifer and the Edwards-Trinity (High Plains) aquifer system in and near
              Gaines, Terry, and Yoakum Counties, Texas ��������������������������������������������������������������������������55

       Tables
           1.    Descriptive statistics for the primary geologic units for each conservation
                 district in the study area in and near Gaines, Terry, and Yoakum Counties, Texas���������11
           2.    Selected well completion information, aquifer designation, and sampling date
                 for groundwater-quality samples collected from wells in and near Gaines,
                 Terry, and Yoakum Counties, Texas �����������������������������������������������������������������������������������������22
           3.    U.S. Environmental Protection Agency primary and secondary drinking
                 water standards, U.S. Geological Survey health-based screening levels, and
                 the percent of samples that exceeded the designated standard or level for
                 selected constituents analyzed in groundwater samples in Gaines, Terry, and
                 Yoakum Counties, Texas, 2014 and 2016 ���������������������������������������������������������������������������������27
           4.    Selected well completion information, aquifer designation, borehole
                 geophysical method, and measurement date for borehole geophysical data
                 collected from wells in and near Gaines, Terry, and Yoakum Counties, Texas����������������40
           5.    Description of groundwater groups and median water-quality results for
                 groundwater groups from water-quality samples collected in Gaines, Terry, and
                 Yoakum Counties, 2014 and 2016 ���������������������������������������������������������������������������������������������53
           6.    Estimated groundwater storage volumes computed from the estimated
                 saturated thickness and estimated specific yield and specific yield variability
                 values computed from borehole nuclear magnetic resonance and inverse
                 modeling results of the time-domain electromagnetic data for the High Plains
                 aquifer system (Ogallala aquifer), Edwards-Trinity (High Plains) aquifer system,
                 and the combined Ogallala aquifer and Edwards-Trinity (High Plains) aquifer
                 systems in and near Gaines, Terry, and Yoakum Counties, Texas��������������������������������������56
ix
Conversion Factors
U.S. customary units to International System of Units
Multiply By To obtain
Length
inch (in.) 2.54 centimeter (cm)
inch (in.) 25.4 millimeter (mm)
foot (ft) 0.3048 meter (m)
mile (mi) 1.609 kilometer (km)
Area
square mile (mi2) 259.0 hectare (ha)
square mile (mi2) 2.590 square kilometer (km2)
Volume
ounce, fluid (fl. oz) 0.02957 liter (L)
pint (pt) 0.4732 liter (L)
quart (qt) 0.9464 liter (L)
gallon (gal) 3.785 liter (L)
gallon (gal) 0.003785 cubic meter (m3)
gallon (gal) 3.785 cubic decimeter (dm3)
cubic inch (in3) 0.01639 liter (L)
acre-foot (acre-ft) 1,233 cubic meter (m3)
acre-foot (acre-ft) 0.001233 cubic hectometer (hm3)
Flow rate
gallon per minute (gal/min) 0.06309 liter per second (L/s)
Radioactivity
picocurie per liter (pCi/L) 0.037 becquerel per liter (Bq/L)
Hydraulic conductivity
foot per day (ft/d) 0.3048 meter per day (m/d)
Temperature in degrees Fahrenheit (°F) may be converted to degrees Celsius (°C) as follows:
°C = (°F – 32) / 1.8.
Datum
Vertical coordinate information is referenced to the North American Vertical Datum of 1988
(NAVD 88).
Horizontal coordinate information is referenced to the North American Datum of 1983 (NAD 83).
Altitude, as used in this report, refers to distance above the vertical datum.x
Supplemental Information
Specific conductance is given in microsiemens per centimeter at 25 degrees Celsius (µS/cm).
Concentrations of chemical constituents in water are given in milligrams per liter (mg/L),
micrograms per liter (µg/L), or milliequivalents per liter.
Milligrams per liter are units expressing the mass of the solute per unit volume (liter) of water;
milligrams per liter is equivalent to parts per million. Micrograms per liter are units expressing
the mass of the solute per unit volume (liter) of water; micrograms per liter is equivalent to
parts per billion. Milliequivalents are units expressing the number of electron-millimoles of a
solute per unit volume (liter). Milliequivalents per liter is a unit expressing the concentration of
chemical constituents in solution as 1/1000 the molecular weight, in milligrams, divided by the
valence of one molecule of the constituent per unit volume (liter) of water.
Activities for radioactive constituents in water are given in picocuries per liter (pCi/L).
Tritium concentrations are discussed in tritium units (TU). Based upon a tritium half-life of
12.32 years (Lucas and Unterweger, 2000), 1 TU is equal to 3.22 picocuries per liter (pCi/L).
Resistivity is given in ohm-meters (ohm-m).
Isotope Unit Explanation
Per mil: A unit commonly used to express the ratio of stable isotope abundance of an element
in a sample to the abundance of the same element in a standard material. Per mil units are
equivalent to parts per thousand. Stable isotope ratios are computed as follows (Kendall and
McDonnell, 1998):
δX = {(Rsample - Rstandard)/ Rstandard} x 1,000
where
δ is the “delta” notation,
X is the heavier stable isotope, and
R is the ratio of the heavier, less abundant isotope to the lighter, stable isotope in
a sample or standard.
The δ values for stable isotope ratios discussed in this report are referenced to the following
standard materials:
Element R Standard identity and reference
Hydrogen Hydrogen-2/hydrogen-1 (δD) Vienna Standard Mean Ocean Water (Fritz and Fontes,
1980)
Oxygen Oxygen-18/oxygen-16 (δ18O) Vienna Standard Mean Ocean Water (Fritz and Fontes,
1980)xi Abbreviations 3DEP Three-Dimensional Elevation Program 3H tritium 12C carbon-12 14C carbon-14 14N nitrogen-14 87Sr/86Sr strontium isotopic ratio (strontium-87/strontium-86) AMS accelerator mass spectrometry ASTM American Society of Testing and Materials CO2 carbon dioxide DEM digital elevation model DS dissolved solids EM electromagnetic EPA U.S. Environmental Protection Agency FLASH Flow-Log Analysis of Single Holes GMWL Global Meteoric Water Line Hz hertz LAS Log American Standard Code for Information Interchange (ASCII) Standard LEUWCD Llano Estacado Underground Water Conservation District LRL laboratory reporting level NAD 83 North American Datum of 1983 NAVD 88 North American Vertical Datum of 1988 NLCD National Land Cover Database NMR nuclear magnetic resonance NWIS National Water Information System NWQL National Water Quality Laboratory PDF Portable Document Format pmc percent modern carbon PVC polyvinyl chloride R2 R-squared (coefficient of determination) RPD relative percent difference SLUWCD Sandy Land Underground Water Conservation District SPUWCD South Plains Underground Water Conservation District TDEM time-domain electromagnetic USGS U.S. Geological Survey UWCD Underground Water Conservation District
Hydrogeologic Framework, Geochemistry,
Groundwater-Flow System, and Aquifer Hydraulic
Properties Used in the Development of a Conceptual
Model of the Ogallala, Edwards-Trinity (High Plains), and
Dockum Aquifers In and Near Gaines, Terry, and Yoakum
Counties, Texas

By Andrew P. Teeple, Patricia B. Ging, Jonathan V. Thomas, David S. Wallace, and Jason D. Payne

                                                                    hydrogeologic framework was used to assess the vertical and
Abstract                                                            lateral extents of hydrogeologic units, bed orientations, unit
                                                                    thicknesses, and location and orientation of paleochannels. In
      In 2014, the U.S. Geological Survey, in cooperation with      general, the Trinity and Fredericksburg Groups and Ogallala
Llano Estacado Underground Water Conservation District,             Formation exhibit a slight regional dip (dip angle of about
Sandy Land Underground Water Conservation District, and             0.14 degrees) to the southeast with dip directions becom-
South Plains Underground Water Conservation District (here-         ing more to the south with each successively overlying unit
inafter referred to collectively as the “UWCDs”), began a           (105, 110, and 125 degrees for the bases of the Trinity and
multiphase study in and near Gaines, Terry, and Yoakum              Fredericksburg Groups and Ogallala Formation, respectively).
Counties, Texas, to develop a regional conceptual model of the      In general, the Trinity and Fredericksburg Groups thin to the
hydrogeologic framework, geochemistry, groundwater-flow             south and are not present in the southern part of Gaines County,
system, and hydraulic properties, primarily for the High Plains     whereas the Ogallala Formation becomes thinner from west to
and Edwards-Trinity aquifer system and to a lesser degree for       east. The combined thickness of the Trinity and Fredericksburg
the Dockum aquifer. The High Plains aquifer system (hereinaf-       Groups and Ogallala Formation is generally greatest in the
ter referred to as the “Ogallala aquifer”), contained within the    north-central part of the study area and thinnest in the south-
Ogallala Formation in Texas, is the shallowest aquifer in the       eastern part of the study area. Paleochannel orientation varied
study area and is the primary source of water for agriculture
                                                                    over geologic time as formations were deposited and eroded.
and municipal supply in the areas managed by the UWCDs.                   Water-quality samples were collected from 51 wells
Groundwater withdrawals from deeper aquifers (primarily the         throughout the study area to better understand general water
Edwards-Trinity [High Plains] aquifer system that is hereinaf-      quality and to provide insight into groundwater-flow paths and
ter referred to as the “Edwards-Trinity [High Plains] aquifer”)     recharge areas. Groundwater samples were spatially grouped on
augmented by lesser amounts from the Dockum aquifer provide         the basis of similarities found in the physicochemical proper-
additional water sources in the study area. The Edwards-            ties, major ions, trace elements, nutrients, organic compounds,
Trinity (High Plains) aquifer is contained within the Trinity and   and selected stable isotopes and age tracers. Three groundwater
Fredericksburg Groups. The Dockum aquifer, a relatively minor       groups were identified in the study area. The first groundwater
source of water in the study area, is contained in the Dockum       group (Group 1), represented mostly by groundwater from
Group, which was evaluated as a single unit. The potential for      the Ogallala and Edwards-Trinity (High Plains) aquifers in
continual declines of the groundwater in the Ogallala aquifer in    the northern half of the study area, is considered to be recent
the study area and the potential changes in water quality result-   recharge, affected by land-use activities, as explained by the
ing from dewatering and increased vertical groundwater move-        younger age, higher concentrations of nitrate plus nitrite, and
ment between adjacent water-bearing units have raised con-          more frequent detections of organic compounds. Groundwater
cerns about the amount and quality of available groundwater.        wells in the second groundwater group (Group 2) are typically
      The developed conceptual model helped in the under-           in the southwestern and northwestern parts of the study area,
standing of the quantity and quality of the groundwater within      and the groundwater in this group is considered to be ground-
the Ogallala, the Edwards-Trinity (High Plains), and to a           water recharged during the Pleistocene period, as explained by
lesser extent, the Dockum aquifers within the study area. The       the relatively old age of the groundwater, high strontium stable
2 Development of Conceptual Model of Ogallala, Edwards-Trinity (High Plains), and Dockum Aquifers, Texas
isotope ratios, and hydrogen and oxygen stable isotope ratios. Using the estimated saturated thickness and estimated
The last groundwater group (Group 3) is likely a mixture of specific yield grids, the water volumes of the Ogallala and
groundwater from the first or second groups (or both) with a Edwards-Trinity (High Plains) aquifers and the combined
third, highly mineralized groundwater as explained by having Ogallala and Edwards-Trinity (High Plains) aquifers were
the highest dissolved-solids concentrations in the study area estimated. The available water in the Edwards-Trinity (High
and having some similarities to geochemical characteristics of Plains) aquifer (16.6 million acre-feet) is almost double the
samples from the first and second groups. available water in the Ogallala aquifer (8.8 million acre-
A groundwater-flow system analysis was done to under- feet). Although the Edwards-Trinity (High Plains) aquifer
stand the flow of groundwater throughout the aquifer system. contains more available groundwater, pumping is more
Groundwater-level altitudes for the Ogallala, Edwards-Trinity difficult because of the relatively low hydraulic conductivity
(High Plains), and Dockum aquifers are generally higher in and specific yield values compared to the Ogallala aquifer.
the northwestern part of the study area and lower in the south- Overall, the available water within the combined Ogallala and
eastern part of the study area. Groundwater generally flows Edwards-Trinity (High Plains) aquifers is about 6.6, 10.2, and
in a northwest to southeast direction across the study area 8.6 million acre-feet for Gaines, Terry, and Yoakum Counties,
in each of the aquifers. The groundwater-flow paths closely respectively.
resemble the mapped paleochannels, indicating that within
the study area, the groundwater flows preferentially along the
paleochannels, especially within the Ogallala aquifer where
dewatering of the aquifer results in a greater effect of the base Introduction
structure on the flow of groundwater.
Llano Estacado Underground Water Conservation District
The Ogallala aquifer is unsaturated in localized areas in
(LEUWCD), Sandy Land Underground Water Conservation
the study area; unsaturated areas are generally near the south-
District (SLUWCD), and South Plains Underground Water
ern extent of the Edwards-Trinity (High Plains) aquifer, with
Conservation District (SPUWCD) (hereinafter referred to
the largest unsaturated area west of Seminole, Tex. The satu-
collectively as the “UWCDs”) manage groundwater resources
rated thickness of the Ogallala aquifer is thickest (more than
in a part of west Texas near the Texas-New Mexico State line
125 feet) southeast of Seminole and west of Brownfield, Tex.,
(figs. 1 and 2). As described in Thomas and others (2016) and
near the border between Terry and Yoakum Counties. The
Thomas and others (2019), the UWCDs are responsible for
saturated thickness of the combined Ogallala and Edwards-
managing the groundwater resources in their respective juris-
Trinity (High Plains) aquifers ranges from less than 10 feet
dictions, which are Gaines County for the LEUWCD, Terry
along the far southern edge of the study area to more than 350
County and a small part of Hockley County for the SPUWCD,
feet north and east of Brownfield, Tex., and along the border
and Yoakum County for the SLUWCD; the study area for this
between Terry and Yoakum Counties.
report consists of the areas managed by the three UWCDs
The aquifer hydraulic properties, including hydraulic
(fig. 2). Hockley County is a small part of the overall study
conductivity and specific yield, were estimated to better under-
area and will not be explicitly mentioned within the report. If
stand the ability of groundwater to move through the aquifer
data pertain to Hockley County, they will be referred to as “in
system and quantify the volume of available water in storage.
and near Gaines, Terry, and Yoakum Counties” as opposed to
The hydraulic-conductivity values varied greatly within the
“in Gaines, Terry, and Yoakum Counties.”
study area (ranging from about 0.03 to about 350 feet per day),
An important source of water in the study area is the
and often large variations were found in the same area. Terry
High Plains aquifer system, a vast regional aquifer system that
County contained the highest and lowest hydraulic conductiv-
underlies about 174,000 square miles (mi2) from South Dakota
ity values for the Ogallala aquifer, whereas Yoakum County
to Texas (fig. 1) (Gutentag and others, 1984). Historically,
contained the highest and lowest hydraulic conductivity values
the High Plains aquifer system was often referred to as the
for the Edwards-Trinity (High Plains) aquifer. The highest
“Ogallala aquifer” throughout its extent in reference to the
hydraulic-conductivity values for the Dockum aquifer were
predominant water-bearing unit of the aquifer system, the
in Gaines County, whereas the lowest hydraulic-conductivity
Ogallala Formation (Dugan and others, 1994). The High
values were in Terry County. The estimated specific yield
Plains aquifer system is hereinafter referred to as “Ogallala
values within the study area range from 0.01 to 0.36. Higher
aquifer” in this report because the Ogallala Formation is the
specific yield values generally occurred in the western part
only geologic unit of the High Plains aquifer system in Texas
of the study area except in the Ogallala aquifer where higher
and because of the historical use of the term in the region. The
specific yield values were in the east. The Ogallala aquifer had
Ogallala aquifer is the shallowest aquifer in the study area and
the lowest specific yield range and the least specific yield vari-
is the primary source of water for agriculture and municipal
ability among the three aquifers, whereas the Dockum aquifer
supply in the areas managed by the UWCDs (Rettman and
had the highest specific yield range and the greatest specific
Leggat, 1966). Groundwater withdrawals from deeper aquifers
yield variability.
(primarily from the Edwards-Trinity [High Plains] aquifer
system, hereinafter referred to as the “Edwards-Trinity [High
Plains] aquifer,” as identified by the Texas Water DevelopmentIntroduction 3
110°0'
100°0'
90°0'
MONTANA
NORTH DAKOTA
MINNESOTA
WISCONSIN
SOUTH DAKOTA
WYOMING
IOWA
NEBRASKA
40°0'
COLORADO
KANSAS
MISSOURI
OKLAHOMA
NEW MEXICO
TEXAS
LOUISIANA
30°0'
Base modified from U.S. Geological Survey 1:250,000-scale to 1:2,000,000-scale digital data, 0 100 200 300 400 MILES
Texas Water Development Board digital data, Commission for Environmental Cooperation
1:10,000,000-scale digital data. 0 100 200 300 400 KILOMETERS
Albers Equal-Area Conic Projection, Texas State Mapping System
North American Datum of 1983
EXPLANATION
Great Plains physiographic province (Fenneman, High Plains aquifer system extent (Ogallala aquifer
1931; Wermund, 1996) extent in Texas) (George and others, 2011)
High Plains physiographic province Edwards-Trinity (High Plains) aquifer system extent
(Fenneman, 1931; Wermund, 1996) (George and others, 2011)
Study area boundary Dockum aquifer extent (George and others, 2011)
Figure 1. Location of the study area in Gaines, Terry, and Yoakum Counties, Texas, within the regional extent of the
major aquifers and physiographic provinces pertaining to this assessment. Reprinted from Thomas and others (2016,
fig. 2).4 Development of Conceptual Model of Ogallala, Edwards-Trinity (High Plains), and Dockum Aquifers, Texas
HOCKLEY
102°20'
103°0' 102°40' COUNTY
YOAKUM TERRY
COUNTY COUNTY
33°20'
385 62 Rich Lake
214
Mound Lake
380
Plains 380
82
Brownfield
82
62
137
33°0'
Denver City
83
Seagraves
83
Cedar Lake
214
McKenzie Lake
62
Seminole 180
32°40'
385
GAINES
COUNTY
Base modified from U.S. Geological Survey 1:250,000-scale to 1:2,000,000-scale digital data; 0 5 10 15 MILES
U.S. Geological Survey 3D Elevation Program, 1/3 arc-second
Universal Transverse Mercator projection, zone 13 0 5 10 15 KILOMETERS
North American Datum of 1983 EXPLANATION
Land-surface altitude, in feet Edwards-Trinity (High Plains) aquifer Hydrogeologic data site (Payne and others, 2020)
above North American system downdip extent
Site where time-domain electromagnetic soundings were collected or
Vertical Datum of 1988 Underground water conservation compiled for this study (Payne and others, 2020)
> 4,000 district boundary
Site where other types of previously collected hydrogeologic
3,650 Llano Estacado Underground data were compiled for this study, by source (Payne and others, 2020)
3,300 Water Conservation District
U.S. Geological Survey Texas Water Development Board
2,950 Sandy Land Underground
Brackish Resources Aquifer
Water Conservation District Underground Water
< 2,600 Characterization System
South Plains Underground Conservation District
Water Conservation District Texas Water Development Board
INTERA (consulting firm)
Study area boundary Submitted Driller's Logs Database
Texas Water Development
Board Groundwater Database Railroad Commission of Texas
Figure 2. Hydrogeologic data sites, land-surface altitude, downdip extent of the Edwards-Trinity (High Plains) aquifer system, and
study area extent, composed of the areas of jurisdiction of the Llano Estacado Underground Water Conservation District, Sandy Land
Underground Water Conservation District, and South Plains Underground Water Conservation District, in and near Gaines, Terry, and
Yoakum Counties, Texas.Introduction 5
Board1 [Texas Water Development Board, 2020a], augmented regarding hydrogeologic unit extents. Water-quality samples
by lesser amounts from the Dockum aquifer) provide addi- were collected to characterize water quality and to provide
tional water sources in the study area (fig. 1). The Edwards- insights into groundwater-flow paths and recharge areas.
Trinity (High Plains) aquifer is contained within the Trinity The results of the first phase of the study are documented in
and Fredericksburg Groups, whereas the Dockum aquifer, a Thomas and others (2016) and included an assessment of the
relatively minor source of water in the study area, is contained differences between early development (1930–60) and recent
in the Dockum Group. (2005–15) groundwater-level altitudes and selected water-
Groundwater levels have declined (decreased more than quality constituents (dissolved-solids [DS] and nitrate concen-
50 feet [ft] compared to historical groundwater levels) in parts trations) for the Ogallala, Edwards-Trinity (High Plains), and
of west Texas including Gaines, Terry, and Yoakum Counties Dockum aquifers. The results of the second phase of the study
since 1938 with overall patterns of declines in the Ogallala are documented in Thomas and others (2019) and include a
aquifer beginning soon after the start of widespread irriga- refined understanding of the hydrogeologic framework in the
tion practices relying on groundwater withdrawals from the study area.
aquifer (about 1950) (Gaum, 1953; Gutentag and others,
1984). In their report on the history of groundwater-level
changes in the Ogallala aquifer from predevelopment to 1980, Purpose and Scope
Dugan and others (1994) report groundwater-level declines
This report synthesizes previously collected data from
in the Ogallala aquifer of as much as 150 ft. During the past
Thomas and others (2016) and Thomas and others (2019)
50–60 years (1960–70), the rate of decline has slowed, and
concerning the hydrogeologic framework, geochemistry,
groundwater levels in the Ogallala aquifer have risen in a few
groundwater-flow system, and hydraulic properties of the
areas (McGuire, 2017). The potential for continual declines of
groundwater system from the Ogallala, Edwards-Trinity (High
the groundwater in the Ogallala aquifer in the study area has
Plains), and Dockum aquifers in west Texas with newly col-
raised concerns about the amount of available groundwater
lected data in a regional conceptual model of the aquifers. A
and long-term aquifer sustainability (Knowles and others,
regional conceptual model was developed in order to better
1984; Peckham and Ashworth, 1993; Stovall, 2001; Blandford
understand the amount and quality of available groundwater
and others, 2003).
by combining information from a refined understanding of the
Also of concern are the potential changes in water-quality
hydrogeologic framework, geochemistry data, and informa-
resulting from dewatering and increased vertical groundwater
tion pertaining to the groundwater-flow system and aquifer
movement between adjacent water-bearing units (Weeks and
hydraulic properties.
others, 1988; Deeds and others, 2015). Large groundwater
A groundwater-flow system analysis was done to gain a
withdrawals in localized areas can lower hydraulic heads and
better understanding of the flow of groundwater throughout
cause vertical flow in hydraulically connected aquifer units
the aquifer system by incorporating information identified
because groundwater moves from areas of high hydraulic
from the hydrogeologic framework and the geochemical
head to areas of low hydraulic head (Pischel and Gannett,
analysis. Synoptic groundwater-level measurements were
2015). Because the Ogallala aquifer and underlying aquifers
made within each of the aquifers to aid in the understanding of
are hydraulically connected in some locations, groundwater-
the groundwater-flow system. To estimate the hydraulic prop-
level declines in the Ogallala aquifer and in the underlying
erties for the aquifer system, historical data were compiled and
Edwards-Trinity (High Plains) aquifer can result in changes in
supplemented by collecting additional borehole and surface
water quality when the waters are mixed by the upward move-
geophysical data. The Dockum Group, a relatively minor
ment of deeper, relatively more saline groundwater (Bradley
source of water in the study area, was evaluated as a single
and Kalaswad, 2003).
unit. The water-bearing units of the Dockum Group were not
In 2014, the U.S. Geological Survey (USGS), in coopera-
evaluated for this study; only ancillary data from the Dockum
tion with the UWCDs, began a multiphase study to refine the
aquifer were used to aid in the interpretation of the overlying
understanding of the hydrogeologic framework, geochemis-
units. Neither the unit thickness nor storage properties of the
try, groundwater-flow system, and hydraulic properties to be
Dockum aquifer were determined.
included in the development of a regional conceptual model
for the Ogallala, Edwards-Trinity (High Plains), and the
Dockum aquifers (fig. 1). Available data were supplemented Description of Study Area
with additional geophysical data collected in selected areas
to improve the spatial coverage and to reduce uncertainty The study area is in the Great Plains physiographic
province (fig. 1) and consists of an elevated and relatively
1The Edwards-Trinity aquifer is divided into two parts by the Texas Water undissected plain (Ryder, 1996). The study area covers about
Development Board—a “High Plains” part in west Texas referred to as the 3,225 mi2, including 1,525 mi2 in LEUWCD, 798 mi2 in
“Edwards-Trinity (High Plains) aquifer” that coincides with the study area of SLUWCD, and 902 mi2 in SPUWCD (fig. 2) (Llano Estacado
this report, and a “Plateau” part extending across much of the southwestern Underground Water Conservation District, 2020a; Sandy
part of the State referred to as the “Edwards-Trinity (Plateau) aquifer” (George
Land Underground Water Conservation District, 2020; South
and others, 2011).6 Development of Conceptual Model of Ogallala, Edwards-Trinity (High Plains), and Dockum Aquifers, Texas
Plains Underground Water Conservation District, 2020a). As Ogallala Formation, erosional processes formed a complex,
of July 1, 2018, the population of the study area was about irregular surface in the underlying sediments of the Trinity
42,000 (U.S. Census Bureau, 2020). and Fredericksburg Groups and thinned the geologic units in
The climate of the study area is semiarid (Larkin and many places. The late Miocene- to early Pliocene-age Ogallala
Bomar, 1983). Precipitation averages 18.8 inches per year, Formation is composed primarily of poorly sorted gravel,
mostly in the form of rain (National Oceanic and Atmospheric sand, silt, and clay, which in many places were deposited in
Administration, 2010). The potential evapotranspiration paleochannels and alluvial deposits. Thicker alluvial deposits
is more than three times the annual precipitation (Larkin of Ogallala Formation rocks occur in areas where erosion
and Bomar, 1983). The average annual temperature dur- of the underlying Cretaceous-age rocks was most extensive
ing 1981–2010 for the study area was about 60.5 degrees (Bradley and Kalaswad, 2003). The Ogallala Formation
Fahrenheit (°F), with the warmest average monthly tempera- directly overlies the Dockum Group where the Trinity and
ture in July (79.1 °F) and the coolest average monthly temper- Fredericksburg Groups are absent (Ashworth and Hopkins,
ature in January (40.0 °F) (National Oceanic and Atmospheric 1995) (fig. 4).
Administration, 2010).
The combination of minimal topographic relief, avail-
ability of groundwater for irrigation, and excellent soils makes Hydrogeologic Setting
this an important agricultural region in Texas (Ryder, 1996).
The Ogallala aquifer is a major aquifer in the study
From the USGS National Land Cover Database (NLCD)
area; it is unconfined and is contained within the Ogallala
2011, the land-cover categories for rangeland (shrubs/scrubs
Formation (fig. 4). Multiple studies describe the general
[31 percent] and grassland/herbaceous [19 percent]) and
structure of the Ogallala aquifer as featuring paleochannels
for cultivated crops (42 percent) dominate in the study area
eroded into the underlying hydrogeologic units; paleochan-
(fig. 3) (Homer and others, 2015). The top crop in the study
nels are important conduits for groundwater flow and are filled
area is cotton with about 858 mi2 planted in 2017 (U.S.
with coarse gravel in the channel and often filled with sand
Department of Agriculture, 2019). Other important crops in
and finer sediments in the interchannel areas (for example,
the study area are peanuts (184 mi2 planted), sorghum (65 mi2
Cronin, 1969; Seni, 1980; Gustavson, 1996). The variable
planted), forage (37 mi2 planted), wheat (33 mi2 planted), corn
distribution of coarse, permeable sediments affects the spatial
(12 mi2 planted), vegetables (7 mi2 planted), and sunflower
differences in the water-storage capacity and water-availability
seeds (7 mi2 planted). Water use in the study area is almost all
characteristics (Seni, 1980; Texas Water Development Board,
from groundwater sources (99 percent) with 97 percent of the
2020b). DS concentrations in the Ogallala aquifer typically
groundwater used for irrigation (Texas Water Development
are less than 1,000 milligrams per liter (mg/L) (the upper limit
Board, 2017).
for what is generally considered freshwater [Winslow and
Kister, 1956]) but can range from less than 600 to more than
Geologic Setting 6,000 mg/L within localized parts of the study area (Llano
Estacado Underground Water Conservation District, 2020a;
The Triassic-age Dockum Group underlies the Llano Estacado Underground Water Conservation District,
Cretaceous-age Trinity and Fredericksburg Groups and the 2020b; South Plains Underground Water Conservation
Ogallala Formation (fig. 4) throughout much of the southern District, 2020b). In many areas, groundwater moves vertically
part of the High Plains physiographic province (fig. 1). The between the Ogallala aquifer and the underlying Edwards-
Dockum Group consists of siltstone, mudstone, and shale with Trinity (High Plains) and Dockum aquifers (fig. 1; fig. 4).
a small amount of sandstone originally deposited in fluvial The Edwards-Trinity (High Plains) aquifer is a minor,
and lacustrine environments (McGowen and others, 1979; semiconfined aquifer underlying the Ogallala aquifer, except
Bradley and Kalaswad, 2003). The overlying Trinity Group in the southern part of the study area where the Edwards-
consists of sand and gravel layers (fig. 4). The Trinity Group Trinity (High Plains) aquifer is absent (George and others,
is overlain by the Fredericksburg Group, which is composed 2011) (fig. 1; fig. 4). The Edwards-Trinity (High Plains) aqui-
of clay, shale, and limestone (Bell and Morrison, 1979). A thin fer is contained within the Trinity and Fredericksburg Groups
layer of the Cretaceous-age Washita Group is present in the where the Fredericksburg Group acts as a semiconfining unit
northern and northeastern parts of the study area. The Washita to the more permeable Trinity Group. Groundwater flow in
Group, which overlies the Fredericksburg Group, consists the Edwards-Trinity (High Plains) aquifer is controlled by
of shale and limestone. For this study, the Washita Group is facies changes, structure orientation, local cementation, and
interpreted to be part of the Fredericksburg Group because it is paleochannels that can produce local deviations in flow pat-
difficult to distinguish the contact between the Fredericksburg terns (Fallin, 1989). Groundwater from the Edwards-Trinity
and Washita Groups and because the Washita Group has been (High Plains) aquifer is typically slightly saline (DS concen-
thinned or completely removed at many locations in the study trations range from 1,000 to 3,000 mg/L) (Winslow and Kister,
area (Brand, 1953; Fallin, 1989). Prior to the deposition of theYou can also read