Identification of potential key genes and pathways associated with the Pashmina fiber initiation using RNA Seq and integrated bioinformatics analysis
←
→
Page content transcription
If your browser does not render page correctly, please read the page content below
www.nature.com/scientificreports
OPEN Identification of potential key
genes and pathways associated
with the Pashmina fiber initiation
using RNA‑Seq and integrated
bioinformatics analysis
Basharat Bhat1,2*, Mifftha Yaseen3, Ashutosh Singh2, Syed Mudasir Ahmad1 &
Nazir A. Ganai1*
Pashmina goat (Capra hircus) is an economically important livestock species, which habitats the cold
arid desert of the Ladakh region (India), and produces a princely animal fiber called Pashmina. The
Pashmina goat has a double coat fleece as an adaptation to the very harsh cold winters the outer
long coarse hair (guard hair) produced from primary hair follicles and the inner fine Pashmina fiber
produced from secondary hair follicles. Pashmina fiber undergoes a circannual and synchronized
growth cycle. In the present study, we analyzed transcriptome profiles from 10 different Pashmina
goats during anagen and telogen to delineate genes and signaling pathways regulating active
(anagen) and regressive (telogen) phases of the follicle growth. During anagen, 150 genes were
expressed at significantly higher levels with log (FC) > 2 and padj < 0.05. The RNA seq results were
subjected to qRT-PCR validation. Among the nine genes selected, the expression of HAS1, TRIB2,
P2RX1. PRG4, CNR2, and MMP25 were significantly higher (p < 0.05) in the anagen phase, whereas
MC4R, GIPC2, and CDO1 were significantly expressed (p < 0.05) in the telogen phase which supports
and validates the gene expression pattern from the RNA-sequencing. Differentially expressed genes
revealed that Pashmina fiber initiation is largely controlled by signaling pathways like Wnt, NF-Kappa,
JAK-STAT, Hippo, MAPK, Calcium, and PI3K-Akt. Expression of genes from the Integrin family, Cell
adhesion molecules, and ECM-receptors were observed to be at much higher levels during anagen.
We identified key genes (IL36RN, IGF2, ITGAV, ITGA5, ITCCR7, CXCL5, C3, CCL19, and CXCR3) and
a collagen cluster which might be tightly correlated with anagen-induction. The regulatory network
suggests the potential role of RUNX3, NR2F1/2, and GATAfamily transcription factors in anagen-
initiation and maintaining fiber quality in Pashmina goats.
Pashmina goat (Capra hircus) is an economically important animal genetic resource adapted to very harsh cold
arid agro-climatic conditions of Ladakh region (Jammu and Kashmir—India). The cold desert of Ladakh has a
very short growing season and remains landlocked for more than half of the year. The mercury level of this land-
locked high-altitude habitat (5500–6000 m above mean sea level) of Pashmina goat fluctuates between + 35 °C
(short summers) and – 40 °C (long winters). Under these stressful conditions (cold, arid, hypoxic and scanty
vegetation), Pashmina goats remain active with different adaptation strategies. This goat produces the world’s
finest (11–14 µ) natural fibre (Pashmina fiber) which is used in the making of world-famous Pashmina/Cash-
mere shawls.
Pashmina fibre is the soft under-coat of the Pashmina goat mixed with coarse outer coat known as guard hair1.
The guard hair develops from primary hair follicles (PHF) and Pashmina from secondary hair follicles (SHF).
Pashmina fibre provides softness and luster to the product and has the glamour of being very rare. The unique
1
Division of Animal Biotechnology, Sher-e-Kashmir University of Agricultural Sciences and Technology of Kashmir,
FV.Sc and A.H, Shuhama, Jammu and Kashmir 190016, India. 2Department of Life Science, Shiv Nadar University,
Gautam Buddha Nagar, UP 201314, India. 3Department of Interdisciplinary Sciences, Jamia Hamdard University,
Delhi 110062, India. *email: bb284@snu.edu.in; naganai@skuastkashmir.ac.in
Scientific Reports | (2021) 11:1766 | https://doi.org/10.1038/s41598-021-81471-6 1
Vol.:(0123456789)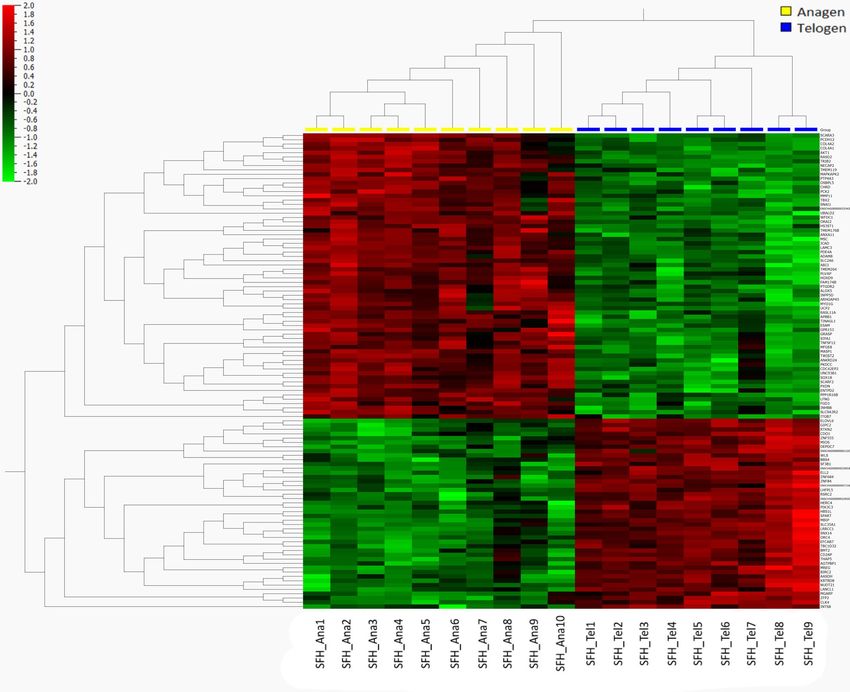
www.nature.com/scientificreports/
fiber properties like fineness, texture and warmness are co-related with Pashmina genetics and breeding traits.
The Pashmina fibers shed annually and are harvested by combing.
Hair follicles (HF) undergo cycles of the rapid growth phase (anagen), regression phase (catagen) and no-
growth phase (telogen) throughput the lifetime. Hair follicles produce entire new hair shaft during the anagen
phase. However, the underlying mechanism remains classical in the area2. Different approaches and animal
models have been utilized to decipher the genetic basis of fiber transition3–9. However, asynchronous hair growth,
the difference in skin anatomy and physiology restricts the identification of key molecular determinants mediat-
ing fiber transition.
Regulation of the hair cycle involves complex signaling interactions between Wnt (Wingless Integrin), Shh
(Sonic HedgeHog), Notch, BMP (Bone Morphogenic Protein) and other signaling P athways6. WNT10,11 and
12 13
Shh signaling is indispensably important for new anagen, whereas B MPs have been implicated in follicle
differentiation. However, signaling pathways involved in hair follicle cycling are not sufficiently studied to date
and new pathways are yet to be discovered for the proper understanding of the hair cycle2.
The secondary follicles of Pashmina goat present an excellent model for studying hair biology due to the cir-
cannual fiber cycle and synchronized fiber growth14. This follicle is also an excellent model for studying diverse
cellular, molecular and biological p rocesses15,16. In the present study transcriptomic profiling of skin biopsies
containing secondary hair follicles were utilized to identify key genes and signaling pathways involved in hair
follicle transition from no-growth phase (telogen) to growth phase (anagen).
Materials and methods
Experimental design. Changthangi goats were selected from the flock maintained at High Mountain Arid
Agricultural Research Institute (HMAARI) Stakna Leh (Ladakh). All animals were kept under the identical
conditions of natural photoperiod and natural temperatures. This study was approved by the Animal Welfare
and Ethics Committee of the Sher-e-Kashmir University of Agricultural Science and Technology of Kashmir
(SKUAST-K). All animal experiments were conducted in strict accordance with the rules and guidelines out-
lined by the SKUAST-K Animal Welfare Committee. As per the guidelines of the committee, the skin samples
were collected aseptically using skin biopsy punch under local anaesthesia with minimal pain and discomfort
to the animal.
Ten unrelated Pashmina goats of the same age (24 months) and sex (males) were repeatedly sampled during
anagen (October active growth phase) and telogen (March—resting phase, before combing)17. The skin samples
containing Pashmina follicles were collected from the flanking region of each goat. The skin biopsies samples
were snap-frozen in liquid nitrogen and shipped to the laboratory in RNA-later for processing. All samples cor-
responding to a particular stage were collected at the same time.
Total RNA extraction, library construction, and sequencing. Total RNA was isolated from the skin
tissues using the Trizol method (Invitrogen, USA) according to the manufacturer’s protocol. RNA samples with
a RIN value greater than 7.0 were selected for RNA-sequencing (RNA-seq). A total of 19 (10 anagen and 9 telo-
gen) samples were further carried forward for the analysis as one of the samples from telogen did not qualify
the minimum quality criteria for RNA-seq. For cDNA library preparation and sequencing, RNA samples were
stored at − 80 °C. Approximately 4 µg of total RNA was used to prepare the RNA sequencing library using the
TruSeq RNA Sample Prep Kits (Illumina) as per the kit’s protocol. Agilent-tape station plots were used at every
step to assess mRNA quality, enrichment success, fragmentation sizes, and final library sizes. Finally, the ampli-
fied fragments were sequenced using Illumina HiSeq 2500 to obtain 2 × 100 bp paired-end (PE) reads.
Data analysis. The raw reads were pre-processed to remove the adapter sequences, low-quality reads and
low-quality bases filtration towards 3′- end using cutadapt program v2.1018. Filtered reads were mapped to
Capra hircus reference assembly ARS1 using Hisat program v2.20 (release date 2/6/2020)19. Quality control and
alignment statistics (Supplementary Table 1) suggest the sequencing data were uniform among all sets of sam-
ples. Differential expression analysis between two contrast groups was performed using edgeR v3.30.320 using
Trimmed Means of M-values (TMM) normalization method and paired test, after removing low expressed genes
across all samples. DEGs between different cycling stages were screened based on the threshold of FDR corrected
P-value < 0.05 and absolute log2 (fold change) > 1. Significantly, dysregulated genes were subjected to functional
annotation and pathways enrichment analysis using KOBAS server v3.021,22.
Validation of DEGs with qPCR. cDNA was synthesized from 0.5 μg of the same total RNA used in RNA-
sequencing using the Revert Aid First Strand cDNA Synthesis Kit (Thermo Scientific, USA) as per the manufac-
turer’s protocol. qPCR reactions were run on a Roche Lightcycler 480 II in a 20-μl reaction containing 0.5 μl of
cDNA template, 10 μl of 2 × SYBR Green Master Mix, 0.3 μl of each primer (10 μmol/μl) and 8.9 μl nuclease-free
water. The amplification program consisted of one cycle at 95 °C for 10 s, followed by 40 cycles of 95 °C for 15 s
and 55 °C for 34 s. The qPCR reactions for each gene were performed with three biological replicates. Relative
gene expression was normalized to the expression of goat GAPDH and calculated with the 2−ΔΔCT method23. The
expression levels of the genes obtained in RNA-seq and qPCR were compared with Pearson correlation coef-
ficient.
Results
Primary processing of reads and differentially expressed genes. A summary of sequencing read
alignments to the reference Capra hircus genome assembly ARS1 is presented in Supplementary Table 1. On
average, 97% of the total reads were mapped successfully. Among the aligned reads, 98% were mapped to unique
Scientific Reports | (2021) 11:1766 | https://doi.org/10.1038/s41598-021-81471-6 2
Vol:.(1234567890)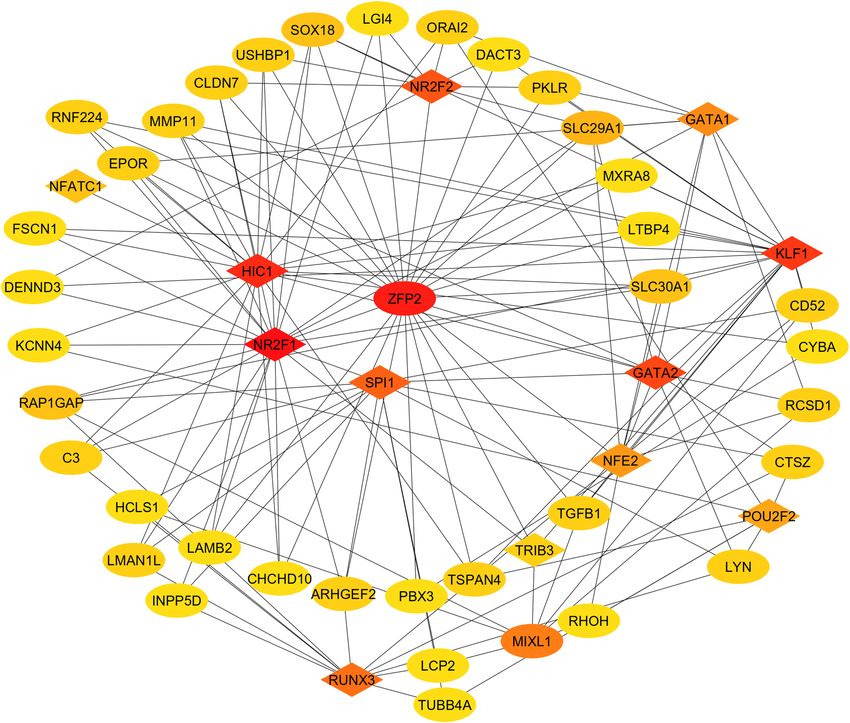
www.nature.com/scientificreports/
Figure 1. Hierarchical clustering and heatmap of top DEGs between two contrast groups. Columns indicate
individual samples, rows represent each differentially expressed gene, and the color scale represents the relative
expression level of the differentially expressed genes.
genomic regions. The characteristics of RNA-seq data were determined using PCA plots (Supplementary Fig. 1),
showing a clear segregation and clustering of samples from different stages. Based on differential expression
analysis using edgeR, 1094 genes were significantly dysregulated (log (FC) > 1, padj < 0.05). Of the DEGs, a total
of 748 were significantly up-regulated and 346 were down-regulated in the anagen (Supplementary Table 2) as
compared to telogen. Two-dimensional hierarchical clustering and heatmap of top differentially expressed genes
(q-value) were shown in Fig. 1.
Gene ontology and pathway enrichment analysis of DEGs. To gain insight into the biological pro-
cesses and pathways that could mediate the fiber growth in Pashmina goats, Gene ontology (GO) and KEGG
enrichment analysis were performed. The top enriched GO terms (Supplementary Table 3) for the DEGs are
related to biological processes like ‘immune system process’, ‘cell migration’, ‘developmental process’, ‘metabolic
process’ and molecular function terms like ‘protein binding’, ‘catalytic activity’, ‘growth factor binding’ and ‘trans-
porter activity’ suggesting the potential role of growth factors and immune response genes for initiating and
maintaining fiber activity. Anagen induction showed enrichment of 22 KEGG pathways (Table 1) which include
signaling pathways like PI3K-Akt, NF-kappa B, MAPK, Hippo Wnt and JAK-STAT.
Network analysis. To identify the possible protein–protein interaction (PPI) between DEGs, STRINGDB24
was utilized. The PPI network of DEGs consisted of 149 genes and 563 interactions (Fig. 2A). Two topological
features Maximal Clique Centrality (MCC) and degree were calculated to identify key nodes. Higher the two
quantitative values of a gene, the more important it is in the PPI network. The top nodes ranked by degree and
MCC were identified, which included C–C Motif Chemokine Receptor 7 (CCR7), C-X-C Motif Chemokine
Ligand 5 (CXCL5), Complement C3(C3), C–C Motif Chemokine Ligand 19(CCL19), Complement C3a Recep-
tor 1 (C3AR1), Complement C5a Receptor 1 (C5AR1), C–X–C Motif Chemokine Receptor 3 (CXCR3), Pro-Mel-
Scientific Reports | (2021) 11:1766 | https://doi.org/10.1038/s41598-021-81471-6 3
Vol.:(0123456789)www.nature.com/scientificreports/
Pathways FDR corrected P-value Percentage enrichment Genes
CCL2, TNFSF12, LIF, CD40LG, IL10RA, TNFSF14, IL1F10,
IL36RN, CD4, CCR2, CCR4, CCR7, IL1A, TNFSF13B, CSF2RB,
CCL5, CSF1R, CCR10, THPO, CXCR3, INHBB, OSM, CXCR6,
Cytokine-cytokine receptor interaction 1.10E−11 14.24149
CCL14, IFNE, IL36G, TNFSF4, TGFB1, IL5RA, ACVRL1, IL2RB,
IL7R, CD40, LTB, LTA, FASLG, TNFRSF1B, EPOR, IL2RA, BMP5,
CXCL5, ACKR4, CCL19, IL21R, CLCF1, TNFRSF6B
PCK2, ITGA9, COL4A1, PDGFRB, CSF1R, LAMA2, ITGA5,
ITGA11, LAMB2, FLT1, THBS4, THBS2, PIK3CG, PIK3R5,
OSM, JAK3, FGF16, ANGPT4, IGF2, IGF1R, NOS3, ITGB7, IL7R,
PI3K-Akt signaling pathway 3.24E−07 10.72386
FASLG, COL4A2, TNC, LAMC3, KITLG, COL6A3, EPOR, IL2RA,
IL2RB, FN1, ITGAV, F2R, EREG, CREB3L4, VWF, COL6A2,
LPAR6
COL4A1, ITGA9, LAMA2, COL6A2, FN1, ITGB7, THBS4,
ECM-receptor interaction 7.52E−07 20.68966 HSPG2, THBS2, ITGA5, ITGAV, ITGA11, COL4A2, TNC,
LAMC3, VWF, LAMB2, COL6A3
ITGA9, CDH15, CLDN15, NRCAM, CD34, CD4, CD226, CD2,
L1CAM, CD40LG, CD86, ICAM1, ITGAL, CDH5, CDH4,
Cell adhesion molecules (CAMs) 9.32E−07 15.09434
CLDN7, ITGB2, ITGB7, CD40, CD8A, ITGAV, PTPRC, ITGAM,
ESAM
PTH1R, CCK, GABRR2, CHRNA10, C5AR1, ADCYAP1, P2RX1,
UTS2R, GPR35, MC4R, ADORA2B, CNR2, ADRB1, TAC1,
Neuroactive ligand-receptor interaction 6.92E−06 9.917355 RXFP2, P2RY10, ADRA2A, PTGER3, GAL, HRH2, C3, VIPR2,
GRM2, TBXA2R, GRID2, OXT, PMCH, F2RL3, S1PR4, APLNR,
C3AR1, DRD5, NPB, F2R, HCRTR1, LPAR6
ITGA9, COL4A1, PDGFRB, LAMA2, ITGA11, LAMB2, FLT1,
THBS4, THBS2, PARVB, PARVG, IGF1R, RAC2, ITGB7, SHC3,
Focal adhesion 8.17E−06 12.62626
ITGA5, COL4A2, TNC, LAMC3, VWF, FN1, VAV1, ITGAV,
COL6A3, COL6A2
CD40LG, TIRAP, CD14, CCL19, CARD11, TNFSF14, CD40, LTB,
NF-kappa B signaling pathway 1.86E−05 16.66667
LTA, ZAP70, ICAM1, PRKCQ, RELB, LYN, LAT, BTK, TNFSF13B
RASGRP2, PDGFRB, APBB1IP, PLCB2, GNAI2, FLT1, ADORA2B,
ARAP3, RAP1GAP, CSF1R, SIPA1, FGF16, ANGPT4, IGF1R,
Rap1 signaling pathway 3.10E−05 11.57407
ITGB2, RAC2, LAT, LCP2, KITLG, ADCY4, VAV1, F2R, ITGAL,
ITGAM, F2RL3
NFATC1, ADCYAP1, ATP2A3, ADCY10, RAC2, GNAI2, ARAP3,
ADRB1, CNGB3, CAMK4, PTGER3, VIPR2, NPR1, LIPE, OXT,
cAMP signaling pathway 0.000169188 10.52632
CNGA3, PDE10A, ADCY4, VAV1, DRD5, F2R, CREB3L4,
PDE4A, CFTR
RASGRP2, NFATC1, RASGRP4, PDGFRB, TGFB1, IL1A, FLT1,
CACNA1H, CSF1R, DUSP9, RELB, FGF16, ANGPT4, IGF2,
MAPK signaling pathway 0.00685971 7.876712
IGF1R, RAC2, STK3, FASLG, KITLG, PTPN7, RPS6KA2, CD14,
EREG
ORAI2, TBXA2R, ADORA2B, NOS3, F2R, PLCB2, ADCY4,
Calcium signaling pathway 0.006925474 8.866995 DRD5, CAMK4, PDGFRB, PTGER3, ITPKA, ADRB1, GNA14,
HRH2, CACNA1H, P2RX1, ATP2A3
IGF2, RASGRP2, IGF1R, RAC2, RASGRP4, SHC3, PLA2G12B,
Ras signaling pathway 0.0081218 8.264463 CSF1R, FGF16, PLA2G2E, ZAP70, PLA2G2F, LAT, FASLG,
KITLG, RASA3, PDGFRB, RASAL3, ANGPT4, FLT1
COL15A1, SLC9A3, KCNQ1, COL5A3, KCNN4, COL13A1,
Protein digestion and absorption 0.01083711 10.61947
COL4A2, COL4A1, COL24A1, COL6A3, COL6A2, SLC1A1
PTGS1, TBXAS1, PLA2G12B, ALOX5, EPHX2, PTGIS, ALOX15,
Arachidonic acid metabolism 0.011034945 12.04819
PLA2G2E, PLA2G2F, PTGES
WNT2B, ADCY4, PLCB2, CREB3L4, WNT3, WNT2, WNT9A,
Melanogenesis 0.014067417 10.78431
FZD9, WNT5B, KITLG, GNAI2
WNT2B, TGFB1, BMP5, ITGB2, WNT3, WNT2, STK3, WNT9A,
Hippo signaling pathway 0.014200591 9.271523
FZD9, DLG2, WNT5B, WTIP, SERPINE1, CTNNA3
ADCY4, NFATC1, PLCB2, NOS3, NFATC4, NPR1, ATP2A3,
cGMP-PKG signaling pathway 0.014896486 8.87574 KCNJ8, ADRA2A, PIK3CG, ADRB1, PIK3R5, CREB3L4, PDE2A,
GNAI2
ADCY4, PDGFRB, FCER1G, FCER1A, SHC3, MS4A2, PLCB2,
Phospholipase D signaling pathway 0.014927328 9.210526
PIK3CG, F2R, PIK3R5, KITLG, LPAR6, CYTH4, GRM2
WNT2B, NFATC1, PLCB2, NFATC4, RSPO4, WNT3, WNT2,
Wnt signaling pathway 0.021435141 8.695652
LGR5, SOX17, RSPO2, WNT9A, FZD9, WNT5B, RAC2
IL7R, IL2RA, IL2RB, STAT4, SOCS1, IL10RA, PDGFRB, IFNE,
Jak-STAT signaling pathway 0.025691752 7.920792
IL21R, IL5RA, THPO, LIF, OSM, JAK3, CSF2RB, EPOR
WNT2B, LIF, PCGF6, WNT3, WNT2, IGF1R, INHBB, DUSP9,
Signaling pathways regulating pluripotency of stem cells 0.035422505 8.633094
JAK3, WNT9A, FZD9, WNT5B
ADCY4, PKLR, ENTPD2, NPR1, ADA2, AK5, PDE2A, PDE6A,
Purine metabolism 0.049889538 8.148148
ADCY10, PDE4A, PDE10A
Table 1. Enriched KEGG pathways for DEGs between anagen and telogen.
Scientific Reports | (2021) 11:1766 | https://doi.org/10.1038/s41598-021-81471-6 4
Vol:.(1234567890)www.nature.com/scientificreports/
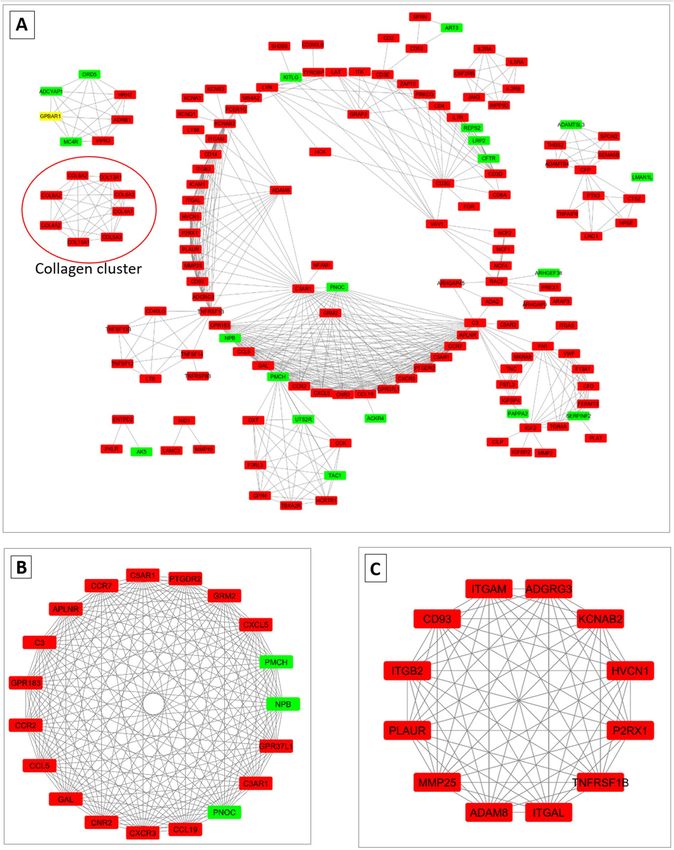
Figure 2. Protein–protein interaction (PPI) network and hub clustering modules. Red color represents genes
up-regulated in anagen and green color represent genes downregulated in the anagen (A) The PPI network of
overlapping differentially expressed genes between telogen and anagen. (B) Cluster 1 (MCODE score = 19). (C)
Cluster 2 (MCODE score = 12).
Scientific Reports | (2021) 11:1766 | https://doi.org/10.1038/s41598-021-81471-6 5
Vol.:(0123456789)www.nature.com/scientificreports/
Figure 3. TF-gene regulatory network (developed using ref.19,20). The eclipse in the TF-gene network
represented mRNA and the diamonds represented TFs. Color represents degree (red to yellow represent
decreasing order of degree).
anin Concentrating Hormone (PMCH), G Protein-Coupled Receptor 183 (GPR183), G Protein-Coupled Recep-
tor 183 (GPR37L1). The enrichment analysis of key genes in the PPI network suggests their role in Chemokine
signaling pathway (FDR = 0.00001) and Cytokine-cytokine receptor interaction (FDR = 0.0007). Chemokine path-
way might be associated with a unique immune milieu responsible for hair follicle immune privilege that occurs
in the anagen phase to spare the cell proliferation in the follicle from the possible immune reaction.
Additionally, a cluster of 8 closely related collagen genes were detected which were all up-regulated in anagen,
suggesting that collagen genes may play an important role in hair cycle and maintaining continuous hair growth
(Fig. 2A—solid red outlined). In order to identify other significant clusters from the PPI network a module
analysis was performed and the top 2 modules with high scores were selected. Cluster 1 contained 19 nodes and
171 interactions (Fig. 2B). KEGG enrichment analysis suggest, genes in cluster 1 were enriched in ‘Neuroactive
ligand-receptor interaction (FDR = 9.8 × 10⁻⁸)’, ‘Chemokine signaling pathway (FDR = 3.5 × 10⁻⁵)’ and ‘Cytokine-
cytokine receptor interaction (FDR = 4.5 × 10⁻⁴)’. GO enrichment analysis suggest genes in cluster 1 was closely
related to ‘chemokine-mediated signaling (FDR = 5.1 × 10⁻⁶)’, ‘immune response (FDR = 0.00014)’, ‘regulation of
cell migration (FDR = 0.0003)’ and ‘nervous system development (FDR = 0.0181)’. Nervous system and hair fol-
licle epithelium share a common ectodermal origin; therefore, it is reasonable to ask whether neurohormones
are also involved in hair growth control. Cluster 2 contained 12 genes and 66 interactions (Fig. 2C), the genes
were mainly implicated in ‘RAP1 signaling pathway (FDR = 0.0011), ‘Cell adhesion molecules (FDR = 0.0006)’and
‘integrin- mediated signaling (FDR = 0.01)’. Integrins are adhesion receptors allow cells to sense and respond to
microenvironmental signals which could be essential in telogen to anagen transition in Pashmina goats as well.
The hair cycle is a highly regulated process, earlier studies suggest growth factors, cytokines, hormones, and
transcription factors (TFs) play a critical role in mediating overall hair cycle3. In this study, a TF-regulatory net-
work was generated (Fig. 3) to identify the critical TFs mediating anagen induction in Pashmina goats25–27. The
|(log (FC))| and degree were used to identify key TFs in regulating hair cycle. The higher the two quantitative
values of a gene, the more important it is in the TF-regulatory network. The TF-gene interaction network con-
sisted of 50 nodes and 150 interactions (Fig. 3). The top-ranked TFs were Nuclear Receptor Subfamily 2 Group
F Member 1 (NR2F1), Zinc Finger Protein (ZFP2), HIC ZBTB Transcriptional Repressor 1 (HIC1), Kruppel Like
Factor 1 (KLF1), GATA Binding Protein 2 (GATA2), Nuclear Receptor Subfamily 2 Group F Member 2 (NR2F2),
Scientific Reports | (2021) 11:1766 | https://doi.org/10.1038/s41598-021-81471-6 6
Vol:.(1234567890)www.nature.com/scientificreports/
Spi-1 Proto-Oncogene (SPI1), RUNX Family Transcription Factor 3 (RUNX3), Mix Paired-Like Homeobox
(MIXL1) and GATA Binding Protein 1 (GATA1). Interestingly, ZFP2 was the only gene down-regulated in the
active growth phase.
Validation of DEGs with qPCR. The differential expression of 5 genes namely; HAS1, TRIB2, P2RX1,
PRG4, CNR2, MMP25, GIPC2, CDO1, and MC4R was validated by qRT-PCR. Primer pairs for these genes are
listed in Supplementary Table 4. The expression profile of these genes obtained by qRT-PCR showed a similar
trend (Pearson’s correlation coefficient = 0.88) with the RNA-seq results, thereby validating the RNA-seq results
(Supplementary Fig. 2).
Discussion and conclusion
Hair growth has been reported to be regulated by a complex mechanism involving multiple endogenous and
exogenous factors. Understanding the genetic basis of fibre production phenotypes could contribute to the
improvement of the fibre production efficiency in Pashmina goats and also help in identifying molecular determi-
nants involved in anagen initiation. In this study, skin samples specifically containing SHFs were collected during
anagen and telogen to identify key regulators and pathways associated with the telogen–anagen (TA) transition.
Enrichment analysis of the DEGs for the TA transition revealed that the transition involves as many as 22
unique pathways. Among the enriched pathways Wnt, NF-B, JAK-STAT, MAPK and Calcium signaling are
known in regulating hair follicle morphogenesis and development. Wnt acts as master regulating during hair folli-
cle morphogenesis. NF-κB and Wnt signaling pathways play a vital role in hair follicle initiation and development.
Strong NF-κB activity was detected in the secondary hair germ of late telogen and early anagen HFs in mouse28,
suggesting a potential role for NF-κB in HF stem/progenitor cell activation during anagen induction. The pre-
sent study also suggests a possible role of NF-κB in anagen induction. In the present study, the up-regulation of
IL36RN during telogen which inhibits NF-κB suggests its potential role in maintaining telogen in Pashmina goats.
The JAK-STAT pathway has recently been reported to be important in anagen induction and is responsible for
jump-starting the hair cycle29,30. Up-regulation of IGF2 and enrichment of MAPK in anagen suggests the role of
IGF2 in promoting anagen via MAPK signaling. Calcium signaling pathway was also significantly enriched. A
transient role of Ca is reported during HF cycling31. Also, the melanogenesis pathway was significantly enriched
in TA transition suggesting that melanogenesis pathway also resonate with hair cycle in Pashmina g oats32.
The most distinguishing feature of the present study was significant enrichment of ECM-receptor interaction
and Cell adhesion molecules (CAMs). Hair follicle growth depends on the interaction between CAMs and ECM-
receptors (enriched by 18 genes and 24 genes respectively), it was found that ITGAV was strongly up-regulated
in telogen samples, suggesting the potential role of ITGAV in maintaining hair follicle in the telogen phase. Pro-
tein–protein interaction network (Fig. 2A) suggests the potential role of Integrin molecules like ITGB7, ITGA5,
ITGA9 and ITGA11 in anagen-induction. In human adipose stem cells, the increase in ITGAV causes reduced
cell proliferation33. However, the increased levels of ITGA5 activates cell proliferation and differentiation. Our
data might postulate a functional role of ITGAV and ITGA5 in hair cycle.
Moreover, several other pathways mediating cellular adhesion, cell differentiation and proliferation were
significantly enriched in Pashmina anagen induction, including ‘pathways regulating pluripotency of stem cells’,
‘PI3K-Akt’, ‘Hippo’, ‘RAP1’, ‘RAS’, ‘cGMP-PKG’, ‘cAMP’, ‘Neuroactive ligand-receptor interaction’ and ‘Cytokine-
cytokine receptor interaction’. PI3K-Akt signaling promotes cell proliferation in animal tissues by mediating
Hippo signaling34, up-regulating of genes positively mediating PI3K-Akt and downregulation of genes regulat-
ing Hippo signaling during anagen is therefore plausible. In our data, IGF1R was identified to be up-regulated
during anagen which acts as a key regulator for PI3K-Akt, MAPK, RAS, RAF signaling pathways suggesting its
importance in TA t ransition35.
A total of 10 key TFs were identified from the TF-regulatory network namely, GATA2, GATA1, RUNX3,
NR2F1, NR2F2, HIC1, SPI1, MIXL1, ZFP2 and KLF1. Interestingly, ZFP2 was the only gene downregulated in the
active growth phase (anagen). The GATA family of TFs plays an important role during embryonic development,
including cell fate decision and tissue morphogenesis. GATA1 knockdown mouse exhibits developmental arrest
and cell death36,37, network analysis suggest GATA1 interact with GATA2 may be for controlled cell differentia-
tion and proliferation. RUNX3 plays a critical role in normal hair growth, a RUNX3 knockdown mice shows
significant change in hair structure and composition38. This study also suggests the potential role of more diverse
TFs (like NR2F1, NR2F2, HIC1, SPI1, MIXL1, ZFP2 and KLF1) in promoting anagen.
Data availability
The sequencing data is available in NCBI under accession number GSE164100.
Received: 27 July 2020; Accepted: 7 January 2021
References
1. Ansari-Renani, H. et al. Determination of hair follicle characteristics, density and activity of iranian cashmere goat breeds. Small
Rumin. Res. 95, 128–132 (2011).
2. Chermnykh, E., Kalabusheva, E. & Vorotelyak, E. Extracellular matrix as a regulator of epidermal stem cell fate. Int. J. Mol. Sci. 19,
1003 (2018).
3. Stenn, K. & Paus, R. Controls of hair follicle cycling. Physiol. Rev. (2001).
4. Schneider, M. R., Schmidt-Ullrich, R. & Paus, R. The hair follicle as a dynamic miniorgan. Curr. Biol. 19, R132–R142 (2009).
5. Lee, J. & Tumbar, T. Hairytaleofsignalinginhairfollicledevelopmentandcycling. Semin. Cell Dev. Biol. 23, 906–916 (2012).
6. Rishikaysh, P. et al. Signaling involved in hair follicle morphogenesis and development. Int. J. Mol. Sci. 15, 1647–1670 (2014).
Scientific Reports | (2021) 11:1766 | https://doi.org/10.1038/s41598-021-81471-6 7
Vol.:(0123456789)www.nature.com/scientificreports/
7. Parakkal, P. F. The fine structure of the dermal papilla of the guinea pig hair follicle. J. Ultrastruct. Res. 14, 133–142 (1966).
8. Porter, R. M. Mouse models for human hair loss disorders. J. Anat. 202, 125–131 (2003).
9. Orasan, M. S., Roman, I. I., Coneac, A., Muresan, A. & Orasan, R. I. Hair loss and regeneration performed on animal models.
Clujul Med. 89, 327 (2016).
10. Huelsken, J. & Birchmeier, W. New aspects of Wnt signaling pathways in higher vertebrates. Curr. Opin. Genet. Dev. 11, 547–553
(2001).
11. Lowry, W. E. et al. Defining the impact of β-catenin/Tcf transactivation on epithelial stem cells. Genes Dev. 19, 1596–1611 (2005).
12. St-Jacques, B. et al. Sonic hedgehog signaling is essential for hair development. Curr. Biol. 8, 1058–1069 (1998).
13. Botchkarev, V. A. et al. Noggin is a mesenchymally derived stimulator of hair-follicle induction. Nat. Cell Biol. 1, 158–164 (1999).
14. Allain, D. & Renieri, C. Geneticsoffibreproductionandfleececharacteristicsinsmallruminants,angorarabbitandsouth american
camelids. Animal 4, 1472 (2010).
15. Alonso, L. & Fuchs, E. The hair cycle. J. cell science 119, 391–393 (2006).
16. Müller-Röver, S. et al. A comprehensive guide for the accurate classification of murine hair follicles in distinct hair cycle stages. J.
Investig. Dermatol. 117, 3–15 (2001).
17. Su, R. et al. Transcriptomic analysis reveals critical genes for the hair follicle of inner mongolia cashmere goat from catagen to
telogen. PLoS ONE 13, e0204404 (2018).
18. Martin, M. Cutadapt removes adapter sequences from high-throughput sequencing reads. EMBnet. J. 17, 10–12 (2011).
19. Kim, D., Paggi, J. M., Park, C., Bennett, C. & Salzberg, S. L. Graph-based genome alignment and genotyping with hisat2 and hisat-
genotype. Nat. Biotechnol. 37, 907–915 (2019).
20. McCarthy, D. J., Chen, Y. & Smyth, G. K. Differential expression analysis of multifactor rna-seq experiments with respect to bio-
logical variation. Nucleic Acids Res. 40, 4288–4297 (2012).
21. Xie, C. et al. Kobas 2.0: a web server for annotation and identification of enriched pathways and diseases. Nucleic Acids Res. 39,
W316–W322 (2011).
22. Bhat, B. A., Singh, G., Sharma, R., Yaseen, M. & Ganai, N. A. Biologicalnetworks:Tools,methods,andanalysis. Essent. Bioinform.
1, 255–286 (2019).
23. Livak, K. J. & Schmittgen, T. D. Analysisofrelativegeneexpressiondatausingreal-timequantitativepcrandthe2-δ δ ct method. Methods
25, 402–408 (2001).
24. Szklarczyk, D. et al. String v11: Protein–protein association networks with increased coverage, supporting functional discovery
in genome-wide experimental datasets. Nucleic Acids Res. 47, D607–D613 (2019).
25. Rouillard, A. D. et al. The harmonizome: A collection of processed datasets gathered to serve and mine knowledge about genes
and proteins. Database 2016, 100 (2016).
26. Shannon, P. et al. Cytoscape: A software environment for integrated models of biomolecular interaction networks. Genome Res.
13(11), 2498–2504 (2003).
27. Bhat, B. et al. TM-Aligner: Multiple sequence alignment tool for transmembrane proteins with reduced time and improved accu-
racy. Sci. Rep. 7, 1–8 (2017).
28. Krieger, K. et al. Nf-κb participates in mouse hair cycle control and plays distinct roles in the various pelage hair follicle types. J.
Investig. Dermatol. 138, 256–264 (2018).
29. Legrand, J. M. et al. Stat5 activation in the dermal papilla is important for hair follicle growth phase induction. J. Investig. Dermatol.
136, 1781–1791 (2016).
30. Wang, E., Harel, S. & Christiano, A. M. Jak-stat signaling jump starts the hair cycle. J. Investig. Dermatol. 136, 2131–2132 (2016).
31. Mady, L. J. et al. The transient role for calcium and vitamin d during the developmental hair follicle cycle. J. Investig. Dermatol.
136, 1337–1345 (2016).
32. Bhat, B. et al. Comparative transcriptome analysis reveals the genetic basis of coat color variation in pashmina goat. Sci. Rep. 9,
1–9 (2019).
33. Morandi, E. et al. Itgav and itga5 diversely regulate proliferation and adipogenic differentiation of human adipose derived stem
cells. Sci. Rep. 6, 28889 (2016).
34. Yuan, J., Yin, Z., Tao, K., Wang, G. & Gao, J. Function of insulin-like growth factor 1 receptor in cancer resistance to chemotherapy.
Oncol. Lett. 15, 41–47 (2018).
35. Borreguero-Muñoz, N. et al. The hippo pathway integrates pi3k–akt signals with mechanical and polarity cues to control tissue
growth. PLoS Biol. 17, e3000509 (2019).
36. Weiss, M. J. & Orkin, S. H. Transcription factor gata-1 permits survival and maturation of erythroid precursors by preventing
apoptosis. Proc. Natl. Acad. Sci. 92, 9623–9627 (1995).
37. Huang, Z. et al. Gata-2 reinforces megakaryocyte development in the absence of gata-1. Mol. Cell. Biol. 29, 5168–5180 (2009).
38. Raveh, E., Cohen, S., Levanon, D., Groner, Y. & Gat, U. Runx3 is involved in hair shape determination. Dev. Dyn. 233, 1478–1487
(2005).
Acknowledgements
This work was supported by grants from Indian Council of Agricultural Research, under National Agricultural
Science Fund scheme and NAHEP, which are duly acknowledged. The bioinformatics data analysis was supported
by the Bioinformatics Infrastructural facility under BTISNet program of DBT, Govt. of India.
Author contributions
N.A.G., and B.B. designed the study; A.S., B.B., and N.A.G., planed the work-flow; B.B., and M.Y. performed
data analysis; B.B., S.M.A., and M.Y. performed qPCR validation and wrote the manuscript. All authors reviewed
the manuscript.
Funding
This work was supported by grants from the Indian Council of Agricultural Research (ICAR)—NASF/GTR-
5006/2015-16, under National Agricultural Science funded project (NASF).
Competing interests
The authors declare no competing interests.
Additional information
Supplementary Information The online version contains supplementary material available at https://doi.
org/10.1038/s41598-021-81471-6.
Scientific Reports | (2021) 11:1766 | https://doi.org/10.1038/s41598-021-81471-6 8
Vol:.(1234567890)www.nature.com/scientificreports/
Correspondence and requests for materials should be addressed to B.B. or N.A.G.
Reprints and permissions information is available at www.nature.com/reprints.
Publisher’s note Springer Nature remains neutral with regard to jurisdictional claims in published maps and
institutional affiliations.
Open Access This article is licensed under a Creative Commons Attribution 4.0 International
License, which permits use, sharing, adaptation, distribution and reproduction in any medium or
format, as long as you give appropriate credit to the original author(s) and the source, provide a link to the
Creative Commons licence, and indicate if changes were made. The images or other third party material in this
article are included in the article’s Creative Commons licence, unless indicated otherwise in a credit line to the
material. If material is not included in the article’s Creative Commons licence and your intended use is not
permitted by statutory regulation or exceeds the permitted use, you will need to obtain permission directly from
the copyright holder. To view a copy of this licence, visit http://creativecommons.org/licenses/by/4.0/.
© The Author(s) 2021
Scientific Reports | (2021) 11:1766 | https://doi.org/10.1038/s41598-021-81471-6 9
Vol.:(0123456789)You can also read