Image Quality Analysis of Smartphone Cameras - Rochester Institute ...
←
→
Page content transcription
If your browser does not render page correctly, please read the page content below
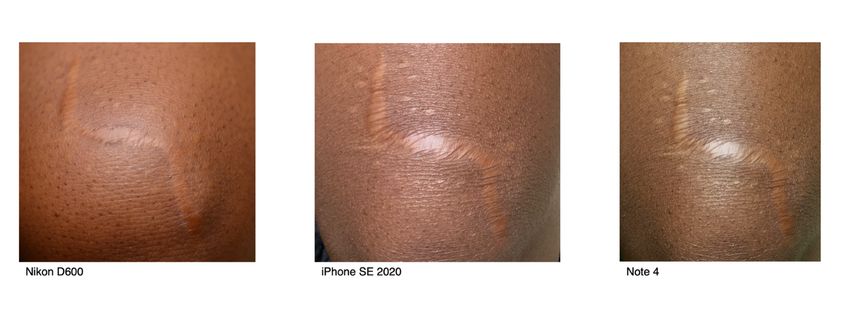
Image Quality Analysis of Smartphone
Cameras
Applications in Clinical Photography for Dermatology

Rebekah Greenberg

A final report for a Bachelor Science capstone project submitted to the faculty of
Photographic Sciences, College of Art and Design, Rochester Institute of Technology

May 2021

 I
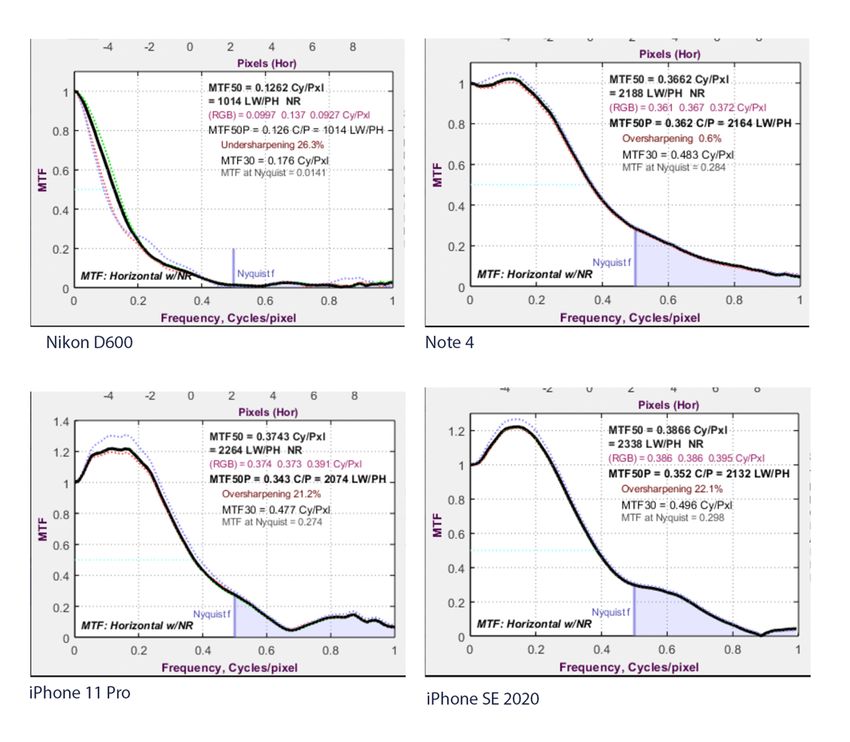
Table of Contents
Abstract ............................................................................................................................................................................ III

Project Background ........................................................................................................................................................ 1

Statement of Problem ..................................................................................................................................................... 2

Approach .......................................................................................................................................................................... 2

Literature Review............................................................................................................................................................. 3

Project Results................................................................................................................................................................. 4

Discussion ........................................................................................................................................................................ 7

Conclusion and Future Work ......................................................................................................................................... 8

Acknowledgements ......................................................................................................................................................... 9

References .......................................................................................................................................................................10

 II
Abstract
In dermatology, clinical smartphone photography is prevalent and has already been
implemented in several doctors' offices. However, it is unclear if smartphones have comparable
image quality to the industry standard DSLR camera (digital single lens reflex). A selection of
smartphone cameras and a DSLR camera will be compared using standard quality metrics with
test charts through image assessment. The results, which are a collection of images, will be
produced of dermatological scenarios to show the qualitative difference of each of the cameras.

 III
Project Background
Clinical photography, also known as medical photography, is used to record the clinical
presentation of patients through photographic images. Clinical photography helps detect and
track progress or changes throughout the patient's treatment. Images are tools to use for both
clinicians and to help educated students studying medicine. These images are used for many
different purposes, from research to the documentation of surgeries or conditions (Bhattacharya,
2014).

Dermatology is a branch of medicine that focuses on diagnosing and treating skin disorders.
Since this medical field is highly visual, it is important to gather accurate and precise imaging
data. The doctor may document a scar, a unique rash, or track mole growth throughout multiple
visits. The importance of a good quality imaging system is key to having consistent and accurate
data for patients to have throughout their treatments.

When one visits the dermatologist to get a mole, or a scar looked at by the doctor, the patient
was brought back into an examination room, and the doctor is coming in to examine them. The
doctor decides to help monitor and record a patient's problem area; they pull out their
smartphone camera to photograph it. While smartphone cameras are convenient and user-
friendly compared to a standard DSLR camera, they create issues that can affect the diagnosis
or tracking of skin problems.

Image quality assessment includes five basic attributes: tone, color, resolution, sharpness, and
noise. In this project, the image quality attributes focused on were color, sharpness, and noise.
The image quality attributes focused on were color, sharpness, and noise. Color represents the
replication of brightness, lightness, colorfulness, chroma, and hue. Sharpness is similar to
resolution but focuses more on the definition of edges. Lastly, noise is the irregular variations
around a signal presented by an imaging system. Image quality measurement aims to qualify
the relationship between the scene and image. Test charts are the objective method and are
calibrated such that they have consistent properties that can be compared between countless
equipment types (Allen et al., 2011, 353-354).

This project focuses on how a mid-market DSLR camera compares to a high-end and mid-
market smartphone camera. The areas focused on were to determine if color shifts and
sharpness differences were present in the devices. It is vital for the camera system not to
introduce artificial changes because it alters the image's perception. Another factor introduced
when imaging on a smartphone system is the device's post-processing. Over the past decade,
smartphones have significantly improved due to advances in image quality and sensor quality
(Haslam, 2018).

 1
Statement of Problem
Smaller healthcare institutions are not able to invest in professional camera gear or have access
to a professional medical photographer. However, documentation of patient conditions, such as
those in dermatology, is essential to healthcare. Doctors are already using smartphones to help
document conditions to monitor visible changes in patients, regardless of the potential
implications, this may have on image quality and consistency.

Approach
The first portion of this project was completed in the Photographic Sciences Technology Lab at
the School of Photographic Arts and Sciences (RIT) under the supervision of Nanette Salvaggio.

The images were taken from a mounted tripod for the DSLR and the smartphones: Nikon D600,
iPhone 11 Pro, iPhone SE 2020, and Samsung Note 4. The devices were checked out from the
third-floor cage at RIT or peers. A tripod was placed directly in front of the target in the tech lab,
with two LED panels lighting the charts evenly. The test charts imaged were a Color Checker,
Spilled Coins (Dead Leaves), Spatial Frequency Response (SRF), and sinusoidal. The different
cameras were mounted on a tripod or phone holder to photograph the test targets. Each chart
was photographed with each camera device with the same lighting and only moving the tripod to
ensure the whole chart filled the frame.

In the second portion of this project, the program Imatest was used to analyze the data. It took a
couple of sessions to get a complete analysis of all the images. Using the remote desktop
function at RIT, the program, Imatest, was provided at no cost.

In the end, not all the charts that were photographed were evaluated by Imatest. This was due
to imaging all available targets in case the pandemic resulted in an unplanned school closure.
Different charts were input, to be read and assessed by Imatest. The best method to use the
remote desktop function was to put the final images into a Google drive folder. That method
helped keep organized between the various devices involved.

The charts that ran through the program were the color checker chart and the SFR bar chart.
The color checker data gave the Delta E00 values related to color shifts. The SFR chart analyzed
and provided modulation transfer function (MTF) data relating to sharpness information. All the
results were analyzed to determine the differences in image quality between the devices.

The third portion of this project was complete in the Photographic Sciences Lab. Real-life
photographs are the subjective portion and was completed after the qualitative portion. The real-
life images were collected under lighting conditions that mimic a doctor's office. All photographs
were taken following strict COVID19 safety protocols. The subject matter photographed were
moles and scars on various skin tones (light and dark skin). These photographs were put into a
document to compare the different devices for easy viewing.

 2
Literature Review
The Australasian College of Dermatologists completed a study about smartphone use in clinical
practices of dermatology. In 2017, the Australasian College of Dermatologists sent out a survey
to a group of Australian dermatologists and trainees to see their current practices involving
clinical smartphone use. A pool of approximately 100 respondents, over 50%, have sent and
received images on their smartphones at least once a week. The study concluded that
smartphones are already in use in dermatology, and their level of use is increasing (Abbott,
2017). According to a 2018 survey, younger generations are more likely to accept being
photographed by a smartphone than older ones. Also, the study indicated that the patients wish
that the doctor, themselves, photograph them over a "non" healthcare personal or medical
photographer (Nair et al., 2018).

Past research has been done on the quality of the images from smartphone cameras related to
a DSLR camera. Psychophysics testing was done with three different smartphones and a DSLR
camera with a non-clinical series of images. In conclusion, the audience preferred the
smartphone images over the DSLR images (Boissin et al., 2015). Pulling from this study, this
project will show a comparison using image quality metrics and clinical imaging to see the
differences between the devices.

 3
Project Results
In figure 1, the thicker lines are the spectral reflectance data of patch 1 and patch 2 on the Color
Checker. These patches represent dark skin and light skin. Spectral reflectance of the human
skin samples was collected on a Color-Eye 7000. As can be seen in Figure 1, the dark and light
skin patches on the Color Checker follow the different skin tones measured. This indicates that
examining these two patches for color shifts between the devices will provide a good measure
of color reproduction.

 Skin Sample and Patch 1 & 2
 0.7

 Patch #1 (Dark Skin)

 0.6 Patch #2 (Light Skin)

 Dark Skin

 Light Skin 1 (cool tone)
 0.5
 Light Skin 2 (warmer tone)

 0.4
 Reflectance

 0.3

 0.2

 0.1

 0
 350 400 450 500 550 600 650 700 750
 Wavelength

 Figure 1 - Graph of the Spectral Data

Collecting the data about color reproduction across all the devices showed that they reproduce
color poorly, some more than others. The Delta E00 values for patch 1, 2, 19, and 22 show how
the devices reproduce color. Patches 1 and 2 represent dark skin and light skin, so those were
the patches focused on for this project. Using the Delta E helps give a metric to help humans
identify the color difference. The Delta E00 was used due to being the most accurate version of
the color difference algorithm. It helps eliminate the light factors that the other Delta equations
do not account for. Delta E00 values over 1 are considered perceptible by human viewers. As
seen in Table 1, the Delta E00 values were over 1 for all devices, which notes that colors appear
to be different to the human viewers. The Nikon D600 had the lowest Delta E00 values compared
to the smartphones. There was a significant color variance between the Apple phones and the
Samsung phone for patch 1. That shows that the cameras have a difficult time with darker skin
tones than patch 2 where it had similar Delta E00 values for light skin tones.

 4
Table 1 - Delta E 2000 data for tested devices

 Delta E 2000
 Nikon D600 Note 4 iPhone 11 iPhone SE
 Patch #1 1.75 8.44 19.49 12.58
 Patch #2 2.95 10.57 10.26 10.07
 Patch #19 3.41 4.22 2.09 1.45
 Patch #22 1.63 7.11 11.81 8.72

The three smartphone devices had a large percentage of over-sharpening compared to the
DSLR camera that had so little sharpening that it was under. Both the Apple iPhones had over-
sharpening of at least 21%, with an overshoot of 20% the iPhone 11 Pro and 15.8% the iPhone
SE. Having overshoot is not desirable because it may lead to clipping and produces sharpness
that the photograph may not need. Overshoot can also create artifacts that are not present in
the image by over sharpening. The Samsung Note 4, had a lower overshoot of 6.10% and an
overshoot of 21%. The DSLR's case was under-sharpened by 26.3% and had an overshoot of
0.40%. This data shows that the smartphone cameras seem to have a post-processing
algorithm in their output of images. The DSLR images were converted to a jpeg.

Table 2 - Overshoot and Undershoot in the tested devices

 Overshoot/Undershoot
 Nikon D 600 Note 4 iPhone 11 iPhone SE
 Overshoot 0.40% 6.10% 20.10% 15.80%
 Undershoot 1.10% 4.70% 4.70% 5.00%
 Under/Over Under: Over: Over: Over:
 Sharpening 26.3% 21.2% 21.1% 22.1%

MTF stands for Modulation Transfer Function, which is a measure the resolution of the different
devices. The data was collected from a section of the edges on the resolution chart test target.
The data collected showed that the MTF for the smartphone devices has poor resolution. The
cellphones had about three times the amount of MTF compared to the Nikon DSLR. According
to the data collected, the iPhone 11 had the poorest MTF overall devices tested.

Table 3 - MTF of the tested devices

 MTF (cy/pxl)
 Nikon D 600 Note 4 iPhone 11 iPhone SE
 MTF 30 0.176 0.483 0.477 0.496
 MTF 50 0.126 0.366 0.374 0.387

 5
Figure 2 - MTF Graphs of the 4 Devices

 The signal-to-noise ratio (SNR) results revealed that all the devices have decent noise
 reduction. The noise was examined in the midtones and the shadows. The excess of noise will
 mask out some of the details that are there originally. The higher the number, the better the
 noise looks. The iPhone 11 has the best SNR values out of all the devices. The Nikon D600
 image had a slight bit of noise due to the need to convert it to a jpeg which was a form of
 processing. Only so much performance can come from the micro pixels in phones compared to
 a camera with larger pixels. The SNR in the smartphones tested are artificially low, due to the
 post processing.

 The signal to noise ratio was calculated from Equation 1,

 = 20 ∗ + 7 (1)

 Where SNR is signal to noise ratio, mean and standard deviation is taken from the image’s
 photoshop data.

 Table 4 - Signal to Noise Ratio in the tested devices

 SNR
 Nikon D600 Note 4 iPhone 11 iPhone SE
 Patch #19 38.39 33.97 41.18 36.73
 Patch #22 35.18 28.95 32.24 38.32

 6
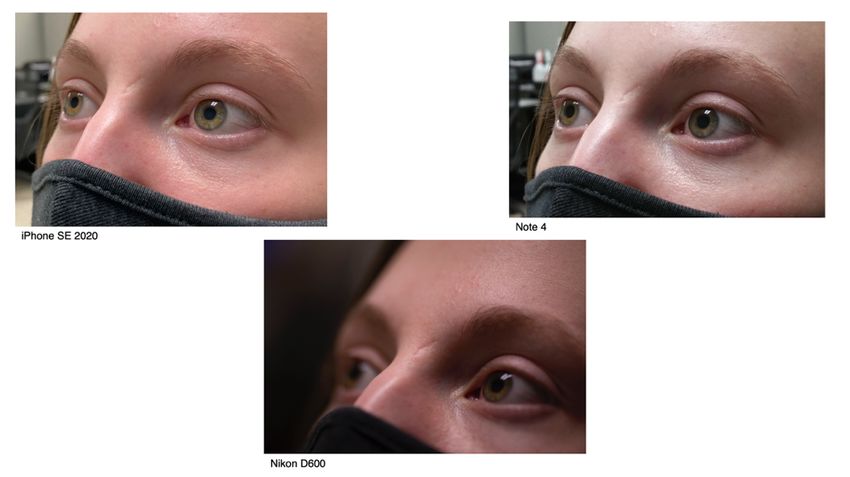
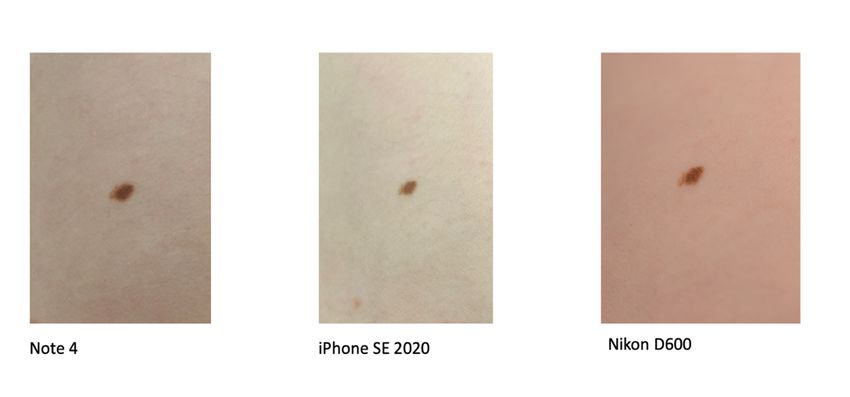
Discussion
These project results show that a DSLR camera is superior to smartphone cameras. The DSLR
camera outperformed the smartphone cameras in the majority of the tests. The DSLR camera
did the best in the testing of color reproduction and sharpness. Through the images of the
human subject's skin imperfections, it displayed the data that has been collected quantitatively.

 Figure 3 - Dark Skin Tone: Scar

 Figure 4 - Light Skin Tone: Mole

 Figure 5 - Light Skin Tone: Scar

 7
There was a huge color difference in the smartphone cameras for skin tone color reproduction.
The color difference is crucial to note because, as seen in Figures 3, 4, and 5, it alters how one
would view the image. In Figure 3, the greenish and yellowish cast appears in the Note 4 image
and is not in the Nikon image. The iPhone SE image gives the skin an ashy look. In Figure 4,
both the mole and the skin tone vary in color between the devices. The Nikon gave the subject a
reddish skin tone but the iPhone SE the skin tone has a greenish undertone. For this specific
image, the Note 4 reproduced the skin tone and mole color the best out of the three devices. For
the Nikon image, the camera may not have been set to the correct white balance for the
environment the photo was shot in. In Figure 5, in the Note 4 the subject looks sickly pale, which
is not close to their natural skin tone. The iPhone gives this subject quite a reddish undertone to
their face. These color differences are important to note because poor color reproduction can
lead to a misdiagnosis or inaccurate tracking of skin issues.

The Imatest test of edge detection calculated the MTF and the amount of sharpening in the
images. There was over-sharpening in the smartphone cameras and not in the DSLR camera.
Figure 3 exhibits how much over-sharpening is done on smartphones. In both the iPhone and
Note 4, the subject's skin has been enhanced, and now a texture on the skin is seen. In Figure
5, there is sharpening that is seen throughout the image. Unlike using a DSLR camera with a
lens where the focus can be pinpointed, the smartphone camera takes in the whole scene. In
this set of images, the subject's eyes and undereye area are heavily sharpened on both
smartphone devices. Over-sharpening can cause artifacts to appear in the photographs, leading
dermatologists to misread them.

When testing the noise, the iPhone 11 Pro had better SNR for the mid-tones patch over the
Nikon D600 see Table 4. The higher the SNR in a device, signifies less noise in an image. An
Apple source said that Apple phone cameras have algorithms that take multiple images to
average to create one image. However, even though the noise may be lower, the Apple image
processing over sharpens their pictures. Smartphones will take the averages of multiple frames
to average out the noise. This could remove details that are needed for proper diagnosis or
tracking of skin concerns.

Overall, this project addressed the problem statement. From the results, it shows that
smartphone cameras are not up to the same quality as a DSLR camera. Only using smartphone
cameras can cause issues in looking at skin tones and tracking skin issues. Further research
may figure out the best way to collect consistent images with a smartphone camera that have
accurate color reproduction and no over sharpening.

 8
Conclusion and Future Work
This project examined those differences significant for dermatologists to know about because it
shows that a DSLR camera is still superior to smartphones. Using just smartphones may lead to
a misdiagnosis or inaccurate tracking because of the inaccuracies that the smartphone cameras
introduce.

However, dermatologists are already utilizing smartphone cameras in their practices. Giving
them these conclusions about the smartphone cameras will help them analyze the images they
take. A couple of ways to help mitigate color shift and sharpness are to have a tripod with a
smartphone attachment and a small ring light attachment. Using a tripod will help with the MTF
data because the lack of camera shake will help with the need to over sharpen the images. The
small ring light may help with the color shifts caused by the cameras and lighting situations.

The logical next step to continue this project would entail finding the best smartphone to use in
this practice and testing the use of a tripod and ring light attachment.

Acknowledgements
Thank you to Nanette Salvaggio for her insights on the subject matter and guiding me through
the process of this project. Christye Sisson for her guidance through the course of this past
school year. Thank you to the models who helped capture the data for this project. To the fellow
students in Capstone 2020-2021 for all the feedback given throughout the school year.

 9
References
Abbott, L. M., Magnusson, R. S., Gibbs, E., & Smith, S. D. (2017). Smartphone use in
 dermatology for clinical photography and consultation: Current practice and the law.
 Australasian Journal of Dermatology, 59(2), 101-107. https://doi.org/10.1111/ajd.12583

Allen, E., Attridge, G. G., & Triantaphillidou, S. (2011). The manual of photography (10th ed.).
 Elsevier.

Bhattacharya S. (2014). Clinical photography and our responsibilities. Indian journal of plastic
 surgery : official publication of the Association of Plastic Surgeons of India, 47(3), 277–
 280. https://doi.org/10.4103/0970-0358.146569

Boissin, C., Fleming, J., Wallis, L., Hasselberg, M., & Laflamme, L. (2015). Can We Trust the
 Use of Smartphone Cameras in Clinical Practice? Laypeople Assessment of Their Image
 Quality. Telemedicine and E-Health, 21(11), 887-892.
 https://doi.org/10.1089/tmj.2014.0221

Dermatology. (n.d.). Wikipedia. Retrieved October 28, 2020, from
 https://en.wikipedia.org/wiki/Dermatology#Etymology

Haslam, K. (2018, April 25). How to choose the best camera phone: sensor size vs megapixels.
 Macworld from IDG. Retrieved October, 2020, from https://www.macworld.co.uk/how-
 to/best-camera-phone-megapixels-3502115/

Mohammadi, P., Ebrahimi-Moghadam, A., & Shirani, S. (2014, June 28). Subjective and
 Objective Quality Assessment of Image: A Survey. Retrieved October, 2020, from
 https://arxiv.org/pdf/1406.7799.pdf

Nair, A. G., Potdar, N. A., Dadia, S., Aulakh, S., Ali, M. J., & Shinde, C. A. (2018). Patient
 perceptions regarding the use of smart devices for medical photography: Results of a
 patient-based survey. International Ophthalmology, 39(4), 783-789.
 https://doi.org/10.1007/s10792-018-0878-2

The SFRplus chart: description and how to photograph it. (n.d.). Imatest.
 https://www.imatest.com/docs/sfrplus_instructions/

Soriano, L.F., Jolliffe, V., & Sahota, A. (2017). Smartphones in the dermatology department:
 Acceptable to patients? British Journal of Dermatology, 177(6), 1754-1757.
 https://doi.org/10.1111/bjd.15492

 10
You can also read