IMAGING THE PATHOPHYSIOLOGY OF ESSENTIAL TREMOR-A SYSTEMATIC REVIEW - JUSER
←
→
Page content transcription
If your browser does not render page correctly, please read the page content below
SYSTEMATIC REVIEW
                                                                                                                                             published: 16 June 2021
                                                                                                                                     doi: 10.3389/fneur.2021.680254

                                               Imaging the Pathophysiology of
                                               Essential Tremor—A Systematic
                                               Review
                                               Florian Holtbernd 1,2,3* and N. Jon Shah 1,2,3
                                               1
                                                Institute of Neuroscience and Medicine (INM-4/INM-11), Forschungszentrum Juelich GmbH, Juelich, Germany,
                                               2
                                                JARA-BRAIN Institute Molecular Neuroscience and Neuroimaging, Forschungszentrum Juelich GmbH,
                                               Rheinisch-Westfaelische Technische Hochschule Aachen University, Aachen, Germany, 3 Department of Neurology,
                                               Rheinisch-Westfaelische Technische Hochschule Aachen University, Aachen, Germany

                                               Background: The pathophysiology underlying essential tremor (ET) still is poorly
                                               understood. Recent research suggests a pivotal role of the cerebellum in tremor
                                               genesis, and an ongoing controversy remains as to whether ET constitutes a
                                               neurodegenerative disorder. In addition, mounting evidence indicates that alterations
                                               in the gamma-aminobutyric acid neurotransmitter system are involved in ET
                                               pathophysiology. Here, we systematically review structural, functional, and metabolic
                           Edited by:          neuroimaging studies and discuss current concepts of ET pathophysiology from an
                   Julián Benito León,         imaging perspective.
University Hospital October 12, Spain

                       Reviewed by:
                                               Methods: We conducted a PubMed and Scopus search from 1966 up to December
                   Alexandre Gironell,         2020, entering essential tremor in combination with any of the following search terms and
     Hospital de la Santa Creu i Sant
                                               their corresponding abbreviations: positron emission tomography (PET), single-photon
                          Pau, Spain
              Benito de Celis Alonso,          emission computed tomography (SPECT), magnetic resonance imaging (MRI), magnetic
Meritorious Autonomous University of           resonance spectroscopy (MRS), and gamma-aminobutyric acid (GABA).
                      Puebla, Mexico
                  *Correspondence:
                                               Results:        Altered    functional       connectivity    in     the   cerebellum     and
                     Florian Holtbernd         cerebello-thalamico-cortical circuitry is a prevalent finding in functional imaging studies.
             fholtbernd@ukaachen.de
                                               Reports from structural imaging studies are less consistent, and there is no clear
                    Specialty section:
                                               evidence for cerebellar neurodegeneration. However, diffusion tensor imaging robustly
          This article was submitted to        points toward microstructural cerebellar changes. Radiotracer imaging suggests that
                  Movement Disorders,          the dopaminergic axis is largely preserved in ET. Similarly, measurements of nigral
                a section of the journal
                 Frontiers in Neurology        iron content and neuromelanin are unremarkable in most studies; this is in contrast to
           Received: 13 March 2021             Parkinson’s disease (PD). PET and MRS studies provide limited evidence for cerebellar
            Accepted: 04 May 2021              and thalamic GABAergic dysfunction.
           Published: 16 June 2021
                                               Conclusions: There is robust evidence indicating that the cerebellum plays a
                             Citation:
     Holtbernd F and Shah NJ (2021)            key role within a multiple oscillator tremor network which underlies tremor genesis.
      Imaging the Pathophysiology of           However, whether cerebellar dysfunction relies on a neurodegenerative process remains
      Essential Tremor—A Systematic
    Review. Front. Neurol. 12:680254.
                                               unclear. Dopaminergic and iron imaging do not suggest a substantial overlap of ET
     doi: 10.3389/fneur.2021.680254            with PD pathophysiology. There is limited evidence for alterations of the GABAergic

Frontiers in Neurology | www.frontiersin.org                                        1                                          June 2021 | Volume 12 | Article 680254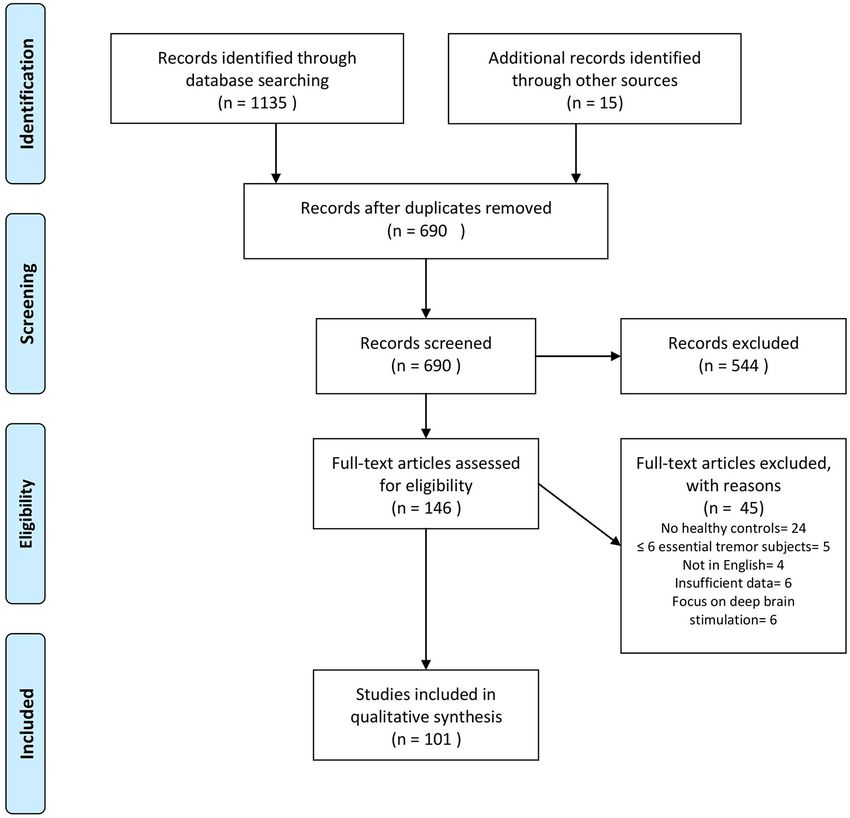
Holtbernd and Shah                                                                                                                                Imaging ET

                                               neurotransmitter system in ET. The clinical, demographical, and genetic heterogeneity of
                                               ET translates into neuroimaging and likely explains the various inconsistencies reported.

                                               Keywords: essential tremor, pathophysiology, magnetic resonance imaging (MRI), tremor network, PET, SPECT,
                                               gamma-aminobutyric acid

INTRODUCTION                                                                        vivo. Furthermore, studies exploring the dopaminergic system
                                                                                    and cerebral iron depositions have tried to establish a connection
Essential tremor (ET) is among the most common movement                             between ET and progressive neurodegeneration, particularly with
disorders in adulthood. Its prevalence in the general population                    PD, providing equivocal findings (14). Here, we systematically
is estimated at ∼0.5% (1). ET can manifest at any age, but there                    review the advances in structural, functional, and metabolic
is a strong association with older age, as demonstrated by a much                   imaging and discuss pathophysiological concepts underlying ET
higher prevalence (4–5%) in people aged >65 years (2). ET can                       based on evidence from neuroimaging.
manifest sporadically, but 30–70% of ET cases have a positive
family history, suggesting the disease has a genetic background
(3). Familial cases usually show early disease manifestation in the                 METHODS
first two to four decades (4). The clinical hallmark of ET is a
                                                                                    We conducted a PubMed and Scopus search, including
symmetric action tremor of the upper limbs (5). However, tremor
                                                                                    publications from 1966 up to December 2020, entering
may spread to other regions, such as the head, tongue, torso, jaw,
                                                                                    “essential tremor” in combination (“AND”) with any of the
and legs or can manifest as voice tremor. In some patients, signs
                                                                                    following terms and their corresponding abbreviations: positron
of cerebellar impairment, such as subtle oculomotor disturbances
                                                                                    emission tomography (PET), single-photon emission computed
and gait ataxia are present. Cognitive impairment and psychiatric
                                                                                    tomography (SPECT), magnetic resonance imaging (MRI),
symptoms, such as depression also can occur in ET patients
                                                                                    magnetic resonance spectroscopy (MRS), gamma-aminobutyric,
(4). The term “essential tremor plus” has been coined for ET
                                                                                    and γ-aminobutyric acid (GABA). In addition, we browsed the
cases presenting with these additional symptoms (5). Given the
                                                                                    reference lists of original and review articles retrieved in this
heterogeneity of clinical manifestation, the variable hereditary
                                                                                    primary search. We only considered articles that were (1) written
background, and wide range of age at onset, it is likely that ET
                                                                                    in English, (2) included >5 ET subjects, (3) directly compared
does not constitute a single disease entity, but rather a disease
                                                                                    ET subjects with a healthy control (HC) cohort, (4) were
spectrum (4).
                                                                                    performed on human subjects, and (5) provided quantitative
    Despite its high prevalence, the neuronal mechanisms
                                                                                    or semiquantitative data analyses. We did not consider case
underpinning ET are still not fully understood. Originally,
                                                                                    reports, case series, or research papers that primarily focused
the inferior olive nucleus (ION) had been considered the
                                                                                    on therapeutic interventions, such as thalamotomy, MRI-
central oscillator of tremor genesis in ET (6); however, this
                                                                                    guided focused ultrasound, or deep brain stimulation (DBS).
hypothesis has since been disputed, and a multiple oscillator
                                                                                    If ET patients were additionally compared with other disease
tremor network comprising the ION, brainstem, cerebellum,
                                                                                    groups (e.g., dystonic tremor), we solely considered comparisons
thalamus, and motor cortical areas has been indicated in tremor
                                                                                    with HC. We followed the PRISMA guidelines for systematic
genesis (7). Moreover, a series of histopathological studies
                                                                                    reviews (20).
reporting a loss and morphological alterations of cerebellar
                                                                                        We sought to address the following questions: (1) does
Purkinje cells gave rise to the hypothesis that cerebellar
                                                                                    evidence from neuroimaging support the hypothesis of cerebellar
neurodegeneration may be the primary cause of ET (8–10).
                                                                                    neurodegeneration in ET? (2) Do findings from neuroimaging
However, this concept has been challenged by others (11,
                                                                                    corroborate with the postulated concept of a tremor network?
12). In addition, there is mounting evidence that alterations
                                                                                    (3) Is there support from neuroimaging for alterations of
in the integrity of the inhibitory gamma-aminobutyric acid
                                                                                    the GABAergic system in ET? (4) Is there evidence from
(GABA) neurotransmitter system is a contributory factor in ET
                                                                                    neuroimaging for striatal dopaminergic degradation and nigral
pathophysiology (13). Lastly, particularly in the early course of
                                                                                    iron accumulation in ET as typically observed in PD?
the disease, clinical differentiation of ET from Parkinson’s disease
(PD) can be challenging, and some authors have suggested
common pathophysiological features of the two diseases (14).                        RESULTS
    In recent decades, a substantial number of imaging techniques
have emerged that enable the assessment of structural, functional,                  Our search revealed 1,135 hits. References retrieved were
and metabolic alterations of the ET brain in a non-invasive                         imported into a reference manager (Endnote X8), and duplicates
and easily accessible way, resulting in a large body of literature.                 were removed. FH screened all titles and abstracts for eligibility.
Whereas some findings corroborate with current concepts of                          A total of 86 papers met our inclusion criteria. Fifteen additional
ET pathophysiology (15–17), others do not (18, 19). More                            abstracts were identified by browsing the reference lists of
recently, novel techniques have been established to assess distinct                 papers retrieved in the database search. The senior author (JS)
neurotransmitter systems and their role in tremor genesis in                        cross-checked papers selected for qualitative data synthesis for

Frontiers in Neurology | www.frontiersin.org                                    2                                      June 2021 | Volume 12 | Article 680254
Holtbernd and Shah Imaging ET
FIGURE 1 | Flowchart depicting the study selection process. Search was performed in PubMed and Scopus up to December 2020. Modified from Moher et al. (20).
eligibility. A flowchart of the selection process is presented in applied to quantitatively measure brain volumes, e.g., the
Figure 1. Thirty-one studies were assigned to volumetric MRI, 19 cortical thickness, using freely available software, such as
to diffusion tensor imaging (DTI), 26 to functional MRI (fMRI), FreeSurfer (118).
six to MRS, six to imaging of brain iron, three to GABAergic Cerebellar atrophy is commonly reported in ET patients (15,
imaging, 17 to dopaminergic imaging, seven to perfusion imaging 22, 26, 28–32, 36, 37, 43, 46, 48). However, an equivocal number
(PET or SPECT), and five to metabolic radiotracer imaging. of studies found no morphological cerebellar changes (18, 21,
Some studies applied more than one modality and were assigned 25, 33–35, 38–42, 49), and even increased cerebellar gray matter
to different categories accordingly. A summary of all studies volume in young ET subjects has been reported (27, 45). Findings
included is presented in Table 1 (MRI and GABAergic imaging) of cerebral cortical and subcortical structural changes are even
and Table 2 (radiotracer imaging). more heterogeneous. There is no consistent pattern of atrophy.
Moreover, alongside volume loss, gray matter volume gain has
Structural Magnetic Resonance Imaging been observed in various cortical regions, and some studies did
A number of imaging techniques have been applied to visualize not identify any cortical differences between ET patients and HC
the brain morphology of ET patients in vivo. (15, 22, 23, 26, 33–36, 38, 41, 44, 45, 47). Of note, the clinical
phenotype of ET is associated with distinct morphological brain
Volumetric Imaging changes. For example, ET patients presenting with additional
Voxel-based morphometry (VBM) allows for a voxel-based head tremor display more pronounced or distinct patterns of
automated and rater-independent analysis of brain volumes cerebellar atrophy, as well as various cortical structural changes
between groups, either in specified regions-of-interest (ROI) compared with classic ET (25, 26, 28, 30, 31, 46). Indeed, some of
or at a whole-brain level without a priori hypotheses (117). the studies reporting cerebellar atrophy found significant volume
Alternatively, automated segmentation methods can be loss only in ET individuals exhibiting additional head or voice
Frontiers in Neurology | www.frontiersin.org 3 June 2021 | Volume 12 | Article 680254Holtbernd and Shah Imaging ET
TABLE 1 | Summary of MRI and GABAergic imaging studies.
References Subjects (f) Age (mean ± SD) Main findings
Volumetric MRI
Archer et al. (21) ET 19 (12) 65.74 ± 11.56 No difference
HC 18 (10) 63.66 ± 7.58
Bagepally et al. (22) ET 20 (5) 38.2 ± 16.5 GM of CER, frontal, occipital, L temporal, and R parietal regions ↓
HC 17 (3) 40.7 ± 16.5
Benito-Leon et al. (15) ET 19 (10) 69.8 ± 9.4 WM of R CER, L medulla, R parietal lobe, and R limbic lobe; and GM of bilateral CER,
HC 20 (10) 68.9 ± 10.0 bilateral parietal lobes, R frontal lobe, and R insula ↓
No difference between hET and clET
Benito-Leon et al. (23) 13 (7) 67.8 ± 7.3 GM (cortical thickness or volume) of both thalami, L PMC/SC, L temporal lobe, L
17 (7) 64.1 ± 11.9 occipital, L cingulate, bilateral entorhinal and ventral areas ↓
CER not assessed
Bhalsing et al. (24) ET 25 (6) 45.0 ± 10.7 GM of CER, R medial frontal gyrus in cognitively impaired ET patients ↓
HC 25 (6) 45.4 ± 10.7 GM of bilateral medial frontal gyrus, R SC, anterior cingulate and insula ↓ in
cognitively impaired compared with cognitively intact ET group
Buijink et al. (25) ET 36 (13) 56 ± 14 No difference
HC 30 (11) 54 ± 15 GM in bilateral PMC and SC, and L superior medial gyrus ↑ in hET compared
with clET
Cameron et al. (26) ET 47 (23) 76.0 ± 6.8 GM of CER, posterior insula, superior temporal gyri, cingulate cortex, inferior frontal
HC 36 (26) 73.3 ± 6.5 gyri, and parieto-occipital regions ↓
Pronounced atrophy in the hET subgroup
Cao et al. (27) ET 17 (9) 39.65 ± 8.12 GM of bilateral CER, occipital fusiform cortices, R inferior temporal gyrus, PMC,
HC 17 (10) 42.24 ± 9.47 thalamus, midbrain, precuneus ↑
GM of L parietal lobe ↓
Cerasa et al. (28) clET 27 (10) 65 ± 12.8 GM and WM of CER ↓ in hET only
hET 19 (13) 70.7 ± 7.8
HC 28 (14) 66.5 ± 7.8
Cerasa et al. (29) ET 14 (6) 66.3 ± 9.1 GM of CER in anterior lobe ↓
HC 23 (10) 64.4 ± 7.1 No difference in cerebral cortical thickness
Choi et al. (30) ET 45 (13) 65.9 ± 6.8 CER GM and WM ↓ in hET only
HC 45 (13) 67.6 ± 7.4
Daniels et al. (18) ET 27 (9) 57.9 ± 12.2 No difference
HC 27 (9) n.a.b
Dyke et al. (31) ET 47 (23) 76.0 ± 6.8 GM of CER ↓ in hET and ET with voice tremor only
HC 36 (26) 73.2 ± 6.7
Espay et al. (32) ET 16 (5)a 61.7 ± 9.3 GM of L CER, and occipital cortex ↓
HC 25 (21) 48.6 ± 11.4 GM of R amygdala ↑
Fang et al. (33) ET 20 (8) 50.3 ± 14.2 No difference
HC 20 (8) 50.3 ± 14.2
Fang et al. (34) ET 35 (13) 46.86 ± 11.3 No difference
HC 35 (13) 44.46 ± 11.7
Fang et al. (35) ET 26 (7) 47.3 ± 11.3 No difference
HC 26 (7) 43.4 ± 14.4
Galazzo et al. (36) ET 10 (4) 69.4 ± 8.9 GM of CER and R occipital cortex ↓
HC 10 (5) 67.7 ± 7.8
Gallea et al. (37) ET 19 (7) 50.4 ± 15.0 GM of CER ↓
HC 19 (7) 50.1 ± 16.4 GM of SMA ↑
Klein et al. (38) ET 14 (5) 61.2 ± 12.0 No difference
HC 20 (n.a.) 60.2 ± 8.1
Lin et al. (39) ET 10 (5) 63.4 ± 8.71 GM of caudate, L temporal cortex, insular cortex, L precuneus, superior temporal
HC 13 (4) 65.31 ± 11.09 gyrus ↓
No difference in cerebellar volume
Nicoletti et al. (40) ET 32 (15) 69.7 ± 9.7 No difference
HC 12 (8) 67.4 ± 4.8
Novellino et al. (49) ET 60 (32) 67.11 ± 7.84 No difference in CER, thalamus, hippocampus, frontal lobe
HC 50 (25) 67.58 ± 6.14
Pelzer et al. (41) ET 19 (9) 49.47 ± 3.51 GM precuneus ↑
HC 23 (8) 50.93 ± 3.33 No difference in cerebellar volume
(Continued)
Frontiers in Neurology | www.frontiersin.org 4 June 2021 | Volume 12 | Article 680254Holtbernd and Shah Imaging ET
TABLE 1 | Continued
References Subjects (f) Age (mean ± SD) Main findings
Pietracupa et al. (42) ET 19 (9) 67.00 ± 17.80 Thalamic volume ↑
HC 15 (8) 63.00 ± 9.00 No difference in cerebral cortical thickness or cerebellar volume
Prasad et al. (43) ET 40 (13) 44.95 ± 12.46 Cerebellar GM and volume of MCP/ICP ↓, pronounced atrophy in ET with clinical
HC 37 (10) 46.45 ± 9.93 cerebellar signs
No difference in WM in CER
Prasad et al. (44) ET 40 (12) 44.95 ± 12.46 GM in bilateral thalamus, hippocampus, midbrain ↓
HC 40 (10) 46.30 ± 9.39 GM in R caudate nucleus, pallidum, amygdala, bilateral putamen, nucleus
accumbens ↑
CER not assessed
No difference between familial vs. sporadic or between clET and rET
Qi et al. (45) ET 27 (13) 39.65 ± 8.12 GM of bilateral CER, L temporal occipital fusiform gyrus, precentral lobe, R occipital
HC 27 (12) 42.24 ± 9.47 fusiform gyrus, R inferior temporal gyrus, L thalamus, midbrain, medulla, bilateral
precuneus ↑
GM of L parietal lobe, pons, L insula ↓
Quattrone et al. (46) clET 30 (12) 61.5 ± 16.5 GM of cerebellar anterior lobe, vermis, paravermal ↓ in hET only
hET 20 (14) 70.6 ± 7.6c No difference between hET and clET
HC 32 (16) 66.2 ± 8.1
Serrano et al. (47) ET 18 (8) 63.7 ± 10.5 GM (cortical thickness or volume) in precentral, temporal, orbitofrontal,
HC 18 (9) 63.3 ± 12.0 (para)hippocampal, entorhinal, posterior cingulate, and supramarginal regions ↓
CER not assessed
Shin et al. (48) ET 39 (16) 63.7 ± 13.0 GM cerebellar vermis ↓, more pronounced in clET
HC 36 (17) 65.3 ± 6.8
Diffusion tensor imaging
Archer et al. (21) ET 19 (12) 65.74 ± 11.56 No difference in FA, MD not assessed
HC 18 (10) 63.66 ± 7.58
Bhalsing et al. (50) ciET 33 (m:f 1:2.8) 47.03 ± 10.4 No difference in MD or FA between clET and HC
clET 22 (m:f 1:2.5) 43.4 ± 13.4 MD in R cingulum and L precuneus ↑ in ciET
HC 55 (m:f 1:2.5) 46 ± 11 No difference between clET and ciET
Caligiuri et al. (51) clET 25 (14) 64.7 ± 10.9 Structural connectivity of thalamo-cerebello and thalamo-cortical tracts ↓ in rET and
rET 22 (11) 63.7 ± 13.5 clET
HC 25 (11) 65.1 ± 6.7 Structural connectivity in basal ganglia–cortical tracts ↓ in rET only
Gallea et al. (37) ET 19 (7) 50.4 ± 15.0 FA in CST ↑, no difference in tremor network-related connections
HC 19 (7) 50.1 ± 16.4
Jia et al. (52) ET 15 (5) 65.07 ± 11.41 MD in red nuclei ↑, no difference in FA
HC 15 (n.a.) 62.07 ± 7.60 CER not assessed
Klein et al. (38) ET 14 (5) 61.2 ± 12.0 MD in bilateral fronto-parietal and L temporo-occipital WM, and ICP ↑
HC 20 (n.a.) 60.2 ± 8.1 FA in R ICP ↓
Martinelli et al. (19) ET 10 (8) 66 ± 11 No difference in MD, FA not measured
HC 10 (n.a.) 60 ± 8
Nestrasil et al. (53) ET 12 (4) 45.5 ± 17.5 MD in forceps minor and major, R
HC 10 (4) 46.6 ± 14.8 CST, R inferior fronto-occipital fasciculi, R superior longitudinal fasciclus, R inferior
longitudinal fasciculus, bilateral uncinate fasciculi, cingulum bundles, bilateral anterior
thalamic radiation ↑
No FA assessment
Nicoletti et al. (54) ET 25 (13) 62.9 ± 69.5 FA in DN and SCP ↓
HC 15 (8) 62.47 ± 5.4 MD in SCP ↑
Novellino et al. (55) ET 67 (29) 65.64 ± 10.48 MD of GM in CER ↑ in ET and rET, but no difference between clET only and HC
HC 39 (18) 64.56 ± 9.4
Novellino et al. (49) ET 60 (32) 67.11 ± 7.84 MD in bilateral hippocampus, and cerebellar GM ↑
HC 50 (25) 67.58 ± 6.14
Pak et al. (56) ET 40 (28) 44.23 ± 18.91 FA in inferior longitudinal fasciculus, corpus callosum ↓
HC 40 (20) 37.45 ± 10.95 MD in inferior/superior longitudinal fasciculus, genu and corpus callosum ↑
CER not assessed
Pelzer et al. (41) ET 19 (9) 49.47 ± 3.51 MD in widespread WM including tremor network correlated with clinical tremor
HC 23 (8) 50.93 ± 3.33 severity
Positive correlation of callosal FA with verbal fluency test
Pietracupa et al. (42) ET 19 (9) 67.00 ± 17.80 FA ↓ and MD ↑ in multiple motor and non-motor tracts including MCP, SCP, CST,
HC 15 (8) 63.00 ± 9.00 anterior thalamic radiation, longitudinal fasciculus, and inferior fronto-occipital
fasciculus
(Continued)
Frontiers in Neurology | www.frontiersin.org 5 June 2021 | Volume 12 | Article 680254Holtbernd and Shah Imaging ET
TABLE 1 | Continued
References Subjects (f) Age (mean ± SD) Main findings
Prasad et al. (57) ET 40 (12) 44.95 ± 12.46 FA in corpus callosum and CST in rET ↓
HC 40 (10) 46.30 ± 9.39 MD in CER ↑ in overall ET cohort and rET
No differences of FA or MD between rET and clET
Revuelta et al. (58) ET 18 (8) 71.1 ± 8.8 MD in Vim-PMC, Vim-SMA, Vim-pre-SMA tract ↓
HC 10 (7) 69.4 ± 9.0 No difference in FA
CER not assessed
Saini et al. (59) ET 22 (5)d 38.2 ± 16.5 Tract-based spatial statistics whole brain: no difference in FA; MD in R internal and
HC 17 (3) 40.7 ± 16.5 external capsule, and R parietal WM ↑
No difference in CER
ROI based: FA in L SCP and R CST ↓
MD in right internal capsule, and left CST ↑
Shin et al. (60) ET 10 (5) 52.8 ± 11.5 FA of WM in R pons, bilateral cerebellum, L retrorubral area of the midbrain,
HC 8 (5) 51.3 ± 11.1 orbitofrontal, lateral frontal, parietal, and temporal WM ↓
Tikoo et al. (61) ET 25 (11) 68.4 ± 9.7 FA ↓ and MD ↑ in cerebellar peduncles
HC 26 (17) 63.2 ± 10.3
Functional MRI (task-based)
Archer et al. (21) ET 19 (12) 65.74 ± 11.56 Complex changes of activity in the tremor and visual networks during a motor task
HC 18 (10) 63.66 ± 7.58 that could be modulated by increased visual feedback
Broersma et al. (62) ET 21 (9) 51.6 ± 17.8 Tremor-associated activity in L/R cerebellum, and brainstem ↑ compared with
HC 21 (7) 50.6 ± 16.4 mimicked tremor in HC
Bucher et al. (16) ET 12 (4) 61.1 ± 11.9 Bilateral activation of the cerebellar hemispheres, DN, and red nuclei, and unilateral
HC 15 (7) 58.2 ± 9.8 activation of the contralateral PMC/SC, thalamus, and globus pallidus in ET during
involuntary tremor
Higher activation of cerebellar hemispheres and red nuclei during involuntary tremor in
ET compared with mimicked tremor in HC
Buijink et al. (63) ET 31 (10) 55.4 ± 15.8 Activity in CER, parietal and frontal cortex, DN and ION ↓ during motor task
HC 29 (9) 52.6 ± 16.1
Buijink et al. (64) ET 22 (10) 59.5 ± n.a. Cerebello-motor cortical FC ↓ during motor task
HC 21 (7) 56.5 ± n.a.
Cerasa et al. (65) ET 12 (6) 62.2 ± 12.4 Activity in dorsolateral prefrontal cortex and in the inferior parietal cortex ↑ during
HC 12 (6) 59.8 ± 10.7 cognitive task
Espay et al. (32) ET 16 (5)a 61.7 ± 9.3 No difference during emotion processing and finger tapping task
HC 25 (21) 48.6 ± 11.4
Galazzo et al. (36) ET 10 (4) 69.4 ± 8.9 Activity in CER, sensory-motor cortex, and basal ganglia ↓ during motor task
HC 10 (5) 67.7 ± 7.8
Muthuraman et al. (66) ET 34 (9) 58.9 ± 9 Activity in CER associated with involuntary tremor mapped to motor cortex in ET,
HC 34 (9) 58 ± 9 whereas it mapped to premotor cortex during mimicked tremor in HC
Different topography of cerebellar activity sources in ET compared with HC
Neely et al. (67) ET 14 (8) 61.7 ± 11.0 Cerebello-cortical FC ↓
HC 14 (9) 60.2 ± 9.2 Cortico-cortical FC (PMC, SMA, premotor cortex) ↑ during motor task
Nicoletti et al. (40) ET 32 (15) 69.7 ± 9.7 Activity in CER and other nodes of the tremor network ↓ during motor task
HC 12 (8) 67.4 ± 4.8 Activity in PMC and SC, precuneus and superior parietal gyrus ↑ during motor task
Activity in widespread cortical regions, CER and internal globus pallidus ↑ during
motor task in rET compared with clET
Passamonti et al. (68) ET 15 (n.a.) 61.6 ± 9.3 FC between CER and various cortical regions implicated in focusing attention and
HC 15 (n.a.) 60.4 ± 7.3 with the DMN ↓ during cognitive task
Functional MRI (resting state)
Benito-Leon et al. (69) ET 23 (12) 63.3 ± 13.4 FC in CER and visual network ↓
HC 23 (13) 60.6 ± 13.2 FC in DMN ↑
Benito-Leon et al. (70) ET 23 (12) 63.3 ± 13.4 Graph theory-based study showing complex alterations of various parameters inside
HC 23 (13) 61.1 ± 13.1 and outside the tremor network in ET subjects
Fang et al. (33) ET 20 (8) 50.3 ± 14.2 Regional homogeneity in cerebellar lobes, bilateral thalamus, and the insular lobe ↓
HC 20 (8) 50.3 ± 14.2 Regional homogeneity in bilateral prefrontal and parietal cortices, L PMC, and L
SMA ↑
Fang et al. (34) ET 35 (13) 46.86 ± 11.3 FC in sensorimotor network, salience network, and between anterior and posterior
HC 35 (13) 44.46 ± 11.7 DMN ↑
FC in CER, and between CER and DMN and sensorimotor networks ↓
Fang et al. (35) ET 26 (7) 47.3 ± 11.3 Thalamus related FC in cerebello-thalamo-cortical network ↓
HC 26 (7) 43.4 ± 14.4 Thalamus related FC in primary and supplemental motor cortical areas ↑
(Continued)
Frontiers in Neurology | www.frontiersin.org 6 June 2021 | Volume 12 | Article 680254Holtbernd and Shah Imaging ET
TABLE 1 | Continued
References Subjects (f) Age (mean ± SD) Main findings
Gallea et al. (37) ET 19 (7) 50.4 ± 15.0 FC between cerebellar hemispheres and ipsilateral DN, and between SMA and
HC 19 (7) 50.1 ± 16.4 ipsilateral PMC ↓
Lenka et al. (71) ET 30 (11) 45.4 ± 13.7 FC of PMC and SC with R CER ↓
HC 30 (10) 43.4 ± 9.2 FC of bilateral thalamus with posterior CER ↑
Li et al. (72) rET 20 (7) 48.32 ± 13.16 Regional homogeneity in CER, putamen, and DMN ↓
HC 27 (12) 49.12 ± 11.81
Li et al. (73) rET 19 (13) 46.58 ± 14.04 Activity in basal ganglia, inferior orbitofrontal gyrus, and insula ↓, activity in R CER ↑ in
clET 31 (21) 46.29 ± 14.30 overall ET cohort
HC 25 (17) 49.88 ± 12.56 In subgroup analysis, only clET patients showed ↑ activity in the CER
Distinct differences of activity in various cortical regions and basal ganglia between
rET and clET compared with HC
Mueller et al. (74) ET 19 (4) 55.5 ± 19.2 Connectivity (eigenvector centrality) in cerebellar hemispheres ↓
HC 23 (n.a.) 50.9 ± 18.0 Connectivity in the anterior cingulate and in the PMC bilaterally ↑
Nicoletti et al. (75) ET 23 (10) 71.6 ± 10.5 Complex alterations of (sensorimotor) cortico-cortical FC showing both ↓ and ↑
HC 23 (12) 70.3 ± 5.3 Cortico-cerebello FC ↓
Thalamico-cerebellar FC ↑
Tikoo et al. (61) ET 25 (11) 68.4 ± 9.7 FC of DN with L CER cortex, L caudate, L thalamus, L PMC and SC, bilateral frontal,
HC 26 (17) 63.2 ± 10.3 and parietal cortices ↓
Wang et al. (76) hET 20 (7) 51.00 ± 12.10 Activity in CER, bilateral caudate, R middle temporal gyrus, and L inferior parietal
clET 27 (11) 45.00 ± 14.43 lobule ↑ in hET compared with HC
HC 27 (12) 45.00 ± 4.43 Activity in R putamen, L precentral gyrus, and L SC ↓ in hET compared with HC
Activity in thalamus, R middle temporal gyrus, R middle frontal gyrus, and R inferior
parietal lobule ↑ in clET compared with HC
Activity in thalamus, R middle temporal gyrus, R middle frontal gyrus, and R inferior
parietal lobule ↓ in clET compared with HC
Yin et al. (77) ET 24 (12)e 46.4 ± 14.2 Activity in cortical regions, mainly related to motor function (e.g., pre- and postcentral
HC 23 (12) 47.2 ± 12.8 gyrus, SMA) ↑
Activity in CER ↓
Magnetic resonance spectroscopy
Barbagallo et al. (78) rET 12 (6) 69.9 ± 8.3 No difference in thalamic NAA/Cr or Cho/Cr ratios
HC 10 (2) 64.1 ± 8.3
Barbagallo et al. (79) ET 16 (3) 65.5 ± 11.1 No difference in thalamic NAA/Cr or Cho/Cr ratio
HC 14 (4) 60.8 ± 10.2 Thalamic Glx and Glx/Cr ratio ↑
Kendi et al. (80) ET 14 (8) 38.64 ± 12.8 No difference in thalamic NAA/Cr and Cho/Cr ratios
HC 9 (n.a.) 35.4 ± 11.7
Louis et al. (81) ET 16 (9) 66 ± 18 Cerebellar NAA/Cr ratio ↓
HC 11 (5) 60 ± 24
Louis et al. (82) ET 20 (10) 62.2 ± 19.4 No difference in cerebellar NAA/Cr ratio
HC 11 (4) 59.6 ± 23.0 NAA/Cr asymmetry index between R/L cerebellar hemispheres ↓
Pagan et al. (83) ET 10 (n.a.) 59.4 ± 18.7 Cerebellar NAA/Cr and Cho/Cr ratios ↓
HC 10 (n.a.) 57.2 ± 17.0
Imaging of brain iron
Cheng et al. (84) ET 9 (n.a.) 63.8 ± 8.6f No difference in nigral susceptibility-weighted imaging or nigrosome-1 integrity
HC 166 (104) 63.6 ± 6.1 between ET and HC
Homayoon et al. (85) ET 25 (10) 65.80 ± 12.82 No difference in nigral R2* relaxation times between ET and HC
HC 25 (12) 64.60 ± 11
Jin et al. (86) ET 25 (15) 61.12 ± 11.16 No difference in nigral neuromelanin concentration or nigrosome-1 integrity between
HC 34 (21) 63.53 ± 7.81 ET and HC
Novellino et al. (87) ET 24 (10) 64.29 ± 10.02 Higher T2* relaxation times of bilateral globus pallidus internus, substantia nigra, and
HC 25 (12) 64.16 ± 9.26 R DN Only pallidal findings survived correction for multiple comparisons
Reimao et al. (88) ET 15 (8) 70.5 ± 12.5a No difference in nigral neuromelanin in ET compared with HC
HC 10 (4) 61.2 ± 67.3
Wang et al. (89) ET 18 (7) 62.56 ± 9.31 No difference in nigral neuromelanin in ET compared with HC
HC 21 (11) 63.52 ± 8.34
Imaging of the GABAergic system
11
Boecker et al. (90) ET 8 (4) 65.5 ± 8.0 C-flumazenil binding in CER, thalamus, and lateral premotor cortex ↑
HC 11 (6) 56.6 ± 4.3
(Continued)
Frontiers in Neurology | www.frontiersin.org 7 June 2021 | Volume 12 | Article 680254Holtbernd and Shah Imaging ET
TABLE 1 | Continued
References Subjects (f) Age (mean ± SD) Main findings
Louis et al. (91) ET 45 (19) 74.98 ± 6.16 No difference in DN GABA concentration between ET and HC
HC 35 (25)a 73.26 ± 6.06 Higher values in R compared with L DN in ET cohort, but no correlation with
tremor scores
Tapper et al. (92) ET 10 (3) 60.2 ± 9.7 No difference in thalamic or CER GABA or Glx concentrations between ET and HC
HC 6 (1) 62.2 ± 11.4 Positive correlation of GABA/Glx ratio with tremor severity
ET, essential tremor; clET, classical ET; hET, ET subjects presenting with head tremor; rET, ET subjects presenting with resting tremor; HC, healthy controls; ↓, lower compared with
HC; ↑, higher compared with HC; R, right; L, left; GM, gray matter; WM, white matter; CER, cerebellum; CST, corticospinal tract; DN, dentate nucleus; ICP, inferior cerebellar peduncle;
MCP, middle cerebellar peduncle; PMC, primary motor cortex; SC, sensory cortex; SMA, supplementary motor area; SCP, superior cerebellar peduncle; Cr, creatine; Cho, choline; FA,
fractional anisotropy; FC, functional connectivity; GABA, gamma amino-butyric acid; Glx, glutamate/glutamine; MD, mean diffusivity; NAA, N-acetylaspartate; n.a., not available.
a Groups not matched for gender and/or age.
b Age-matched, but no mean age for the cohort provided.
c hET significantly older than clET.
d Two ET subjects excluded from the final analyses because of extensive white matter lesions.
e Two subjects excluded due to excessive head motion.
f ET subjects were a subgroup of a larger cohort including atypical parkinsonian patients; no demographical data are provided for the ET group separately, but statistical analyses were
performed for the ET subgroup.
tremor (28, 30, 31, 46). Moreover, cognitive dysfunction in ET with tremor severity, suggesting a pathological reinforcement
has been linked to specific cortical atrophy patterns not apparent of this tract in ET (58). Similar to VBM studies, phenotype-
in cognitively intact ET individuals (24). The heterogeneity of specific changes of FA and MD have been reported. Specifically,
structural brain alterations reported in ET has been highlighted ET patients presenting with additional resting tremor, but
in a recent meta-analysis including 16 VBM studies and more unremarkable dopamine transporter imaging, showed reduced
than 350 ET individuals (119). The latter study did not identify structural connectivity in a network comprised of the globus
any brain regions, including the cerebellum, that exhibited pallidus, caudate nucleus, and supplemental motor area that
consistent gray matter volume loss in ET patients compared with was not apparent in ET patients without resting tremor (51).
HC (119). Moreover, distinct cortical microstructural changes, including
the hippocampi, have been linked to cognitive dysfunction (41,
Diffusion Tensor Imaging 49, 50).
DTI is utilized for the assessment of the brain’s microstructural
integrity and is particularly sensitive to alterations in cerebral Functional and Metabolic Magnetic
white matter. DTI measures the random movement of water Resonance Imaging
molecules, which is mainly directed along white matter fiber The initial model of ET tremor genesis proposed that rhythmic
tracts (120). Two important measures are the mean diffusivity discharges originating in the ION propagate tremor in ET (6).
(MD) and the fractional anisotropy (FA). The MD depicts the However, based on current research, it seems more likely that
average movement of water molecules in organic tissue, whereas tremor genesis is not governed by a single oscillator, but is
the FA refers to the directionality of movement. FA values close rather driven by a number of oscillators within a tremor network
to 1 reflect anisotropy, whereas values nearing 0 are isotropic and comprising the ION, cerebellum, thalamus, motor cortical
are suggestive of tissue damage. Conversely, high MD values are a regions, and the brainstem (7). This hypothesis is supported by
surrogate for a loss of cellular integrity and indicative of neuronal evidence from neurophysiological studies confirming abnormal
damage (121). oscillatory activity within the tremor network in ET (122).
Compared with conventional MRI, DTI studies more
consistently point toward microstructural alterations of the Functional Magnetic Resonance Imaging
cerebellum, particularly of the cerebellar peduncles and dentate fMRI measures the blood oxygen level-dependent (BOLD)
nuclei (38, 49, 54, 55, 57, 59–61). In contrast to these 11 studies, contrast—generally called “the BOLD signal” (123). The BOLD
only two studies, both employing an ROI-based approach, did signal is affected by hemodynamic, vascular, and metabolic
not find any differences in DTI between ET patients and HC factors, but is generally assumed to be closely related to
(19, 21). Beyond cerebellar changes, widespread microstructural neural activity (123, 124). The first task-based fMRI study in
alterations have been reported in various cerebral white matter ET patients identified increased activity in the contralateral
tracts related to both motor and non-motor function and in sensory and motor cortices, thalamus, and globus pallidus and
the red nuclei (37, 38, 52, 53, 56, 59). For example, in a recent bilateral overactivation of the cerebellar hemispheres and dentate
study by Revuelta et al., the authors reported decreased MD of nuclei during arm posturing. In contrast, the authors observed
fiber tracts connecting the ventral intermediate nucleus of the increased activity in the ION in only two out of 12 patients,
thalamus (Vim), the typical target for DBS in ET, with motor supporting a pivotal role of the cerebellum in tremor genesis and
and supplementary motor cortical regions (58). Even though no refuting the single oscillator ION hypothesis (16). Subsequently,
alterations of FA were observed in the same tracts, both MD numerous task-based fMRI studies have confirmed that altered
and FA in the Vim supplementary motor area tract correlated cerebellar and cerebello-thalamico-cortical activity is correlated
Frontiers in Neurology | www.frontiersin.org 8 June 2021 | Volume 12 | Article 680254Holtbernd and Shah Imaging ET
TABLE 2 | Summary of radiotracer studies.
References Subjects (f) Age (mean ± SD) Main findings
Dopaminergic imaging
Asenbaum et al. (93) ET 32 (19) 45 ± n.a.a DaTScan
HC 30 (20) 63 ± n.a. Normal striatal uptake
Barbagallo et al. (78) rET 12 (6) 69.9 ± 8.3 DaTScan
HC 10 (2) 64.1 ± 8.3 Normal striatal uptake
Benamer et al. (94) ET 27 (9) 64.1 ± 8.8 DaTScan
HC 35 (20) 61.1 ± 8.7 Normal striatal uptake
11
Breit et al. (95) ET 6 (4) 60 ± 5 Cd-threo-methylphenidate PET
HC 10 (5) 58 ± 5 Normal striatal uptake
Caligiuri et al. (51) clET 25 (14) 64.7 ± 10.9 DaTScan
rET 22 (11) 63.7 ± 13.5 Normal striatal uptake in clET and rET
HC 25 (11) 65.1 ± 6.7
Di Giuda et al. (96) ET 15 (9) 52.5 ± 19.5 DaTScan
HC 17 (10) 55.3 ± 13.7 Normal striatal uptake
Fang et al. (97) ET 33 (23) 72.1 ± 10.0 [99m Tc]-TRODAT SPECT
HC 28 (10) 52.3 ± 15.7 Striatal uptake ↓
Gerasimu et al. (98) ET 28 (18) 64 ± 15 DaTScan
HC 28 (16) 63 ± 11 Putamenal uptake ↓
No longitudinal change in 9/10 ET subjects with available follow-up scan
Isaias et al. (99) ET 32 (10) 70 ± 7 DaTScan
HC 31 (18) 64 ± 10 Striatal uptake ↓
Isaias et al. (100) ET 20 (8) 70.4 ± 9 DaTScan
HC 23 (13) 70.5 ± 9 Normal striatal uptake with a trend toward reductions in caudate nucleus
No change over 3 years of follow-up
Lee et al. (101) clET 9 (5) 60.0 ± 11.4 DaTScan
rET 6 (2) 68.3 ± 10.29 Normal striatal uptake in clET, ↓ in rET
HC 21 (n.a.) 61.8 ± 9.7
Nistico et al. (102) clET 14 (7) 68.29 ± 9.15 DaTScan
rET 14 (6) 68.29 ± 9.15 Normal striatal uptake in clET and rET
HC 16 (8) 66.37 ± 2.39
Nistico et al. (103) rET 10 (4) 60.60 ± 12.80 DaTScan
HC 20 (10) 66.71 ± 4.02 Normal striatal uptake
Novellino et al. (104) ET 10 (6) 68.5 ± 5.13 DaTScan
HC 18 (9) 64.06 ± 4.84 Normal striatal uptake
Sun et al. (105) ET 8 (n.a.) n.a.c 11
C-CFT PET
HC 11 (n.a.) n.a.c Normal striatal uptake
Waln et al. (106) pET 9 (4) 67 ± 7.2 DaTScan
clET 22 (8) 60.7 ± 8.5 Trend toward reduced striatal uptake predominantly in the caudate nucleus
HC 13 (6) 63.2 ± 10.1 in both clET and ET-P
Wang et al. (107) ET 12 (4) 52.1 ± 14.1 [99m Tc]-TRODAT SPECT
HC 10 (3) 52.5 ± 10.7 Normal striatal uptake
Perfusion imaging
Boecker et al. (108) ET 6 (4) 54 ± 13.8 H15
2 O PET
HC 6 (n.a.) 45 ± 18.3 rCBF in bilateral CER ↑, increase diminished after intake of ethanol and was
accompanied by increased rCBF of the ION
Jenkins et al. (109) ET 11 (5) 63.8 ± n.a. C15 O2 PET
HC 8 (4) 57.1 ± n.a. rCBF of bilateral CER ↑ during rest, further ↑ during involuntary tremor with
additional rCBF increases of the contralateral thalamus, striatum,
and PMC/SC
Wills et al. (17) ET 7 (3) 49.4 ± n.a. C15 O2 PET
HC 6 (n.a.) 51.1 ± n.a. rCBF of CER and thalamus ↑ during rest, further increase during involuntary
tremor with additional increase in the red nuclei
No increase in rCBF in the ION
Wills et al. (110) ET 7 (3) 49.4 ± n.a. C15 O2 PET
HC 6 (n.a.) 51.1 ± n.a. rCBF in CER, midbrain, and thalamus ↑ during involuntary tremor
Sahin et al. (111) ET 16 (9) 29.6 ± 10 Technetium-99m HMPAO SPECT
HC 16 (9) 28.0 ± 7.1 No difference in rCBF, inverse correlation of frontal cortical rCBF with
cognitive function
(Continued)
Frontiers in Neurology | www.frontiersin.org 9 June 2021 | Volume 12 | Article 680254Holtbernd and Shah Imaging ET
TABLE 2 | Continued
References Subjects (f) Age (mean ± SD) Main findings
Song et al. (112) ET 16 (7) 68.44 ± 13.73 Technetium-99m HMPAO SPECT
HC 33 (23) 66.94 ± 5.40 rCBF in posterior CER, frontal gyrus, cingulate, insula ↓
Song et al. (113) clET 13 (8) 63.54 ± 20.22 Technetium-99m HMPAO SPECT
hET 10 (6) 65.60 ± 8.96 rCBF in posterior CER, frontal gyrus, cingulate, insula ↓
HC 33 (23) 66.94 ± 5.40 No difference between clET and hET
Metabolic imaging
Hallett and Dubisnky ET 8 (3) 50 ± n.a. FDG PET
(114) HC 10 (2) 40 ± n.a. rMRG of medulla oblongata and thalamus ↑
No difference in CER
Ha et al. (115) ET 17 (0) 67.29 ± 4.79 FDG PET
HC 23 (n.a.) 65.35 ± 6.11 rMRG of medial frontal lobe, medial temporal lobe, and precuneus ↓
No difference in CER
Song et al. (116) trET 8 (0) 65.9 ± 0.7 FDG PET
nrET 9 (0) 68.6 ± 6.4 rMRG of CER, frontal, temporal, and occipital lobes, and right precuneus ↓
HC 11 (0) 67.2 ± 1.5 rMRG of right basal ganglia ↓ in trET compared with nrET
Sun et al. (105) ET 8 (n.a.)b n.a. FDG PET
HC 11 (n.a.) n.a. No difference in rMRG in basal ganglia, midbrain, and CER
Breit et al. (95) ET 6 (4) 60 ± 5 FDG PET
HC 10 (5) 58 ± 5 No difference in rMRG in basal ganglia
ET, essential tremor; clET, classical ET; rET, ET subjects presenting with resting tremor; pET, ET individuals presenting with one cardinal parkinsonian feature (bradykinesia, rigidity, or rest
tremor); trET, ET patients responsive to propranolol therapy; nrET, ET patients unresponsive to propranolol therapy; HC, healthy controls; ↓, lower compared with HC; ↑, higher compared
with HC; n.a., not available; CER, cerebellum; ION, inferior olive nucleus; PMC, primary motor cortex; SC, sensory cortex; DaT, dopamine transporter; FDG, 18 F-fluorodeoxyglucose;
PET, positron emission tomography; rCBF, regional cerebral blood flow; rMRG, regional metabolic rate of glucose; SPECT, single-photon emission computed tomography.
a HC significantly older than ET.
b Only gender and age distribution of the entire cohort are provided, and it is not clear if cohorts were matched for gender and age.
to clinical tremor manifestation and task performance (36, 40, those who did not (76), and ET patients with resting tremor
62–64, 66, 67). One study did not report a significant difference in showed different activation patterns of various cortical and
functional connectivity during an emotion processing and finger subcortical brain regions compared with classical ET (73).
tapping task in ET patients compared with HC. However, in the
latter study, HC were not age matched to the ET cohort (32). In
line with the findings from structural imaging, cognitive function Magnetic Resonance Spectroscopy
has been associated with specific activity changes outside the MRS is utilized to assess neurometabolic alterations in brain
classical tremor network (65, 68). tissue in vivo. N-acetylaspartate (NAA) is an abundant amino
More recently, neuronal activity has been assessed in the acid derivative synthesized in neurons. A reduction of NAA,
resting state. Resting-state fMRI is advantageous over task-based therefore, is indicative of neuronal damage. The choline
paradigms in that it is independent of individual variability (Cho) fraction comprises several soluble components mainly
in task performance and interference of tremor with motor located in myelin and cell membranes. Conditions resulting
function. The most consistent finding reported by these studies in increased turnover or damage to cellular membranes and
was altered intrinsic cerebellar and cerebello-thalamo-cortical myelin, such as inflammation, tumor, or neurodegenerative
activation/connectivity, particularly of cerebello-motor cortical processes, result in increased Cho concentrations. Creatine
projections (33–35, 37, 61, 71–75, 77). There is also evidence that (Cr) is found in most neurons and astrocytes. The Cr
complex functional alterations outside the classical tremor axis peak is very robust, which is why Cr is commonly used
are present in ET, including visual networks (69, 70). In this vein, as a denominator to offset changes of NAA and Cho
Archer et al. have demonstrated that activity within the tremor (127). MRS can also be applied to measure GABA (please
and visual networks during a grip motor task could be modulated see below).
by visual feedback (21). Few studies have exploited MRS to investigate
Of note, surgical interventions to treat ET, such as Vim-DBS neurometabolite changes in ET. Louis et al. were the first
or thalamotomy have been shown to restore connectivity in the to report a reduced NAA/Cr ratio in the cerebellum of 16 ET
tremor network partially and to cause widespread remodeling patients compared with 11 HC that was inversely correlated
of other brain networks outside the classical tremor axis [e.g., to tremor severity (81). The same group later found that
(125, 126)]. In line with observations from structural MRI, NAA/Cr changes were similar between cerebellar hemispheres,
the clinical phenotype appears to be associated with distinct in accordance with the symmetric clinical manifestation of
functional brain changes. For example, ET individuals exhibiting ET (82). Similarly, reduced NAA/Cr ratios have been reported
head tremor showed distinct cerebellar activity compared with by Pagan et al. in a small cohort of 10 ET patients (83). That
Frontiers in Neurology | www.frontiersin.org 10 June 2021 | Volume 12 | Article 680254Holtbernd and Shah Imaging ET
said, others found normal NAA/Cr ratios in the thalami of ET studies was on the substantia nigra, and only one study applied
patients (78–80), whereas there was an increase in the excitatory a whole-brain voxel-based approach (87). The authors reported
neurotransmitter glutamate/glutamine evident in one of these increased iron levels in the bilateral pallidum, substantia nigra,
studies (79). and the right dentate nucleus. That being said, only the pallidal
iron increase survived correction for multiple comparisons and
Imaging of the GABAergic System was correlated to tremor severity (87).
The role of GABA in ET has been a topic of ongoing
discussion for many years (13), and different lines of research
have vindicated the significance of the GABAergic system in Radiotracer Imaging
ET pathophysiology. Alongside MRI, PET and SPECT have been applied using a
ET patients show lower GABA levels in the cerebrospinal variety of tracers to study the integrity of the dopaminergic axis,
fluid (128), and GABA receptor density in the cerebellar dentate brain perfusion, and metabolism in ET.
nucleus has been reported to be reduced (129). Alcohol has
agonistic GABAergic properties and alleviates tremor in many Dopaminergic Imaging
patients with ET (130), and the majority of drugs used to Epidemiological studies suggest that ET populations have
treat ET act via GABAergic pathways (131). Moreover, GABA- an increased risk of developing PD, and there is an ongoing
A1 receptor knockout mice develop an ET-like disease that controversy about a potential pathophysiological overlap
responds to GABAergic drugs commonly used to treat ET (132). between the two diseases (14).
The impact of reduced cerebellar GABAergic tone on neuronal FP-CIT SPECT (commercially known as DaTScan) is
activity in cerebello-thalamico-cortical tremor network activity commonly used to assess the presynaptic striatal dopaminergic
has also been highlighted in a recent study applying a complex integrity (138). Striatal tracer uptake is significantly reduced in
computational simulation model of ET (133). typical and atypical parkinsonism (138).
Very few in vivo imaging studies have explored the role Most studies using FP-CIT SPECT or comparable techniques
of GABA in ET. Using PET and 11 C-flumazenil, a ligand of found no alterations of the dopaminergic system in ET (51, 78,
the benzodiazepine site of the GABA receptor, Boecker et al. 93–96, 100, 102–105, 107, 139). These findings were extended
observed increased cerebellar, thalamic, and premotor cortical by two longitudinal studies showing constant tracer uptake over
tracer uptake in a small cohort of ET patients compared with time (98, 100). Of note, a third longitudinal study not meeting
HC, hinting at reduced GABAergic function (90). In contrast, a our inclusion criteria did not reveal a decline of striatal dopamine
separate study employing MRS failed to demonstrate a significant transporter availability over a mean follow-up period of 28
difference in GABA concentration in the dentate nuclei between months (140). One study reported normal DaTScan in classical
ET individuals and HC (91). Another MRS study reported ET patients, whereas tracer uptake was reduced in ET patients
a positive correlation of the cerebellar GABA/glutamate + with additional resting tremor (101). However, resting tremor ET
glutamine ratio with clinical tremor scores in a small ET cohort. individuals were about 7 years older than the corresponding HC,
However, neither GABA nor glutamate/glutamine levels differed and several subjects presented with subtle parkinsonian features,
between ET patients and HC in the latter study (92). Given the raising the question of whether they may have subsequently
limited number of available imaging studies focused on GABA, developed PD. Conversely, others have found normal striatal
we would like to mention the work by Gironell et al. even though dopaminergic integrity in ET patients with resting tremor (102).
their study did not meet our inclusion criteria; they found a That being said, some authors reported signs of slight striatal
significant correlation of cerebellar 11 C-flumazenil uptake and dopaminergic degradation in classical ET (97–99, 106). Of note,
tremor severity in a cohort of 10 ET patients (134). ET patients may show reductions of tracer uptake primarily in the
caudate nucleus, contrasting the typical pattern of pronounced
Imaging of Brain Iron posterior putamenal reductions observed in PD (99, 106).
Different MRI techniques, such as susceptibility-weighted
imaging, T2∗ -weighted, or its inverse R2∗ -weighted gradient Perfusion Imaging
echo imaging, can be used to measure brain iron (135). More A series of small exploratory PET studies conducted in the 1990s,
recently, novel methods, such as neuromelanin and nigrosome-1 mostly using 15 O-labeled H2 O and PET, revealed increased
imaging have been developed to visualize the neuronal integrity regional cerebellar blood flow (rCBF) during both rest and
of the substantia nigra (136). These techniques have been posture in ET patients compared with HC (17, 109, 110).
extensively used to detect iron depositions, which are assumed to These studies showed overactivation of additional regions
be a surrogate of cellular damage in neurodegenerative disorders, comprising the tremor network, whereas olivary overactivation
such as PD (137). was not present in any of these studies (17, 109, 110).
In one study comparing 25 ET patients with 25 matched HC, Boecker et al. demonstrated that abnormally increased cerebellar
no significant difference was found in the R2∗ relaxation times of rCBF decreased toward normal values after ingestion of
the substantia nigra (85). Similarly, three other studies reported ethanol, and this decrease was correlated to concurrent tremor
normal nigral neuromelanin concentrations in ET patients (86, alleviation (108). Furthermore, there was an increase in ION
88, 89), and nigral nigrosome-1 integrity has been found to be activation following ethanol ingestion, suggesting increased
comparable with that of HC (84, 86). The focus of all these afferent olivary input as a consequence of normalizing synaptic
Frontiers in Neurology | www.frontiersin.org 11 June 2021 | Volume 12 | Article 680254Holtbernd and Shah Imaging ET
cerebellar activity (108). More recently, SPECT and 99m Tc- study using an ROI-based approach, no metabolic differences
hexamethylpropylenaminoxom (HMPAO) have been used to were identified in ET patients compared with controls in the basal
measure rCBF in ET cohorts. Sahin et al. did not observe any ganglia (95).
difference of rCBF between 16 ET patients and matched HC,
but reported an inverse correlation of frontal cortical rCBF with
tremor severity (111). Employing the same method, Song et al.
found no significant differences in rCBF between ET patients DISCUSSION
with and without head tremor (113). Interestingly, rCBF was
reduced in various brain regions, including the cerebellum, in Whereas there is relatively little support from neuroimaging for
the overall ET cohort compared with HC in the latter and in a the hypothesis that the ION is the primary oscillator of abnormal
subsequent study conducted by the same group (112, 113). neuronal activity, there is robust evidence indicating that the
cerebellum plays a major role in ET pathophysiology. Findings
Metabolic Imaging from volumetric MRI studies are, however, heterogeneous,
18 F-fluorodeoxyglucose (FDG) and PET can be used to and VBM studies do not unequivocally corroborate with
quantitatively assess brain glucose consumption, which is largely histopathological findings of cerebellar neurodegeneration.
equivalent to neuronal activity (141). FDG PET has been Importantly, the topography of cerebellar regions displaying
extensively used to characterize metabolic brain abnormalities atrophy is inconsistent across studies, countering arguments in
in neurodegenerative disorders, such as PD, and has revealed favor of a uniform pattern of cerebellar cell loss. DTI studies
disease-specific abnormal brain networks that correlate with have more consistently revealed microstructural alterations of
disease severity and can discriminate PD from atypical the cerebellum, and fMRI studies have clearly demonstrated
parkinsonism (142). abnormal cerebellar function and altered connectivity in
Hallett and Dubisnky were among the first to report increased cerebello-thalamico-cortical circuitry. Along these lines,
brainstem and thalamic activity in ET patients, whereas they did radiotracer studies have shown increased cerebellar rCBF in ET
not observe significant changes in cerebellar metabolism (114). patients, further underpinning a pivotal role of this structure in
Similarly, two recently published studies did not find changes in tremor genesis. That said, in view of the widespread functional
cerebellar metabolism, but widespread cortical hypometabolism alterations reported, it is likely that the cerebellum is not the
was reported in one of these studies (105, 115). In contrast, Song sole driver of tremor genesis but rather constitutes a major hub
et al. found cerebellar hypometabolism accompanied by reduced within a multiple oscillator tremor network, thus validating
tracer uptake in various cortical regions (116). In yet another neurophysiological data (122).
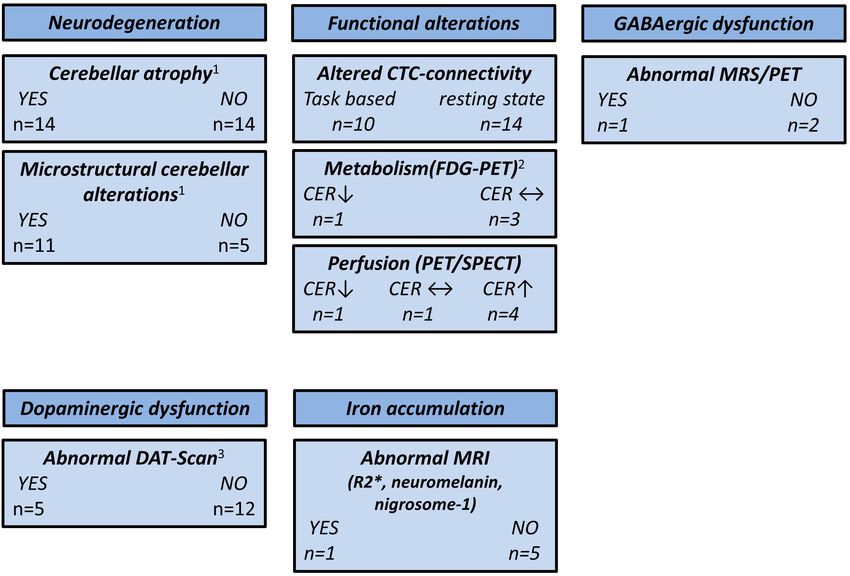
FIGURE 2 | Overview of neuroimaging studies in essential tremor. CER, cerebellum; CTC, cerebello-thalamico-cortical; DAT, dopamine transporter; FDG,
18
F-fluorodeoxyglucose; GABA, γ-aminobutyric acid; MRS, magnetic resonance spectroscopy; MRI, magnetic resonance imaging; PET, positron emission
tomography; SPECT, single-photon emission computed tomography; ↑, higher compared with the healthy controls; ↓, lower compared with the healthy controls; ↔,
no difference compared with the healthy controls. 1 CER not assessed by three studies. 2 CER not assessed by one study. 3 One study used 11 C-CFT PET and two
studies used [99m Tc]-TRODAT SPECT.
Frontiers in Neurology | www.frontiersin.org 12 June 2021 | Volume 12 | Article 680254Holtbernd and Shah Imaging ET
Findings from FDG PET studies are ambiguous. Some studies Taking genetic background (familiar vs. sporadic), age at
have reported extensive cortical hypometabolism, and there is onset, disease duration, therapeutic responsiveness, and clinical
evidence for increased thalamic activity. However, other studies phenotype (e.g., presence of head tremor, symptoms of “ET
have reported opposing results, and in particular, there are plus”) into account is important when studying ET populations,
conflicting findings with respect to cerebellar metabolic activity. but these factors have not been consistently implemented
Data from MRS studies are scarce and insufficient to draw firm in study designs so far. There are additional issues likely
conclusions. However, the few available studies provide some contributing to the heterogeneous findings from neuroimaging
evidence for thalamic and cerebellar neuronal damage. studies, such as limited sample size (this is particularly true
The dopaminergic axis appears to be largely preserved in ET. for PET and SPECT studies), subject age (the mean age
This is also illustrated by the fact that DaTScan has been certified of ET cohorts included in this review ranged from 28 to
for use in the differentiation of PD from ET by both the European 74 years), nature of the analytical approach (e.g., ROI-based
Medicines Agency (EMA) and the United States Food and Drug vs. whole-brain analysis, statistical threshold applied), and
Administration (FDA), and some studies on PD even use ET the different field strengths of the MRI scanners. Moreover,
cohorts as “normal” controls [e.g., (143)]. That being said, some several groups have published multiple papers on related topics
authors have suggested slightly reduced striatal dopaminergic using similar cohorts or did not specify if there was an
integrity in ET subjects that does not, however, seem to decline overlap of cohorts across their studies, a potential source of
over time. reporting bias.
With the exception of one study, there is no evidence for It is desirable that future studies more rigorously focus on
pathological nigral iron accumulation as typically observed in the demographical, genetic, and clinical heterogeneity of ET.
PD. However, only one study did not apply an ROI-based Multimodal imaging, including the simultaneous assessments
approach limited to the substantia nigra, and this study did of MRI, PET, and electroencephalography, may shed further
observe a significant increase of iron accumulation in the bilateral light on the complex neuronal alterations underlying ET.
globus pallidus internus. Therefore, it seems that there is no Furthermore, the much higher spatial resolution of ultra-
relevant nigral iron accumulation in ET, but this could well be the high field MRI may enable researchers to solve the remaining
case for other brain regions not commonly assessed by imaging controversy of whether cerebellar neurodegeneration is the
studies thus far, arguing in favor of neurodegenerative processes. pathological foundation of ET.
Finally, MRS and radiotracer studies lend some support to the
hypothesis that dysfunction of the GABAergic system is involved DATA AVAILABILITY STATEMENT
in ET pathophysiology. It remains to be elucidated whether the
reduced GABAergic tone is a primary contributing factor to ET The original contributions presented in the study are included
pathophysiology or rather a consequence of disturbed Purkinje in the article/supplementary material, further inquiries can be
cell function or even cell death. directed to the corresponding author/s.
Based on the epidemiological, genetic, and clinical
heterogeneity, it is likely that no single ET entity exists, but AUTHOR CONTRIBUTIONS
rather an ET spectrum. This is supported by the notion that
clinical phenotype, e.g., the distribution of tremor manifestation, FH: study design, data collection and analysis, and drafting of
the presence of cognitive impairment, or resting tremor, is linked the manuscript. NS: study design, revision of the manuscript,
to specific functional and structural brain changes. A summary of and supervision. Both authors contributed to the article and
the main findings reported in this review is depicted in Figure 2. approved the submitted version.
REFERENCES 6. Louis ED, Lenka A. The olivary hypothesis of essential tremor: time
to lay this model to rest? Tremor Other Hyperkinet Mov (N Y). (2017)
1. Louis ED, Ferreira JJ. How common is the most common adult movement 7:473. doi: 10.7916/D8FF40RX
disorder? Update on the worldwide prevalence of essential tremor. Mov 7. Raethjen J, Deuschl G. The oscillating central network of essential tremor.
Disord. (2010) 25:534–41. doi: 10.1002/mds.22838 Clin Neurophysiol. (2012) 123:61–4. doi: 10.1016/j.clinph.2011.09.024
2. Louis ED. The roles of age and aging in essential tremor: an epidemiological 8. Shill HA, Adler CH, Sabbagh MN, Connor DJ, Caviness JN, Hentz JG, et
perspective. Neuroepidemiology. (2019) 52:111–8. doi: 10.1159/000492831 al. Pathologic findings in prospectively ascertained essential tremor subjects.
3. Louis ED, Dogu O. Does age of onset in essential tremor have a bimodal Neurology. (2008) 70:1452–5. doi: 10.1212/01.wnl.0000310425.76205.02
distribution? Data from a tertiary referral setting and a population-based 9. Louis ED, Lee M, Babij R, Ma K, Cortes E, Vonsattel JP, et al. Reduced
study. Neuroepidemiology. (2007) 29:208–12. doi: 10.1159/000111584 Purkinje cell dendritic arborization and loss of dendritic spines in essential
4. Hopfner F, Deuschl G. Is essential tremor a single entity? Eur J Neurol. (2018) tremor. Brain. (2014) 137:3142–8. doi: 10.1093/brain/awu314
25:71–82. doi: 10.1111/ene.13454 10. Axelrad JE, Louis ED, Honig LS, Flores I, Ross GW, Pahwa R, et al. Reduced
5. Bhatia KP, Bain P, Bajaj N, Elble RJ, Hallett M, Louis ED, et Purkinje cell number in essential tremor: a postmortem study. Arch Neurol.
al. Consensus statement on the classification of tremors from the (2008) 65:101–7. doi: 10.1001/archneurol.2007.8
task force on tremor of the International Parkinson and Movement 11. Rajput AH, Robinson CA, Rajput A. Purkinje cell loss is neither pathological
Disorder Society. Mov Disord. (2018) 33:75–87. doi: 10.1002/mds.2 basis nor characteristic of essential tremor. Parkinsonism Relat Disord. (2013)
7121 19:490–1. doi: 10.1016/j.parkreldis.2012.11.019
Frontiers in Neurology | www.frontiersin.org 13 June 2021 | Volume 12 | Article 680254You can also read