Impact of Speeds on Drivers and Vehicles - Results from Crash Tests
←
→
Page content transcription
If your browser does not render page correctly, please read the page content below

JA N UA RY 2 02 1

Impact of Speeds on Drivers
and Vehicles — Results from
Crash Tests
                    Woon Kim, Ph.D.
                    Tara Kelley-Baker, Ph.D.
                    AAA Foundation for Traffic Safety

                    Raul Arbelaez
                    Sean O’Malley
                    Insurance Institute for Highway Safety

                    Jack Jensen
                    Humanetics Innovative Solutions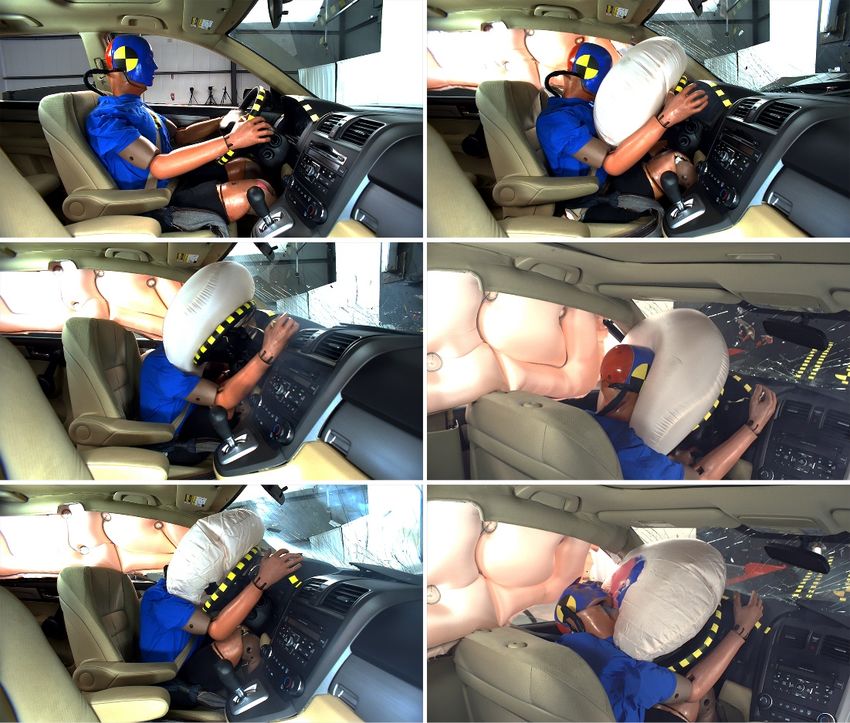
Title
Impact of Speeds on Drivers and Vehicles – Results from Crash Tests

Authors
Woon Kim, Tara Kelley-Baker
AAA Foundation for Traffic Safety
Raul Arbelaez, Sean O'Malley
Insurance Institute for Highway Safety

Jack Jensen
Humanetics Innovative Solutions

                                              2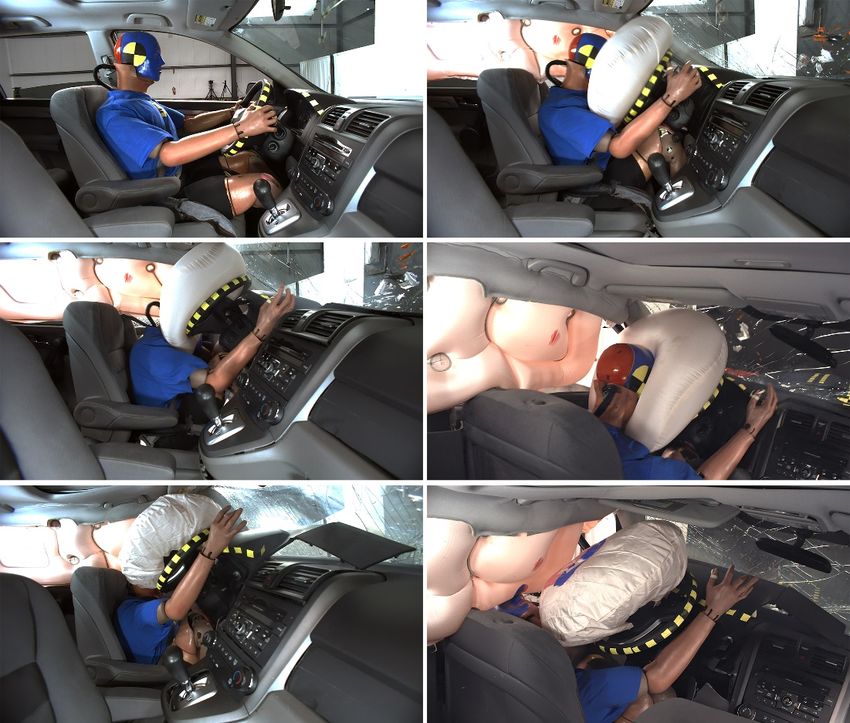
Foreword
AAA Foundation for Traffic Safety, in collaboration with the Insurance Institute for Highway
Safety and Humanetics Innovation Solutions, conducted three vehicle crash tests in October
2019 to assess the effects of speed on vehicles and drivers. This joint effort represents our
organizations’ commitment to improve traffic safety by sharing study findings with researchers,
practitioners, governmental transportation authorities, and the general public.
Speed continues to play a key role in traffic safety, and posted speed limits offer motorists
information on the appropriate speeds they should travel. Multiple studies have found obvious
correlations between speed, crash risk, and injury severity. In the recent years, however, some
states and cities in the U.S. have steadily raised the posted speed limits on their roads based on
average travel speeds of vehicles. Information presented in this technical report will hopefully
serve as a helpful reference for decision makers and encourage them to use multiple criteria
when considering changes to posted speed limits in their jurisdictions.
Work described in this report would not have been possible without the additional financial
support from AAA Auto Club Group and in-kind assistance from AAA Western and Central New
York during the vehicle crash tests.

                                                       C. Y. David Yang, Ph.D.
                                                       Executive Director
                                                       AAA Foundation for Traffic Safety

                                                       David L. Harkey, Ph.D.
                                                       President
                                                       Insurance Institute for Highway Safety &
                                                       Highway Loss Data Institute

                                                       Christopher J. O’Connor
                                                       President & CEO
                                                       Humanetics Innovative Solutions, Inc.

                                                3
About the Sponsor
AAA Foundation for Traffic Safety
607 14th Street, NW, Suite 201
Washington, D.C. 20005
202-638-5944
www.aaafoundation.org

Founded in 1947, the AAA Foundation for Traffic Safety in Washington, D.C., is a nonprofit,
publicly supported charitable research and education organization dedicated to saving lives by
preventing traffic crashes and reducing injuries when crashes occur. Funding for this report was
provided by voluntary contributions from AAA/CAA and their affiliated motor clubs, individual
members, AAA-affiliated insurance companies and other organizations or sources.
This publication is distributed by the AAA Foundation for Traffic Safety at no charge, as a public
service. It may not be resold or used for commercial purposes without the explicit permission of
the Foundation. It may, however, be copied in whole or in part and distributed for free via any
medium, provided the Foundation is given appropriate credit as the source of the material. The
AAA Foundation for Traffic Safety assumes no liability for the use or misuse of any information,
opinions, findings, conclusions or recommendations contained in this report.
If trade or manufacturers’ names are mentioned, it is only because they are considered
essential to the object of this report and their mention should not be construed as an
endorsement. The AAA Foundation for Traffic Safety does not endorse products or
manufacturers.

                                                4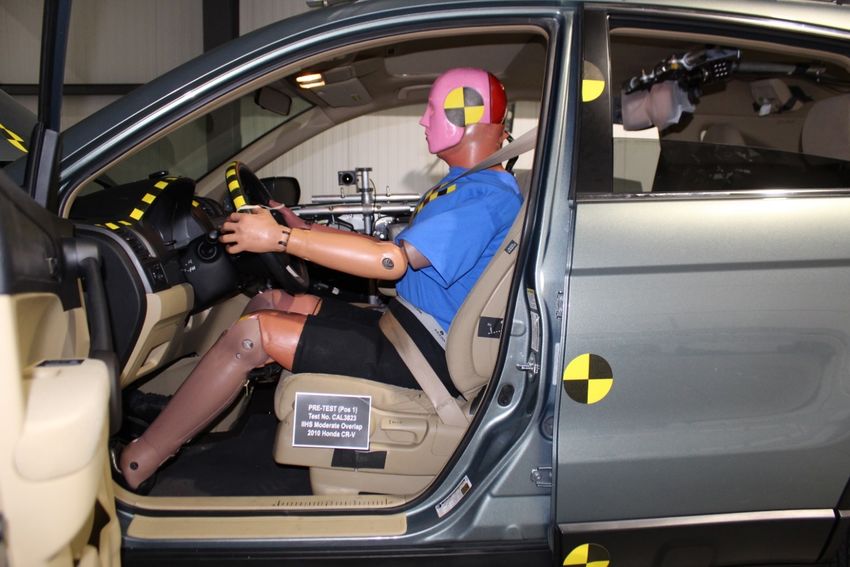
Table of Contents
Foreword ...................................................................................................................................................... 3
About the Sponsor ....................................................................................................................................... 4
Table of Contents ......................................................................................................................................... 5
List of Figures ................................................................................................................................................ 7
List of Tables ................................................................................................................................................. 8
Executive Summary ...................................................................................................................................... 9
Introduction ................................................................................................................................................ 13
   Study Motivation and Background ........................................................................................................ 13
   Vehicle Crashworthiness Test ................................................................................................................ 14
Study Methodology .................................................................................................................................... 15
   Test Type................................................................................................................................................. 15
   Crash Speed ............................................................................................................................................ 16
   Test Vehicle ............................................................................................................................................ 16
   Barrier Type ............................................................................................................................................ 21
   Crash Test Dummy Type......................................................................................................................... 23
Study Results .............................................................................................................................................. 26
   Vehicle Response.................................................................................................................................... 26
       Changes in vehicle metrics ................................................................................................................. 26
       Occupant compartment deformation................................................................................................ 28
   Dummy Kinematic Evaluation and Injury Measures ............................................................................. 33
       Restraint system performance and dummy kinematic observations ............................................... 33
       Injury measures .................................................................................................................................. 36
   Overall Result and Crashworthiness Rating .......................................................................................... 40
Discussion ................................................................................................................................................... 44
References .................................................................................................................................................. 46
Appendix A. Crash Test Dummy Clearance Measures .............................................................................. 49
Appendix B1. Summary of Peak Dummy Injury Measures and Timing for Test 1 ................................... 51
Appendix B2. Summary of Peak Dummy Injury Measures and Timing for Test 2 ................................... 52
Appendix B3. Summary of Peak Dummy Injury Measures and Timing for Test 3 ................................... 53
Appendix C1. Postcrash Views from Test 1 ............................................................................................... 54
Appendix C2. Postcrash Views from Test 2 ............................................................................................... 62

                                                                                5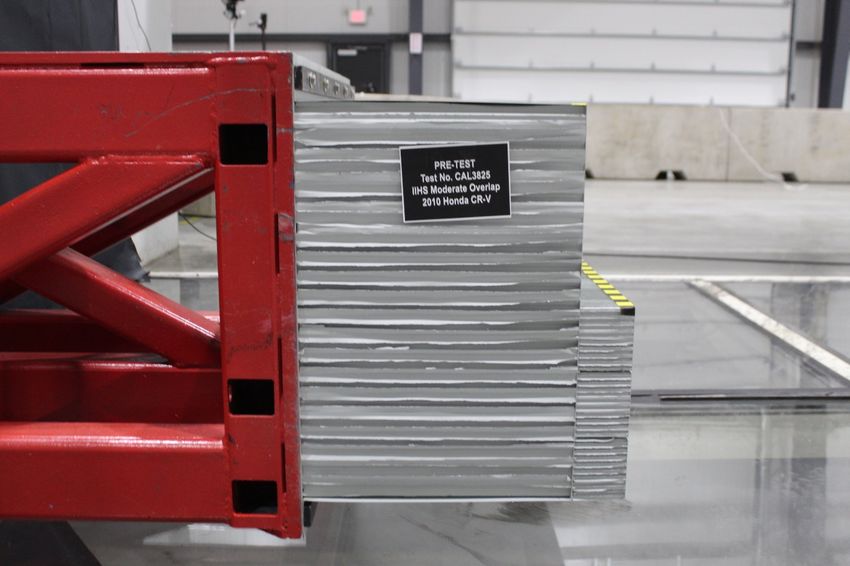
Appendix C3. Postcrash Views from Test 3 ............................................................................................... 71

                                                                    6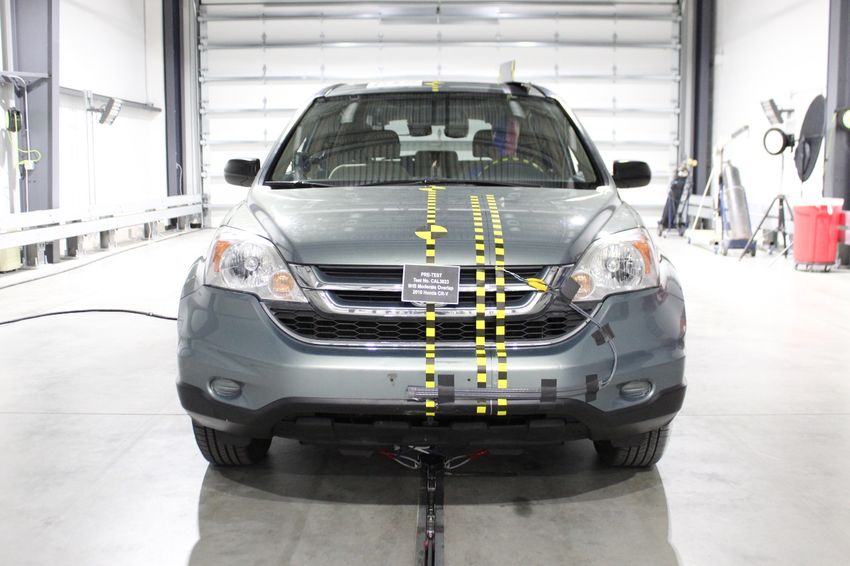
List of Figures
Figure 1. The overhead pre-crash view for the 40% offset frontal crash test mode .............................16
Figure 2. Front and side views of the vehicle for Test 1 ......................................................................18
Figure 3. Front and side views of the vehicle for Test 2 ......................................................................19
Figure 4. Front and side views of the vehicle for Test 3 ......................................................................20
Figure 5. Deformable barrier composition ........................................................................................21
Figure 6. Side and front views of deformable barrier used for this study ............................................22
Figure 7. Side and front views of deformable barrier used for this study ............................................24
Figure 8. Overview of pre-test setup .................................................................................................25
Figure 9. Vehicle longitudinal accelerations ......................................................................................27
Figure 10. Vehicle longitudinal delta-V..............................................................................................27
Figure 11. Vehicle and onboard views from Test 1 (64.4 km/h) ..........................................................30
Figure 12. Vehicle and onboard views from Test 2 (80 km/h).............................................................31
Figure 13. Vehicle and onboard views from Test 3 (90 km/h).............................................................32
Figure 14. Test 1 dummy kinematics .................................................................................................34
Figure 15. Test 2 dummy kinematics .................................................................................................35
Figure 16. Test 3 dummy kinematics .................................................................................................36
Figure 17. Head and neck injury measures normalized by IARV .........................................................37
Figure 18. Femur injury measures .....................................................................................................38
Figure 19. Lower leg injury measures normalized by IARV .................................................................39
Figure 20. Visual comparison of vehicle exterior between the three tests ..........................................41
Figure 21. Visual comparison of occupant compartment between the three tests ..............................42

                                                                   7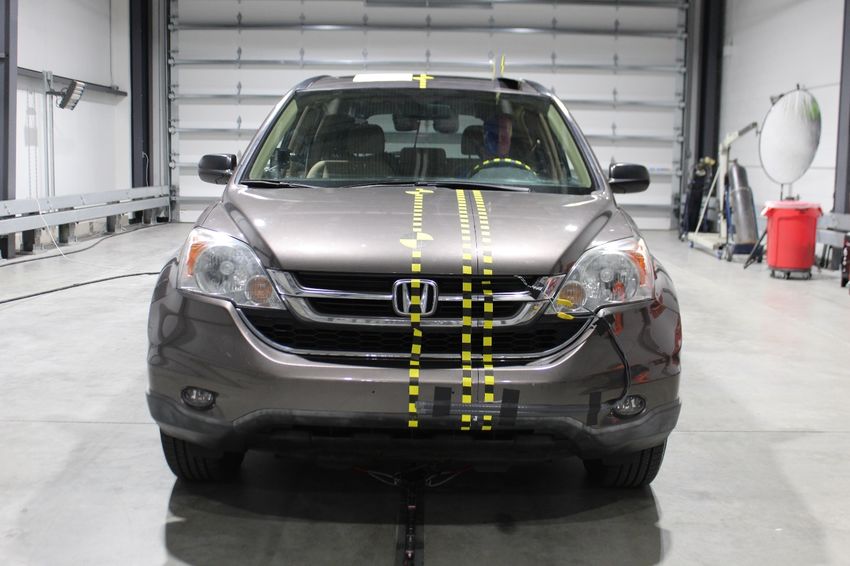
List of Tables
Table ES1. Vehicle crashworthiness and occupant protection ratings based on IIHS protocols ………… 10
Table 1. Test vehicle specifications ...................................................................................................17
Table 2. Summary of vehicle metrics for each test.............................................................................26
Table 3. Summary of occupant compartment intrusion .....................................................................29
Table 4. Restraint system performance and dummy kinematics ........................................................33
Table 5. IIHS Crashworthiness Ratings ..............................................................................................43

                                                                    8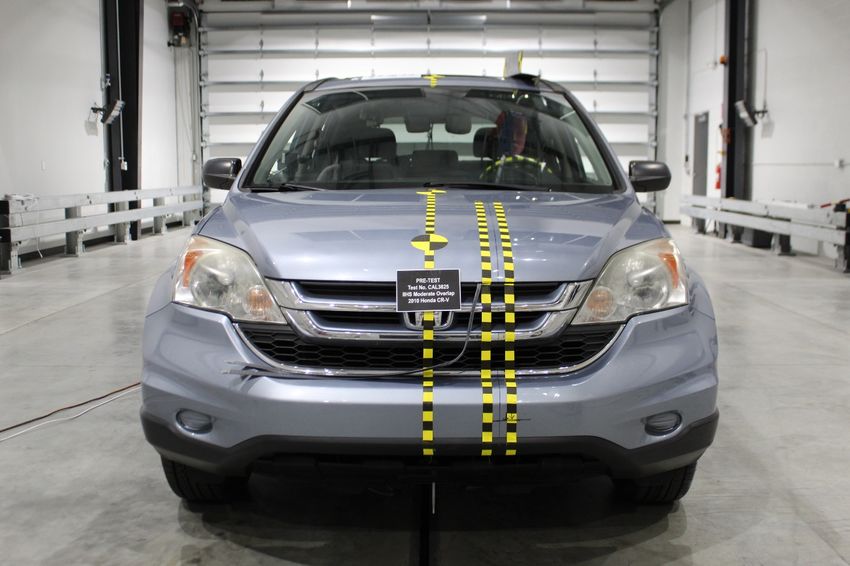
Executive Summary

Introduction
Despite numerous studies reporting the negative impacts of increased speeds on roadways,
many states have steadily raised their posted speed limits. In response to these concerns, the
AAA Foundation for Traffic Safety initiated a multi-phased study to investigate the effect of
posted speed limit changes on traffic safety. The first phase entailed gathering feedback from
traffic engineers on how posted speed limits are set and what factors they consider in changing
posted speed limits (Kim et al., 2019). The second phase, which is the subject of this report,
entailed a collaborative effort with the Insurance Institute for Highway Safety (IIHS) and
Humanetics Innovative Solutions to examine how vehicle crashworthiness and occupant
protection degrade as impact speed increases. Towards this, three vehicle crash tests were
conducted.
Methodology
Following the IIHS test protocol, the crash tests were set up and executed between October 28
and 30, 2019. The following summarizes details of the tests:

   •   Test type: Tests were conducted at a moderate overlap frontal impact crash mode. In
       this mode, 40% of the maximum width of the test vehicle crashed into a deformable
       barrier on the driver side with the forces concentrated on the driver side of the vehicle.
       This test setup simulates a head-on, partial-overlap crash between two vehicles of the
       same weight and size travelling at the same speed.
   •   Crash speed: Tests were conducted at three different impact speeds – 40 mi/h for the
       baseline test (Test 1) and 50 mi/h and 55.9 mi/h for two higher speeds (Test 2 and Test
       3, respectively).
   •   Test vehicle: Three 2010 Honda CR-V EX vehicles were selected as they represented the
       average age of vehicles (11.8 years in 2019) on today’s U.S. roadways and earned the
       top rank in crash test ratings. All three had comparable specifications including
       manufacture date, vehicle mileages, and drive type.
   •   Barrier type: Test vehicles were crashed into a barrier face that was fixed and composed
       of aluminum honeycomb materials.
   •   Crash test dummy type: This study used a Hybrid III 50th percentile male dummy
       positioned in the driver seat to represent an average-sized male driver. The dummy in
       each test was instrumented to record measures from the head, neck, chest, thighs, and
       legs.

                                               9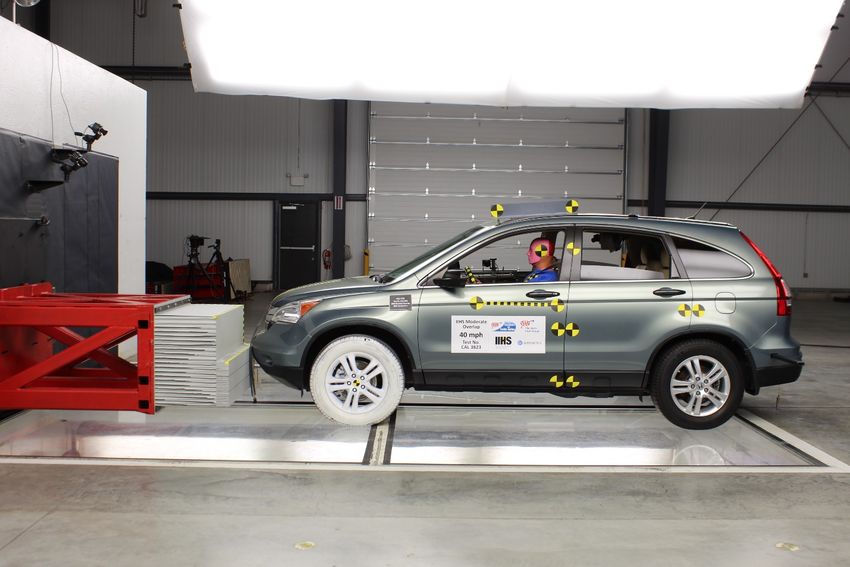
Main Findings
Overall, as the crash speed increased, the additional occupant compartment deformations and
higher crash energy resulted in higher peak injury measures recorded by dummy sensors over
the entire body region. Key findings included the following:
   Vehicle response

   •   The increased impact speed of 10 mi/h in Test 2 and 15.9 mi/h in Test 3 corresponded to
       an increase in kinetic energy of 54% and 95%, respectively, relative to Test 1.
   •   Test 1 had minimal occupant compartment intrusion. Test 2 resulted in some
       deformation of the driver side door opening and to the instrument panel and footwell
       (brake pedal). In contrast, the occupant compartment was significantly compromised in
       Test 3, narrowing the driver door opening by 4 inches and having 5 to 16 inches greater
       interior intrusion than in Test 1.
   •   In Test 1, there was minimal movement of the steering wheel (1 inch both forward and
       upward) because of the dummy loading the steering wheel through the airbag. In Tests
       2 and 3, there was some rearward movement of the steering wheel (1 inch and 3 inches,
       respectively) and large upward movement (4 inches and 7 inches, respectively), which
       compromised the position of the airbag.

   Injury measures from the dummy

   •   Head: Severe injury measurements for the dummy were observed only in Tests 2 and 3.
       The higher energy combined with the large upward movement of the steering wheels
       resulted in the dummy’s head going through the deployed airbag (also known as
       “bottoming out”). This caused the face to make hard contact with the steering wheel
       rim, hub or both and produced high values on the Head Injury Criterion that are
       indicative of a high risk (52% – 67%) of facial fracture and severe brain injury (Consumer
       Information; New Car Assessment Program, 2008).
   •   Neck: Test 3 showed a high value of peak neck tension, which corresponds to a 19% risk
       of a serious neck injury (Consumer Information; New Car Assessment Program, 2008).
   •   Chest: Peak accelerations to the chest increased with test severity, but the maximum
       chest compression was similar between the three tests. There was no indication of
       severe chest injury in any of the tests.
   •   Lower extremities: Loads to the lower extremities and, as a result, the likelihood of
       fracture to the long bones in the lower leg (tibia, fibula, or both) also increased with
       impact speed.
According to National Highway Traffic Safety Administration (Consumer Information; New Car
Assessment Program, 2008), the injury measures from the baseline test (Test 1) represent a

                                               10
15% risk of serious or worse 1 overall injury. In contrast, the result from Test 2 indicates a 59%
risk, while the result from Test 3 indicates a 78% risk of serious or worse overall injury.
As shown in the table below, using IIHS protocols (IIHS, 2006, 2007, 2014, 2017), only the
baseline test vehicle would earn a rating of good in the overall evaluation, which is derived
from the ratings for the injury measures, structure, and restraints and kinematics components.
Tests 2 and 3 would earn a poor overall score, with Test 2 results heavily influenced by the
elevated head injury measures, and Test 3 by elevated injury measures to vital body regions
and the heavily compromised occupant compartment.
Table ES1. Vehicle crashworthiness and occupant protection ratings based on IIHS
protocols
Test 1 Test 2 Test 3
40 mi/h 50 mi/h 55.9 mi/h
(64.4 km/h) (80 km/h) (90 km/h)
Overall evaluation
Structure
Restraints & Kinematics
Driver injury measures
Head/neck
Chest
Left leg
Right leg
Note: The overall rating and each measurement for a vehicle’s crashworthiness can be good (G; the highest rating),
acceptable (A), marginal (M), or poor (P; the lowest rating).
Conclusion
These results show that the impact speeds in Tests 2 and 3 increased the kinetic energy to the
level that exceeds the capacity handled by the vehicle’s energy-absorbing structures. The
remaining crash energy transferred to the occupant compartment and resulted in increased
1
A score of 3 or higher on the Abbreviated Injury Scale (AIS) (Associate for the Advancement of Automotive
Medicine, 1990)
11injury severity in the test dummies. This implies that the survival likelihood of the driver in the
Test 2 and 3 vehicles would be considerably lower than that of the Test 1 vehicle.
Speeds on the roadway are often significantly higher than those of posted speed limits and
those used in crash tests. Even after accounting for braking and/or other factors that decrease
impact speed, some portion of serious injury crashes in the real world occur at severities higher
than those from these crash tests. Further, this study clearly shows that relatively small
increases in absolute speed (5 and 10 mi/h) not only degrade the occupant survival space in
vehicles with state-of-the-art crashworthiness designs but also proportionally increase the
driver’s injury and fatality risk.
The results and implications from the present study convey that there is a rise in occupant
injury risk and compromised occupant compartment due to an increased impact speed, given
other factors remaining constant. This information suggests advocating the importance of road
safety improvement in speed limit policies and prioritizing safety when setting maximum speed
limits should continue.
12Introduction
Study Motivation and Background
In 1995, U.S. legislation repealed the 55 mph national maximum speed limit on interstate
highways, an act that provided complete freedom for states to set their own speed limits. Since
then, many states have steadily raised their posted speed limits.
Meanwhile, many studies (Nilsson, 2004; Vadeby and Forsman, 2018; Kibar and Tuydes-Yaman,
2020) have reported the negative impact of increasing posted speed limits on traffic safety. For
example, Castillo-Manzano et al. (2019) conducted a meta-analysis to examine the effects of
increasing speed limits on traffic fatalities in the United States. They examined the fatality
count both on U.S. rural interstates, where speed limits were increased in 1987 and 1995, and
on statewide road networks including rural interstates and found that while both counts went
up, the effect was larger on the rural interstates. A study by Warner et al. (2019) also reported
that on roadway segments where speed limits increased to 75 or 80 mph, the increases in fatal
crashes involving speeding and driver distraction were greater than the increases in the total
count of fatal crashes. In addition, Wang et al. (2018) showed that both mean speed and speed
variation on urban arterials were positively associated with total crashes.
In response to these findings, as well as public concerns about the potential safety implications
of such increases, the AAA Foundation for Traffic Safety (AAAFTS) initiated a multi-phase study
to investigate the effect of posted speed limit changes on safety. AAAFTS completed Phase 1 in
2018, which reviewed the current practices for setting posted speed limits (Kim et al., 2019). As
part of this effort, an extensive literature review was conducted and a subsequent online
survey was developed and administered to traffic engineers across the nation. The survey
revealed that although many respondents consider multiple factors in their decision to change
posted speed limits, including crash frequency statistics and surrounding land use, the most
common factor (considered by 98% of respondents) was the 85th percentile operating speed —
“the speed at or below which 85 percent of the motor vehicles travel” (Federal Highway
Administration, 2009). Findings from Phase 1 suggest that traffic engineers generally consider
mobility more often than they do safety when changing speed limits.
To further their investigation on the impacts of posted speed limit changes on road safety, in
2019 the AAAFTS launched the second phase of their study. In collaboration with the Insurance
Institute for Highway Safety (IIHS) and Humanetics Innovative Solutions, the team conducted
vehicle crash tests to examine the relationship between speed and crashworthiness
performance metrics. As states have steadily enacted policies increasing the maximum speed
limit with 41 states currently having speed limits of 70 mph or higher, more studies on the
outcomes of high speed crashes are needed.
13Vehicle Crashworthiness Test
Vehicle crash tests have been widely used in many countries, including the U.S., to evaluate the
level of occupant protection when vehicle structures and restraint systems are compromised.
Crash tests employ different laboratory crash modes in a variety of configurations: front crash
tests (full-width and partial overlap configurations), side crash tests, roof strength tests for
rollover protection, and rear impact tests.
The IIHS, which is one of the entities executing crashworthiness programs for consumer
information in the U.S., evaluates vehicles by combining measurements from crash dummy
injury, occupant compartment intrusion, occupant restraint system, and dummy kinematics
during a crash test. The overall rating for a vehicle’s crashworthiness can be good, acceptable,
marginal, or poor. An analysis of real-world crash data indicates drivers in vehicles with a good
rating have a 46% lower fatality risk in frontal crashes compared with drivers in poor-rated
vehicles (IIHS, 2020).
Unlike standard crash tests for these safety ratings, this study focused on how vehicle
crashworthiness degrades as impact speed increases. The results and implications convey a
solid message of increased occupant injury risk and compromised occupant compartment with
increased impact speed, given other factors remaining constant. The information is valuable to
policy/lawmakers and practitioners who advocate for more safety considerations when setting
maximum speed limits.
This report summarizes the crash test designs, protocols followed, and results from data
analyses. A discussion on the implications of these results and future work is presented as well.
14Study Methodology
A series of crash tests requires an appropriate facility and specialized equipment, along with
detailed preparation work for setup and execution. The test design includes a consideration of
various parameters including but not limited to test type, impact speed, vehicle type, barrier
type, and dummy type. This section presents the setup of each parameter for this study
following the IIHS test protocol (IIHS, 2017) and the rationale for the selected setup.
Test Type
Since 1979, the National Highway Traffic Safety Administration (NHTSA) has performed the New
Car Assessment Program (NCAP) to evaluate front crash protection in a frontal crash into a flat
rigid barrier at 56 km/h (35 mi/h). The NCAP test is based on the U.S. frontal regulatory test,
Federal Motor Vehicle Safety Standard (FMVSS) 208, which is conducted at 48 km/h (30 mi/h).
NHTSA’s FMVSS 208 and NCAP tests led the way for improvements in occupant protection and
occupant restraint systems (Hackney, 1993; Kahane, 1994).
Despite the progress made with the flat rigid wall test, analyses of real-world crashes indicate
partial overlap (or offset) crashes are an important consideration that could help in the
assessment of frontal crashworthiness (Zeidler et al., 1981; Hobbs 1991; Killina et al., 1992;
Witteman, 1993). The offset test mode concentrates crash loads on only part of the front
structure, resulting in different challenges for maintaining occupant survival space.
For this study, a moderate overlap frontal impact test was conducted following the IIHS test
protocol version XVIII (IIHS, 2017) for all three tests, except we increased the impact speed in
Tests 2 and 3. In this crash mode, 40% of the maximum width of the test vehicle crashed into a
deformable barrier on the driver side with the forces concentrated on the driver side of the
vehicle. Figure 1 illustrates the vehicle aligned with the barrier from the overhead view. This
test setup simulates a head-on, partial-overlap crash between two vehicles of the same weight
and size travelling at the same speed.
15Figure 1. The overhead pre-crash view for the 40% offset frontal crash test mode
Crash Speed
Crash tests were conducted at three different impact speeds. Because the purpose of this study
was to investigate the effects of progressively higher impact speeds on occupant protection, as
well as vehicle performance, the tests were conducted at the standard consumer information
test speed of 64.4 km/h (40 mi/h) and two higher speeds, 80 km/h (50 mi/h) and 90 km/h (55.9
mi/h).
It is important to note that the impact speed of these tests do not necessarily represent a
driving speed or a speed limit. In these tests, the vehicles contact an unmovable barrier with a
deformable element attached. The barrier does not move away as an impacted vehicle would in
a moving-car to stopped-car crash. In addition, real crashes may involve braking or other
slowing factors prior to impact. Thus, the crash speeds tested here may be representative of
crashes that occur on roadways with posted speed limits that are higher than the test speeds.
Test Vehicle
To select an appropriate test vehicle for this study, several criteria were considered. First, the
tests included secondhand vehicles, as they represent the average age of vehicles (11.8 years in
2019) on U.S. roadways today (USDOT, 2018; Statista, 2019). Second, small to midsize sport
16utility vehicles were used for testing due to the popularity of these vehicles. At the time of
testing, the demand for these vehicles in the market was increasing and forecasts indicated this
trend would continue. Third, tests included vehicle models that received good safety ratings in
crashworthiness tests in order to examine how the differences in vehicle speed would affect
driver injuries in a vehicle that earns high marks for frontal crash protection. Lastly, vehicle
history was examined to exclude vehicles with salvaged titles, flood vehicles, vehicles with
underbody corrosion, and vehicles with evidence of a prior crash and associated repairs.
The aforementioned selection criteria identified the 2010 Honda CR-V EX as the desired
year/make/model for the subject vehicle. Table 1 summarizes key specifications of the selected
test vehicles and Figures 2 – 4 present the selected vehicles after setup for the crash tests.
Table 1. Test vehicle specifications
Test 1 Test 2 Test 3
64.4 km/h 80 km/h 90 km/h
Impact velocity
(40 mi/h) (50 mi/h) (55.9 mi/h)
Make & Model Honda CR-V EX Honda CR-V EX Honda CR-V EX
Manufacture date May 2010 June 2010 April 2010
Vehicle mileage 101,116 94,524 95,156
Drive Type All wheel drive All wheel drive All wheel drive
Vehicle test mass 1,710 kg 1,716 kg 1,713 kg
Vehicle ID Number 5J6RE4H56AL073772 5J6RE4H54AL076167 5J6RE4H5XAL061981
17Figure 2. Front and side views of the vehicle for Test 1
18Figure 3. Front and side views of the vehicle for Test 2
19Figure 4. Front and side views of the vehicle for Test 3
20Barrier Type
The barrier that the test vehicles collided with consisted of three components: base unit,
extension, and deformable face. Figure 5 illustrates the barrier composition. The base unit is
made of laminated steel and reinforced concrete, while the main body of the extension is
composed of structural steel. The deformable face is 1 m wide and attached to the extension at
a height of 20 cm from the ground. The face is composed of a bumper attached to a base
constructed of different aluminum honeycomb materials. Figure 6 presents pre-test views for
the actual barrier used for this study.
Figure 5. Deformable barrier composition
Source: IIHS crash test protocol (IIHS, 2017)
21Figure 6. Side and front views of deformable barrier used for this study
22Crash Test Dummy Type
Crash tests use a full-scale anthropomorphic test device (ATD) or crash test dummy. Data
collected from ATDs are analyzed to assess the risk to a human in a given test.
One standard ATD family used for frontal crash tests is the Hybrid III family that includes a 50th
percentile male, 95th percentile male, 5th percentile female, and three child dummies (ten-, six-
and three-year olds). This study used a Hybrid III 50th percentile male dummy positioned in the
driver seat, as shown in Figure 7, to represent an average-sized male driver. The seat
adjustment and dummy positioning were performed according to the Guidelines for Using the
UMTRI ATD Positioning Procedure for ATD and Seat Positioning Version V (IIHS, 2004). Following
dummy positioning, pre-crash coordinates of various dummy locations and dummy-to-vehicle
clearance measures were recorded to ensure repeatable pre-crash conditions for each test
(Appendix A). Pre-crash locations of key dummy locations (head center of gravity and hip
reference point) were within a 5 – 10 mm range between tests.
The dummy in each test was instrumented to record measures from the head, neck, chest,
femur, and lower legs. In addition to dummy instrumentation, vehicle onboard and offboard
high-speed cameras (500 frames per second) were used to document deployment times for
airbags and belt tensioners as well as kinematic events involving the dummy, including
interaction times with the airbag and components within the vehicle.
In addition to comparing differences in dummy injury outcomes and dummy kinematics
throughout the crash, deformation of the occupant compartment caused by the crash test was
also assessed. Pre- and post-crash measures of vehicle controls (steering wheel and brake
pedal), toe pan region, and closure of the door opening were recorded, following the IIHS test
protocol.
23Figure 7. Side and front views of deformable barrier used for this study
24Figure 8 depicts the full setup of the crash test prior to running each of the tests. All tests were
conducted by Calspan Corporation in its crash laboratory in Buffalo, New York. We chose
Calspan, an independent crash-testing facility serving the auto industry, because they could
conduct tests at the higher crash test speeds required for this study.
Figure 8. Overview of pre-test setup
25Study Results
Vehicle Response
Changes in vehicle metrics
Table 2 summarizes peak vehicle longitudinal accelerations and velocity change (delta-V). For
each crash test, the delta-V is greater than the impact velocity due to the additional velocity
change resulting from the vehicle rebounding off the fixed barrier (i.e. rearward vehicle
motion). Figures 9 and 10 show vehicle acceleration and delta-V during each test. The onset of
increased vehicle accelerations in Tests 2 and 3 was caused by the left front wheel being
pushed back into the hinge-pillar and lower sill areas. The increased impact velocities in Tests 2
and 3 of 15.6 km/h and 25.6 km/h, respectively, equate to an increase in kinetic energy of 54%
and 95% relative to Test 1.
Table 2. Summary of vehicle metrics for each test
Test 1 Test 2 Test 3
Target velocity (km/h) 64.4 80.5 90.0
Actual impact velocity (km/h) 64.4 80.5 89.8
Peak longitudinal acceleration (g) −36.9 −46.8 −55.5
Delta-V (km/h) 72.9 87.7 99.0
26Figure 9. Vehicle longitudinal accelerations
Note: The abbreviation ms stands for millisecond (a thousandth of a second).
Figure 10. Vehicle longitudinal delta-V
27Occupant compartment deformation
Table 3 summarizes the occupant compartment intrusion measures and Figures 11 – 13 provide
a visual of the major observations for vehicle and occupant compartment deformation. As
shown, the increased crash energy resulted in higher levels of occupant compartment
deformation across all compartment measures with each test. Vehicles are typically designed so
that the engine compartment crushes, absorbing energy and enabling the occupant
compartment to remain intact. Although the baseline test (Test 1) had some occupant
compartment intrusion, it was minimal. Test 2 resulted in some deformation of the driver side
door opening (A-B-pillar closure increased from 0 cm to 1 cm) and instrument panel and
footwell deformations (brake pedal) that were 4 cm – 18 cm greater than the baseline test. The
occupant compartment was significantly compromised in Test 3, with a narrowing of the driver
door opening by 11 cm and with interior intrusion measures that were 13 cm – 40 cm greater
than those in the baseline test.
In Test 1, the steering column’s energy-absorbing mechanism allowed it to compress, which
resulted in post-crash measures of the center of the steering wheel that were 3 cm forward
(away from the occupant) and 3 cm higher than the pre-crash position. The movement away
from the dummy is due to the dummy loading the steering wheel through the airbag. The
steering column is designed as an energy-absorbing feature of the overall occupant restraint
system. In Tests 2 and 3, there was some rearward movement (2 cm and 8 cm, respectively)
and a large upward movement (11 cm and 18 cm, respectively) of the steering wheel while the
dummy was moving forward into the inflated airbag. Large upward movement of the steering
column is not desirable for ideal occupant restraint because it places the airbag in a suboptimal
position.
28Table 3. Summary of occupant compartment intrusion
Intrusion Measurement
Location Test 1 Test 2 Test 3
Steering Wheel (x-axis) -3 cm 2 cm 8 cm
Steering Wheel (z-axis) 3 cm 11 cm 18 cm
A-B Pillar Closure (x-axis) 0 cm 1 cm 11 cm
Footrest 3 cm 11 cm 31 cm
Left Toepan 7 cm 12 cm 43 cm
Center Toepan 6 cm 14 cm 45 cm
Right Toepan 5 cm 16 cm 45 cm
Brake Pedal 4 cm 18 cm 36 cm
Left Instrument Panel 0 cm 4 cm 13 cm
Right Instrument Panel 0 cm 4 cm 13 cm
Note: Positive measurement values indicate rearward (x-axis) and upward (z-axis) movement of the
center of the steering wheel. Positive A-B Pillar closure indicates a narrowing of the door opening. Values
for all other measurement locations indicate resultant movement.
29A B C Figure 11. Vehicle and onboard views from Test 1 (64.4 km/h) at 50 ms (column A), 82 ms (column B) when peak vehicle longitudinal acceleration occurs, and 120 ms (column C)
A                                          B                                            C

Figure 12. Vehicle and onboard views from Test 2 (80 km/h) at 50 ms (column A), 60 ms (column B) when peak vehicle longitudinal
acceleration occurs, and 120 ms (column C)
A                                           B                                           C

Figure 13. Vehicle and onboard views from Test 3 (90 km/h) at 50 ms (column A), 64 ms (column B) when peak vehicle longitudinal
acceleration occurs, and 120 ms (column C)
Dummy Kinematic Evaluation and Injury Measures

Restraint system performance and dummy kinematic observations
Table 4 summarizes the timing of the restraint system’s key performance and associated
dummy kinematic observations. Figure 14 shows video frames from onboard high-speed
cameras that correspond to notable kinematic events for Test 1. In Test 1, the occupant
restraint system successfully controlled the dummy’s forward excursion limiting loads to the
head, neck, chest, and lower extremities. The seat belt tensioner deployed at 24 ms (Table 4)
and the frontal airbag deployed at 54 ms into the crash (Figure 14-A). The dummy’s face began
loading the inflated airbag at 88 ms (Figure 14-B). The dummy’s head and torso continued
rotating forward until the dummy started to rebound rearward at approximately 150 ms (Figure
14-C). During the forward excursion, both knees contacted the bottom of the steering column
and the lower legs contacted the knee bolster.

Table 4. Restraint system performance and dummy kinematics

                                                   Test 1    Test 2    Test 3
 Event                                           Time (ms) Time (ms) Time (ms)

 Activation of seat belt crash tensioner             24          26           22

 Deployment of driver frontal airbag                 54          46           44
 Deployment of roof-mounted side curtain
 airbag                                              70          56           52
 Deployment of seat-mounted side thorax
 airbag                                              70          56           52

 Frontal airbag fully inflated                       82          78           74

 Face begins loading frontal airbag                  88          80           78
 Head contacts steering wheel rim through
 frontal airbag                                     n/a          99           90
A B
C D
Figure 14. Test 1 dummy kinematics during forward loading (A at 54 ms and B at 88 ms) and
rebound (C at 150 ms and D at 200 ms)
In Tests 2 and 3, the belt tensioner deployed at approximately the same time as in Test 1 (26
and 22 ms, respectively, see Table 4). However, the frontal airbag deployment time was
approximately 10 ms earlier (Figure 15 – A for Test 2 and Figure 16 – A for Test 3) and the
loading of the dummy face occurred 8 ms – 10 ms earlier (Figure 15 – B for Test 2 and Figure 16
– B for Test 3).
As the dummy continued to move forward into the airbag, the steering wheel rim rotated
upward. The upward steering-wheel motion resulted in little airbag surface area loading the
dummy’s chest, with the airbag primarily loading the head/neck region (the airbag deployed at
optimal position covers the head, neck, and chest). The higher energy in Tests 2 and 3
combined with the steering wheel upward movement resulted in the dummy’s head bottoming
out the airbag (i.e., going through the deployed airbag). This, consequently, resulted in a hard
contact between the face and the steering wheel rim, hub or both at 99 ms in Test 2 (Figure 15
– C & D) and 90 ms in Test 3 (Figure 16 – C & D).
34A B
C D
E F
Figure 15. Test 2 dummy kinematics at airbag deployment (A at 46 ms), face loading the airbag
(B at 80ms), bottoming of the steering wheel (C & D at 100 ms), and rebound (E & F at 150 ms)
35A B
C D
E F
Figure 16. Test 3 dummy kinematics at airbag deployment (A at 44 ms), face loading the airbag
(B at 78ms), bottoming of the steering wheel (C & D at 90 ms), and rebound (E & F at 150 ms)
Injury measures
Appendices B1, B2, and B3 list peak dummy injury measures and timing for each test. Figures 17
– 19 show peak injury measures normalized by Injury Assessment Reference Values (IARV) (i.e.,
dividing the peak recorded values by IARV) for each body region. In Test 1, injury measures for
the dummy were below published IARVs for each body region (i.e., below 100% in Figures 13 –
15), which indicates no severe injuries over the entire body.
36Figure 17. Head and neck injury measures normalized by IARV
37Figure 18. Femur injury measures
Notes: Femur force is shown normalized by IARV and values for knee-thigh-hip (KTH) injuries are shown as
absolute risk of fracture.
The dashed line for KTH injury risk is shown at 5%, which is the IIHS boundary for downgrading KTH injury
measures.
The injury risk for both left and right KTH in Test 1 is 0%.
38Test 1 Test 2 Test 3
200%
180%
Normalized Injury Measures (% IARV)
160%
140%
120%
100%
80%
60%
40%
20%
0%
Figure 19. Lower leg injury measures normalized by IARV
In Tests 2 and 3, the contact through the airbag to the steering wheel rim/hub produced head
accelerations and as a result Head Injury Criterion (HIC15) values greatly exceeded IARVs (i.e.,
greater than 100% in Figure 13). These high HIC15 values are indicative of a high risk (52% –
67%) of facial fracture and severe brain injury (Consumer Information; New Car Assessment
Program, 2008). The peak neck tension seen in Test 3 (4.0 kN of neck axial tension in Appendix
B3) corresponds to a 19% risk of a serious neck injury (Consumer Information; New Car
Assessment Program, 2008).
Peak accelerations to the chest increased with test severity, but the maximum chest
compression was similar between the three tests (27 mm – 30 mm of chest displacement in
Appendices B1, B2, and B3). This was because of the increased loads to the head/neck region in
Tests 2 and 3, which resulted in lower relative loads to the center of the dummy’s chest, where
the sternum deflection sensor is located.
As with other body regions, loads to the lower extremities increased with test severity as well.
Femur force increased in Tests 2 and 3 as shown in Figure 18. Especially in Test 3, very high
peak left femur compressive force and impulse (load duration) indicates a 50% risk of a hip
fracture (femoral neck fracture) (Rupp et al., 2009). The tests with higher impact speed also
produced higher axial forces and bending moments to the lower legs, which resulted in Tibia
39Index values that correspond to a higher likelihood of fracture to the long bones in the lower
leg (tibia, fibula, or both).
Overall Result and Crashworthiness Rating
Figures 20 and 21 show postcrash photos of the vehicle exterior and occupant compartment,
respectively. Overall, as the impact speed of the test increased, the additional occupant
compartment deformations and higher crash energy resulted in higher peak injury measures
recorded by dummy sensors over the entire body region. The increased risks to vital body
regions, such as the head, neck, and chest, are more relevant than those to the lower
extremities in understanding the overall occupant fatality risk.
According to National Highway Traffic Safety Administration (Consumer Information; New Car
Assessment Program, 2008), the injury measures from the baseline test represent a 15% risk of
serious or worse overall injury. Here, a “serious or worse” injury indicates one with a score of 3
or higher on the Abbreviated Injury Scale (AIS) (Associate for the Advancement of Automotive
Medicine, 1990). In contrast, the result from Test 2 indicates a 59% risk, while the result from
Test 3 indicates a 78% risk of serious or worse overall injury.
40Test 1 at 64.4 km/h (40 mi/h)
Test 2 at 80 km/h (50 mi/h)
Test 3 at 90 km/h (55.9 mi/h)
Figure 20. Visual comparison of vehicle exterior between the three tests
41Test 1 at 64.4 km/h (40 mi/h)
Test 2 at 80 km/h (50 mi/h)
Test 3 at 90 km/h (55.9 mi/h)
Figure 21. Visual comparison of occupant compartment between the three tests
42If each test vehicle were rated per IIHS protocols (IIHS, 2006, 2007, 2014, and 2017), only the
baseline test would earn a rating of Good, with Good ratings for the injury, structure, and
restraint and kinematics components that make up the overall rating (Table 5). Tests 2 and 3
would earn a poor overall score, with Test 2 results heavily influenced by the elevated head
injury measures, and Test 3 by elevated injury measures to vital body regions and the heavily
compromised occupant compartment.
Table 5. IIHS Crashworthiness Ratings
Test 1 Test 2 Test 3
64.4 km/h 80 km/h 90 km/h
(40 mi/h) (50 mi/h) (55.9 mi/h)
Overall evaluation
Structure
Restraints & Kinematics
Driver injury measures
Head/neck
Chest
Left leg
Right leg
Note: The overall rating and each measurement for a vehicle’s crashworthiness can be good (G; the highest rating),
acceptable (A), marginal (M), or poor (P; the lowest rating).
43Discussion
This study examined the effects of increasing impact velocity in a frontal offset crash test on a
vehicle with state-of-the-art crashworthiness design that earned a good rating from IIHS. Three
tests were conducted; one at the standard crashworthiness test speed of 64.4 km/h (40 mi/h:
Test 1) and two higher energy tests, one at 80 km/h (50 mi/h: Test 2) and one at 90 km/h (55.9
mi/h: Test 3). The results showed that impact velocities in Tests 2 and 3 increased the kinetic
energy to levels that exceeded the capacity of the vehicle’s energy-absorbing structures. The
remaining crash energy transferred to the occupant compartment resulted in increased injury
severity on the test dummies. This was especially the case for the test vehicle crashed at the
highest test speed (Test 3), which was rated poor for not protecting the driver from severe
injury over all vital body regions including head, neck, and chest. The injury measures from the
baseline test (Test 1) represent a 15% risk of serious or worse overall injury; this risk increased
to 59% for Test 2 and to 78% for Test 3, a 4 and 5 fold increase in serious or worse overall injury
due to fairly modest speed increases.
Several studies have discussed how the crash and injury severities of these tests compare with
real-world crashes. A 1998 study by IIHS showed that the frontal 40% offset crash test at 40
mi/h (the baseline test in the present study) represented approximately 80% of all real-world
crashes with serious (or greater) injuries and one third of all fatal crashes (Nolan et al., 1998).
However, a more recent analysis with only good-rated vehicles suggested the same type of
crash test represents just over 50% of serious injury crashes in the United States (Brumbelow,
2019).
Speeding is prevalent and socially acceptable. Speeding is viewed as less dangerous than other
aggressive driving behaviors, such as red-light running or tailgating. A national survey
conducted by the AAAFTS in 2019 revealed that 64% of respondents perceived switching lanes
aggressively or tailgating as extremely dangerous. Among them, 16% admitted to having done
so at least once in past 30 days before the survey (AAAFTS, 2020). In contrast, only 29%
perceived driving 15 mi/h over the speed limit on freeways as extremely dangerous. Among
them, over 30% admitted to having done so at least once in past 30 days before the survey.
Speeds in the field are, therefore, often significantly higher than posted speed limits and those
used in crash tests. Even after accounting for braking or other factors that decrease impact
speed, some portion of serious injury crashes occur at severities higher than those from these
crash tests.
Nevertheless, speed limits have trended up because more state and local transportation
authorities have increased their posted speed limits to the average travel speeds of vehicles.
These decisions are based on traffic studies that have reviewed prevailing speed profiles, crash
history, roadway geometric designs, pedestrian/bicyclist volumes, etc. Also, the advanced
technology in the automobile industry has proven to contribute to manufacturing good-rated
vehicles that can withstand and protect occupants from severe or fatal injuries during high-
energy impacts. However, this study clearly shows that a relatively small increase in absolute
44speed (5 and 10 mi/h) not only results in more energy to overwhelm the crash energy
management designs of state-of-the-art vehicles significantly, but also proportionally increases
injury risk, raising the likelihood of fatality drastically.
Results from the first phase of this project found that traffic engineers do not necessarily
prioritize safety when changing posted speed limits (Kim et al., 2019). Further, this study
showed that increased vehicle speed would increase drivers’ injury risk. In an era focusing on
efficiency, economy, and mobility, demonstrating the dangers of excessive speeds, educating
about the importance of speed limit compliance, and advocating for the development of safe
driving environments are critical to saving lives on roadways. Therefore, it is recommended that
policy/law makers continue discussing speed limit policies towards improving roadway safety
and practitioners have more safety consideration when setting maximum speed limits.
To continue contributing efforts to mitigating speed-related traffic safety issues, the research
team will further explore how a variety of factors, such as vehicle type, passenger age, size and
location, among others affect the occupants’ injury severity.
45References
Association for the Advancement of Automotive Medicine. 1990. The Abbreviated Injury Scale,
1990 Revision. Des Plaines, IL.
Brumbelow, M.L. (2019). Front crash injury risks for restrained drivers in good-rated vehicles by
age, impact configuration, and EDR-based delta V (Paper No. IRC-19-81). Proceedings of the
2019 IRCOBI Conference, 561–575.
Castillo-Manzano, J. I., Castro-Nuño, M., Lopez-Valpuesta, L., & Vassallo, F. V. (2019). The
complex relationship between increases to speed limits and traffic fatalities: Evidence from a
meta-analysis. Safety science, 111, 287-297.
Consumer Information; New Car Assessment Program, 73 Fed. Reg. 40016 (2008) (Final decision
notice, National Highway Traffic Safety Administration). Retrieved from
https://www.govinfo.gov/content/pkg/FR-2008-07-11/pdf/E8-15620.pdf
Federal Highway Administration, Manual on Uniform Traffic Control Devices for Streets and
Highways, 2009 Edition. Retrieved from http://mutcd.fhwa.dot.gov.
Hackney, J.R. (1993). The effects of FMVSS/No. 208 at NCAP on safety as determined from crash
test results. Proceedings of the 13th International Technical Conference on Experimental Safety
Vehicles, 993–1021. Washington, DC: U.S. Department of Transportation.
Hobbs, C.A. (1991). The need for improved structural integrity in front car impacts. Proceedings
of the 13th International Technical Conference on Experimental Safety Vehicles, 1073–1079.
Insurance Institute for Highway Safety. 2004. Guidelines for using the UMTRI ATD positioning
procedure for ATD and seat positioning (version V). Arlington, VA.
Insurance Institute for Highway Safety. (2006). Moderate Overlap Frontal Crashworthiness
Evaluation Weighting Principles for Vehicle Ratings.
Insurance Institute for Highway Safety. (2007). Moderate Overlap Frontal Crashworthiness
Evaluation Guidelines for Rating Restraints and Dummy Kinematics
Insurance Institute for Highway Safety. (2014). Moderate Overlap Frontal Crashworthiness
Evaluation Guidelines for Rating Injury Measures
Insurance Institute for Highway Safety. (2017). Moderate Overlap Frontal Crashworthiness
Evaluation Guidelines for Rating Structural Performance (Version III)
Insurance Institute for Highway Safety. (2017). Moderate Overlap Frontal Crashworthiness
Evaluation Crash Test Protocol (Version XVIII) Retrieved from
46https://www.iihs.org/media/f70ff6eb-d7a1-4b60-a82f-
e4e8e0be7323/NXIOUQ/Ratings/Protocols/current/test_protocol_high.pdf
Insurance Institute for Highway Safety. (2020). About our tests. Retrieved from
https://www.iihs.org/ratings/about-our-tests
Kahane, C. (1994). Correlation of NCAP performance with fatality risk in actual head-on
collisions (DOT HS-808-061). Washington, DC: U.S. Department of Transportation.
Kallina, I., Scheunert, H., & Justen, R. (1992). Offset tests at Mercedes-Benz, a result of accident
investigation. Proceedings of the 3rd International Conference and Exhibition on Innovation and
Reliability in Automotive Design and Testing.
Kibar, F. T., & Tuydes-Yaman, H. (2020). GIS-based evaluation of the speed limit increase on
urban arterial traffic safety in Ankara. Arabian Journal of Geosciences, 13(12), 1-16.
Kim, W., Kelley-Baker, T. & Chen, K.T. (2019). Review of Current Practices for Setting Posted
Speed Limits. AAA Foundation for Traffic Safety.
Nilsson, G. (2004). Traffic safety dimensions and the power model to describe the effect of
speed on safety (Doctoral dissertation, Lund Univ.).
Nolan, J.M., Preuss, C.A., Jones, S.L., and O’Neill, B. (1998). An update on the relationships
between computed delta Vs and impact speeds for offset crash tests (Paper Number 98-S6-O-
07). Proceedings of the International Technical Conference on the Enhanced Safety of Vehicles
(ESV), 1234–1241.
Rupp, J.D.; Reed, M.P.; Miller, C.S.; Madura, N.H.; Klinich, K.D.; Kuppa, S.M.; and Schneider, L.W.
2009. Development of new criteria for assessing the risk of knee-thigh-hip injury in frontal
impacts using Hybrid III femur force measurements. Proceedings of the 21st International
Technical Conference on the Enhanced Safety of Vehicles (Paper 09-0306). Washington, DC:
National Highway Traffic Safety Administration.
Statista (2019). Projected U.S. vehicle age from 2017 to 2019
https://www.statista.com/statistics/738667/us-vehicles-projected-age/
U.S. Department of Transportation. Bureau of Transportation Statistics. 2018
https://www.bts.gov/topics/national-transportation-statistics
Vadeby, A., & Forsman, Å. (2018). Traffic safety effects of new speed limits in Sweden. Accident
Analysis & Prevention, 114, 34-39.
Wang, X., Zhou, Q., Quddus, M., & Fan, T. (2018). Speed, speed variation and crash
relationships for urban arterials. Accident Analysis & Prevention, 113, 236-243.
47Warner, J., Chawla, H., Zhou, C., & Savolainen, P. T. (2019). Analysis of rural interstate fatality
rates in consideration of recent increases in maximum statutory speed limits. Transportation
research record, 0361198119851758.
Witteman, W.J. (1993). Insufficiency of a single frontal impact test for vehicle crashworthiness
assessment. The 26th International Symposium on Automotive Technology and Automation,
Aachen, Germany: Dedicated Conference on Road and Vehicle Safety, Proceedings.
Yu, R., Quddus, M., Wang, X., & Yang, K. (2018). Impact of data aggregation approaches on the
relationships between operating speed and traffic safety. Accident Analysis & Prevention, 120,
304-310.
Zeidler, F., Sturtz, G., Burg, H., and Rau, H. (1981). Injury mechanisms in head-on collisions
involving glance-off. Proceedings of the 25th Stapp Car Crash Conference, 825–862.
Warrendale, PA: Society of Automotive Engineers.
48Appendix A. Crash Test Dummy Clearance Measures
Manual Measures Notation Units Test 1 Test 2 Test 3
Head to header HH mm 442 447 452
Nose to rim NR mm 483 478 482
Chest to dash CD mm 603 610 608
Rim to abdomen RA mm 241 254 246
Steering wheel to chest, horizontal SCH mm 353 361 361
Steering wheel to chest, reference SCR mm 436 441 444
Hub to chest, minimum HCM mm 338 345 346
Knee to dash, left KDL mm 214 223 224
Knee to dash, right KDR mm 174 215 193
Knee to knee KK mm 298 290 302
Ankle to ankle AA mm 352 355 351
Arm to door AD mm 101 105 100
H-point to door HD mm 155 151 152
Head to A-pillar HA mm 549 545 560
Head to roof HR mm 189 192 183
Head to side window HS mm 256 250 260
Pelvic angle PA degrees 24.5 23.9 24.2
Seat back angle SA degrees 10.5 8.7 10.2
Neck bracket angle NBA degrees 0 0 0
Neck angle, seated NAS degrees 4.2 4.8 4.9
Coordinate Measurement Machine Measures
Striker to head CG, horizontal CGH mm -2195 -2189 -2193
Striker to head CG, lateral CGL mm -450 -447 -447
Striker to head CG, vertical CGV mm 842 843 840
Striker to H-point, horizontal SHH mm -2331 -2326 -2322
Striker to H-point, vertical SHV mm 191 198 188
Striker to knee SK mm 580 569 574
Torso recline angle TRA degrees 11.8 12 11.2
Striker to knee angle SKA degrees 0.3 0.7 0.5
49Depicted Crash Test Dummy Clearance Measures with Notations
50You can also read