Improving presentations with the program 'Visual Molecular Dy- namics' by controlling the display with button navigation windows
←
→
Page content transcription
If your browser does not render page correctly, please read the page content below
Improving presentations with the program ’Visual Molecular Dy-
namics’ by controlling the display with button navigation windows

P.Schellenberg, Institute of Physical High Technology Jena,
Albert-Einstein-Str. 9, D–07745 Jena

http://www.ipht-jena.de/BEREICH_3/lectures/biovis_en.html

Introduction

A picture tells more than a thousend words, and this applies even more to three dimen-
sional presentations. With VMD [Humphrey et al.(1996), Stone et al.(2001)] and related
programs like Rasmol, Pymol, Swiss Pdb Viewer, Chimera etc. and plug-in’s to inter-
net browsers like Chime and Jmol, one can basically get a 3D -presentation of biological
molecules on a computer screen. Since the function of biomolecules is, to a large extend,
determined by structure, such a representations helps very much in the understanding
of the molecular basis of the biochemical function. Therefore, if the structure of a new
biomolecule is published, a standardized structure file (*.pdb) is deposited at the RCSB
protein data bank, that is publicly accessible via the internet [Berman et al.(2000)]:
http://www.rcsb.org/pdb/
The program ’Visual Molecular Dynamics’ is -among other features, a fairly sophisticated
tool for displaying biomolecules. Nice presentations of proteins or nucleic acids can be
created even by unexperienced users in a fairly short time from protein data bank files.
By taking advantage of the scripting capability of VMD, user controlled navigation win-
dows can be added, that contain buttons for switching between different presentations and
selections of the protein displayed. This feature is particularly useful for talks and class-
room demonstrations. There are much more sophisticated scripts for VMD around, but
the script code used in the provided examples is designed to be easily adaptable to your
needs.
This is not supposed to be a thorough introduction into VMD or script programming
in general, but merely a description of the example script files which are provided and
how to quickly adapt these or create them on your own. However, to give you a quick
start, some very basic steps concerning the usage of VMD are also described. If you
have problems with these instructions, please seek advice from the manuals, that are
provided with the program. VMD automatically creates script files that contain your
presentation, and on this level you do not have to bother with the syntax of these files.
However, if you want to add control windows, for example with navigation buttons, or
if you want to include animations, you have to add code manually. As far as possible,
I tried to keep the syntax of this code as readable as possible, and if you stick to the
system provided, you may transfer the code to your own examples without really knowing

                                             1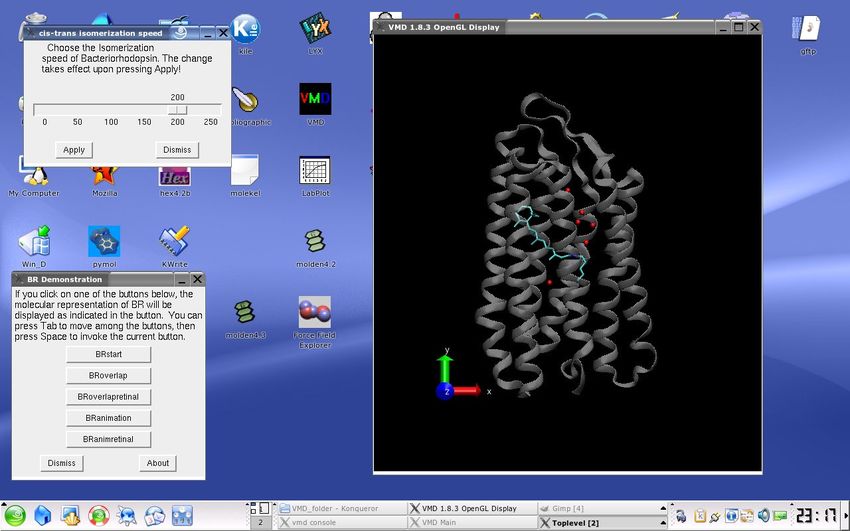
much about programming or the used scripting language TCL/TK. However a basic un-
derstanding about the structure of higher computer languages is of considerable advantage.

How to get started

To get a quick introduction into the visualization of biomolecules, I included example script
files ready to use with VMD. Most of these scripts produce additional windows with navi-
gation buttons or explanation parts to faciliate their use in the classroom. The basic idea
is to show different preprepared biomolecule representations of one or more biomolecules
by just selecting the appropriate button. By pressing a particular button, many of the
representations defined in the first step can be switched on and off at once. The main
advantage of the navigation buttons and other tools provided here is to quickly change
between different, even complex composite presentations of your system very quickly and
without worrying about getting lost. An analogue method of depicting biomolecules and
to provide an e-learning environment was first applied in connection with the browser plu-
gin Chime. Some biochemistry and biophysics teaching resources and the fifth edition of
the biochemistry book by Berg, Tymoczko and Stryer use chime to visualize biomolecules.
However, the usability of chime is limited to the windows operating system and often
on unsecure or outdated browser versions. There are unofficial ways of installing it with
Netscape 8, Mozilla and Firefox, and even under Linux [?], but these methods are not foul-
proof. In contrast, VMD works as a standalone program under Linux, Mac and Windows,
and the script files included here correspondingly work on all these operating systems .
The selection of protein and nucleotide structures chosen as examples is biased and is not
in any way representative. The selection was merely based on

   • personal taste and interest
   • the content of the lecture Biophysical Chemistry in the Department of Biochemistry
     in Jena, where some of the examples have been used
   • biomolecules, that demonstrate particularly well the usage of certain molecular rep-
     resentations

To start with, you have to download VMD from

http://www.ks.uiuc.edu/Research/vmd/ .

VMD can be used without charge in academia and education, but please check the licence
agreement! Note, that you have to register on the UIUC - website prior to downloading.
There are also user manuals [Caddigan et al.(2005)] available, although much of the pro-
gram is self explaining. VMD is available for various flavours of Unix, including Linux, and
for Mac OS and Windows ! The script files provided with this text can be used without
limitation, in particular you are encouraged to alter the files to fit your demands. I would
appreciate getting a notification, if and how you use the program.

                                             2
After installation you are ready to use VMD. You can load pdb files under File – New
Molecule, and create your own protein presentation starting from the pdb-file. A good
start would be to go to Graphics – Presentations and then play around with the options.
You can create multiple representations each of which is listed in one line and switch them
on and off as required to visualize different aspects of the protein. For example, on one
hand you may wish to show the overall structure of the protein, on some other stage, you
want to show the cofactors or a specific enzymatic site of the proteins in detail. This can
be done by switching the respective representations on and off. Many other parameters
can also be changed, like colors, background colors, the perspective and even the number
and angle of lights that illuminate the protein.
The presentations can be saved as automatically created script files: File – Save State,
which creates a *.vmd -file. The file can be reloaded by using File – Load State. The
code is written in a standard scripting language called Tool Command Language (TCL)
[Ousterhout(1995)] with extensions specifically designed for use with VMD. Alternatively,
python can also be used. See the VMD manual [Caddigan et al.(2005)] for details. The
script files are pure ASCII code and can be modified, for example by including the above-
mentioned button navigation window.
The script files distributed with this text are provided in the compressed file
vmdscripteng.tar.gz resp. vmdscripteng.zip with identical content. There
are also zipped files with the same content available (vmdscriptger.tar.gz resp.
vmdscriptger.zip), but with most of the explanation texts in german. To keep the
following text clear, I assume the english version is used. By uncompressing the file you
get a folder vmdscripteng with the vmd -script files, and a subfolder with the required
pdb -files. Copy the folder vmdscripteng to your own folder structure. The name of the
vmd–file should give you information about the featured protein. If you are uncertain, you
can check the corresponding pdb –file or the list of examples below.
To start with, go to File – Load State. Under Linux/Unix, you can also start one of the
Tcl/Tk shell scripts provided, which opens a button list with selected presentations. You
can also modify these scripts.
Most of the vmd- scripts have button windows included, which is indicated by the name
like gfpbutton.vmd, or provide animations indicated correspondingly. As a test system,
the Photosystem II is used to demonstrate the usability of different schemes like hypertext
or radiobuttons with a longer explaining text. This concept resembles the one often used
in connection with Chime.
Some proteins, like those employed in light detection, show a dynamic behavior upon
photoexcitation. This is often a cis -trans isomerization via multiple intermediates. The
structure of the longer living intermediates can be resolved in time dependent X-Ray and
are published in the pdb -data bank. Such a dynamics can be visualized as animation in
VMD by aligning the respective pdb files in a movie–like fashion. There are example script
files for Bacteriorhodopsin, Photoactive Yellow Protein, Phototropin and a photoswitchable
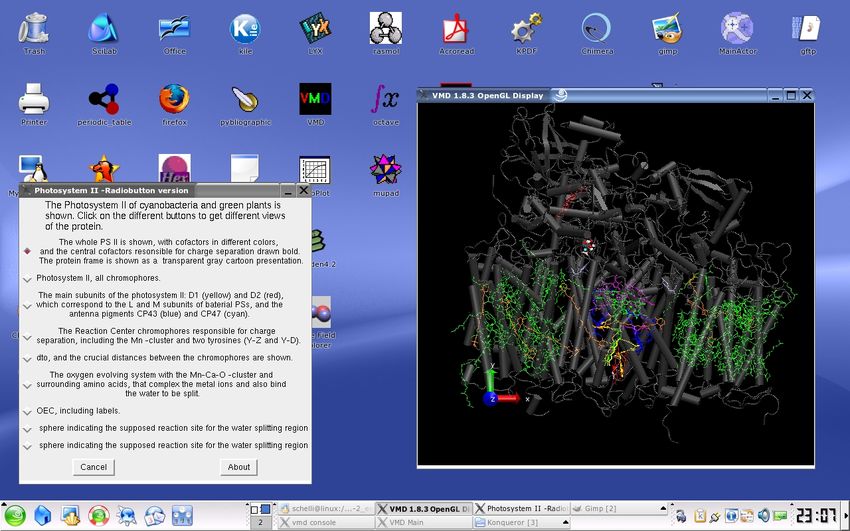
GFP variant included. Fig. 1 and 2 show screenshots for illustration, the first one a text
control, the second one plain buttons and an animation with speed control.
3Figure 1. Photosystem II with radiobuttons window
Figure 2. Bacteriorhodopsin with buttons and animation speed window
4The second showmore screenshots are available online:
http://www.ipht-jena.de/BEREICH_3/lectures/vmdscreenshots.html
.
A brief introduction, how these files are created is provided, and you may use the scripts
and modify for your own purposes. Note that you can only alter the presentations, which
include self-programmed code like buttons, by editing the script source code. If you just
save these scripts via File – Save State, you will not keep the button window and the
animation features, but just get the file with the presentations that were used prior to
adding the code.
Very important: The script files provided in the folder vmdscripteng are ready to use
under Linux, likely also under other Unix versions. You just have to unzip the compressed
file to your folder, to get /home/myname/vmdscripteng. If you use windows, you have to
edit all the *.vmd script files and alter all lines in the vmd -files that refer to the path to
the respective pdb files. Often, this is more than one line per scriptfile, in particular, if
more then one structure is loaded ! If you have a decent editor, you can load all VMD
scripts and use the replace command for all of these files at once. Editors with this ca-
pability are, for example, the freeware editors notetab-light (http://www.notetab.com)
or crimson editor (http://www.crimsoneditor.com) and the shareware editor winedt
(http://www.winedt.com). Again, be sure to replace all lines with path informations
in the file. Use forward–slashes! For example alter lines like
mol new vmdscripteng/pdbfiles/1s5l.pdb type pdb waitfor all
to
mol new C:/users/myname/vmdscripteng/pdbfiles/1s5l.pdb type pdb waitfor all
otherwise the pdbfile will not be found and you get numerous error messages in the terminal
window. All and only path lines contain the word vmdscripteng, you may search for this
word. With a Mac, you have to act correspondingly. Sorry for the inconvenience but unlike
to Unix, a relative path is not recognized under Windows, and since I do not know how
you arranged your folder hierachy, there is no way of giving a generally valid path. If you
think, it is worth writing an installation script, you are welcome to do so and I gladly
include it into the example files.
If you have to change the path under Linux for any reason, you can use the editor jedit in
the same manner, or use the command line:
sed -i -e ’~s|vmdscripteng/|home/myname/vmdneudir/|’ *.vmd
5The examples
A short description of the used example follows. Usually, the examples contain an addi-
tional button window and upon clicking on one of the buttons, a particular presentation
of the protein or parts of the proteins becomes visible. The button names are cryptic,
but should give you an indication what is presented. There are also some radiobutton
and text files include several lines of text for each of the clickable presentations, making it
more suitable for self–teaching. This is similar to the system often used in connection with
chime. I did not consider it meaningful to give a thorough explanation to each button in
this text, since I consider the presentations self–explaining. The color associations, labels
or other features mentioned in the file descriptions below may not be visible in all button
presentations, but only in those that show the presentation described. Just play around !
antibodybutton.vmd:
pdb–files: 1fdl.pdb, 1igj.pdb, 1igt.pdb, 1ndg.pdb, 1yqv.pdb
Antibodies are the naturally occuring proteins of the immune system. The antibodies
bind to specific antigens. To be able to respond to a large variety of antigen structures,
the antibodies consist of a hypervariable part which is the loop region at the end of
the FAB fragments, and is colored red in this demonstration. Upon starting the script
or clicking on the first button, a complete antibody with the heavy and light chains
distinguished by color is shown. The next two buttons show an FAB, that binds to a small
ligand (digoxin) by partly burying the steroid. The other buttons show three different
monoclonal antibody FAB fragments that bind to different epitopes of lysozyme and the
last button presents a structural overlap of these three ligands. To align the lysozyme
FABs, the RSMD algorithm is employed see alinea ’Overlapping proteins’. In VMD
1.8.3, there was a bug, that prevented the protein from being displayed correctly, when
employing representations like ribbons or cartoon. A workaround is to save the missing
part of the structure in a seperate file. This bug has been fixed in VMD 1.8.4., but the
special syntax is retained in this example.
L.J.Harris, S.B.Larson, K.W.Hasel, J.Day, A.Greenwood, A.McPherson, The three-
dimensional structure of an intact monoclonal antibody for canine lymphoma, Nature vol.
360, p. 369, (1992)
A.T.Brunger, Solution of a FAB (26-10)/digoxin complex by generalized molecular
replacement, Acta Crystallogr.,Sect.A, vol. 47, p. 195, (1991)
T.O.Fischmann, G.A.Bentley, T.N.Bhat, G.Boulot, R.A.Mariuzza, S.E.V.Phillips,
D.Tello, R.J.Poljak, Crystallographic refinement of the three-dimensional structure of the
FAB*D1.3-*Lysozyme complex at 2.5-Angstroms resolution, J.Biol.Chem., vol. 266, p.
612915, (1991)
Y.Li, H.Li, F.Yang, S.J.Smith-Gill, R.A.Mariuzza, X-ray snapshots of the maturation of
an antibody response to a protein antigen, Nat.Struct.Biol., vol. 10, p. 482, (2003)
aptamerbutton.vmd:
pdb–file: 1hao.pdb
Aptamers are oligonucleotides that are selected in an artificial evolution process for
specific properties, like a specific catalysis or to bind to a specific epitope of a protein.
The binding of a 15mer DNA-aptamer to Thrombin is shown. There also exists a 29mer
aptamer that blocks another exosite of thrombin, for which no structure exists. However
its binding site is indicated by coloring.
K.Brejc, T.K.Sixma, P.A.Kitts, S.R.Kain, R.Y.Tsien, M.Ormo, S.J.Remington, Structural
basis for dual excitation and photoisomerization of the aequorea victoria green fluorescent
protein, Proc.Nat.Acad.Sci.USA, vol. 94, p. 2306, (1997)
M.Ormo, A.B.Cubitt, K.Kallio, L.A.Gross, R.Y.Tsien, S.J.Remington, Crystal structure
of the aequorea victoria green fluorescent protein , Science, vol. 273, p. 1392, (1996)
atpsynthaseanimation.vmd (contributed by Christopher Bruhn :
pdb–files: 1c17.pdb, 1e79.pdb, 1l2p.pdb, 2a7u.pdb
ATP-synthase is a large trans-membrane complex that exploits a proton gradient across
the membrane to produce ATP from ADP In the frame of the process, parts of the protein
rotates in this process.
bacteriorhodopsinanimation.vmd:
pdb–files: 1IW6.pdb, 1IXF.pdb, 1IW9.pdb, 1UCQ.pdb
Bacteriorhodopsin is found in certain archaebacteria like Halobacterium halobium, that
florish in highly concentrated salt solutions. This system is likely the only photosynthetic
protein that is unrelated to the common chlorophyll based photosynthetic systems, but
instead has similarities to the rhodopsin proteins of vision processes in animals. Upon
light illumination, bacteriorhodopsin pumps protons across the bacterial membrane by
isomerization of the Bacteriorhodopsin chromophore. The proton gradient in return
drives ATPase. Although the protons are not seen in X-ray diffraction, the dislocation
7of the associated water oxygens during the photocycle can be seen by aligning the
X-ray structures from intermediates, that can be identified. The animation with the
aligned structures is available by pressing the animation buttons. Note that only the
five most significant oxygens are shown in this animation. Similarly to the mechanism
in vision pigments like bovine rhodopsin, phytochrome or photoactive yellow protein,
a cycle with multiple transition states can be observed. First, the intermediates were
observed by transient optical and IR –spectroscopy, and lately, the structure of some of
the intermediates were identified by time –resolved X–ray diffraction. These structures
drawn in different colors in the script are created by utilizing 1IW6.pdb (white), 1IXF.pdb
(red), 1UCQ.pdb (green) and 1IW9.pdb (blue), corresponding to the spectroscopically
distinguished intermediates ground state, K, L and M, respectively.
T.Kouyama, T.Nishikawa, T.Tokuhisa, H.Okumura, Crystal structure of the L intermedi-
ate of bacteriorhodopsin: evidence for vertical translocation of a water molecule during the
proton pumping cycle, J.MOL.BIOL., vol. 335, p. 531, (2004)
K.Takeda, Y.Matsui, N.Kamiya, S.Adachi, H.Okumura, T.Kouyama, Crystal structure of
the M intermediate of bacteriorhodopsin: allosteric structural changes mediated by sliding
movement of a transmembrane helix, J.MOL.BIOL., vol. 341, p. 1023, (2004)
Designerproteinbutton.vmd:
pdb–files: 1QYS.pdb
α–β –protein structure, computationally designed novel fold. This structure is also used
to explain, how you get from an atomic structure to an abstract protein representation.
A calculated density map is also included.
B.Kuhlman, G.Dantas, G.C.Ireton, G.Varani, B.L.Stoddard,D.Baker Design of a novel
globular protein fold with atomic-level accuracy, Science, vol. 302, p. 1364, (2003)
ElongFactortrnabutton.vmd:
pdb–files: 1TTT.pdb
The presentation shows a protein - t-RNA complex, namely the loaded Phe –t-RNA
and the EF–TU elongation factor. This example serves to demonstrate how to display
structural features of RNA.
P.Nissen, M.Kjeldgaard, S.Thirup, G.Polekhina, L.Reshetnikova, B.F.Clark, J.Nyborg,
Crystal structure of the ternary complex of Phe-t-RNAPhe, EF-TU, and a GTP analog,
Science, vol. 70, p. 1464, (1995)
8gfpbutton.vmd:
pdb–files: 1emb.pdb
Green Fluorescent Protein originates from the jellyfish Aequorea victoria. Unlike to other
chromoproteins, that use separate cofactors, the chromophore in GFP is produced from
three adjacend amino acids by an cyclization and oxidation step, and the only neccesity
to do so is the presence of oxygen. It is easily expressed in E. coli and often used as a
tandem protein marker. The protein has a barrel like structure consisting of 13 beta sheets
and the chromophore fixed in the inside. Today, many mutations exist, that tune the
wavelength of the chromophore, and recently there have been similarly structured proteins
discovered in sea corals, that extend the color range even to the red of the spectrum. The
chromophore is part of an extensive hydrogen bonding network, that is partly responsible
for the optical properties of GFP. For example the wt-GFP undergoes an excited state
proton transfer (ESPT) that shifts the emission with respect to absorption by more than
100 nm from blue to green.
K.Brejc, T.K.Sixma, P.A.Kitts, S.R.Kain, R.Y.Tsien, M.Ormo, S.J.Remington, Structural
basis for dual excitation and photoisomerization of the aequorea victoria green fluorescent
protein, Proc.Nat.Acad.Sci.USA, vol. 94, p. 2306, 1997
M.Ormo, A.B.Cubitt, K.Kallio, L.A.Gross, R.Y.Tsien, S.J.Remington, Crystal structure
of the aequorea victoria green fluorescent protein , Science, vol. 273, p. 1392, (1996)
gfpswitchanimation.vmd:
pdb–files: 1a53.pdb, 1a56.pdb
This animation shows a GFP analogue protein, which can reversibly photoswitched
between a non–fluorescent and a fluorescent state. The protein usually rests in the
non–fluorescent trans state, but upon illumination with green light, it photoisomerizes
into a fluorescent cis state. The back reaction is induced by illumination with blue light.
Such a photoswitchable protein can for example be used for protein tracking or has been
used in Ground State Depletion Microscopy. The animation included shows the underlying
cis–trans isomerization of the GFP variant.
M.Andresen, M.C.Wahl, A.C.Stiel, F.Graeter, L.Schaefer, S.Trowitzsch, G.Weber,
C.Eggeling, H.Grubmueller, S.W.Hell, S.Jakobs Structure and mechanism of the reversible
photoswitch of a fluorescent protein, Proc.Natl.Acad.Sci.USA, vol. 102, p. 13070 (2005)
Crystal structures and molecular mechanism of a light-induced signaling switch: The
PHOT-LOV1 domain from CHLAMYDOMONAS REINHARDTII, Biophys. J., vol. 84,
p. 2474 (2003)
9hollidayjunction.vmd:
pdb–files: 1CRX.pdb, 2CRX.pdb, 3CRX.pdb, 4CRX.pdb, 1P4E.pdb
F.Guo, D.N.Gopaul, G.D.Vanduyne Structure of cre recombinase complexed with dna in a
site-specific recombination synapse, NATURE vol. 389, p. 40 (1997)
P.A.RICE,Y.CHEN The role of the conserved trp330 in flp-mediated recombination.
functional and structural analysis J.BIOL.CHEM. vol. 278 p. 24800 (2003)
phototropinanimation.vmd:
pdb–files: 1n9l.pdb, 1n9o.pdb
Phototropin is a blue light receptor. Unlike to many other light sensing proteins, the
mechanism is not based on a cis-trans isomerization process, but instead on the forming
of a covalent bond between the flavin chromophore and a sulfur atom in its neighbborhood.
R.Fedorov, I.Schlichting, E.Hartmann, T.Domratcheva, M.Fuhrmann, P.Hegemann,
Crystal structures and molecular mechanism of a light-induced signaling switch: The
PHOT-LOV1 domain from CHLAMYDOMONAS REINHARDTII, Biophys. J., vol. 84,
p. 2474 (2003)
psIIbutton.vmd:
pdb–files: 1s5l.pdb
The vmd files are identical in representation of PhotosystemII, however, they are distin-
guished by the button presentation: psIIbutton shows the common buttons with just a
keyword, making it most suitable for classroom demonstrations. The psIIradiobutton.vmd
and the psIItext.vmd include several lines of text for each of the clickable presentations,
making it more suitable for self–teaching.
Photosystem II is a large protein containing around 100 cofactor units most of which are
chlorophylls (green) and carotenoids (orange), and additionally hem groups (red), carbon-
ates (pink) and a manganese–calcium–oxygen cluster depicted as atoms. It is one of the
two reaction center types of cyanobacteria and green plants (the other one is Photosystem
I]. PSII is responsible for oxygen evolution by splitting water. The photosystem consists
mostly of 23 transmembrane helixes and is embedded in the tylacoid membrane in plants.
The chromophores are embedded in this ensemble of helixes. The central part, the D1 D2
-fragment colored ocre and red has a similar structure as the bacterial reaction centers and
the chromophores are drawn with thicker lines compared to the other chromphores of the
photosystem. The special pair is colored in violet, and the monomeric chlorophylls and
10pheophytins are colored green and blue, resp. The ubichinones are drawn in yellow. The
D1 D2 -fragment is surrounded by antenna pigments, in particular CP43 (blue) and CP47
(cyan) Above the membrane the oxygen evolving system can be found. It contains 4 Mn,
4 O and 1 Ca –atom and is surrounded by mostly acidic amino acids, that complex the
ions. Two tyrosin are also crucial for the functioning of the reaction center, in particular
TYR 161, chain A, that functions as a transient electron donor / acceptor between the
OEC and the special pair. The region indicated by a yellow shere represents the region in
which the water splitting takes place.
K.N.Ferreira, T.M.Iverson, K.Maghlaoui, J.Barber, S.Iwata, Architecture of the photosyn-
thetic oxygen-evolving center, Science vol. 303 p. 1831 (2004)
pypanimation.vmd:
pdb–files: 1S1Y.pdb, 1S1Z.pdb, 1OTB.pdb
Photoactive Yellow Protein (PYP) from Ectothiorhodospira Halophila is a relatively small
light detection protein that causes positive or negative phototaxis in certain bacteria
dependent on the excitation wavelength. The central process is a cis –trans isomerization
upon excitation of the chromophore. The isomerization works via a so –called hula–twist
motion. This way the dislocation of the aromatic ring is diminished and becomes possible
within the constraints of the protein cage. PYP serves as a model for cis–trans isomer-
ization steps in proteins, and can be compared to the much more complicated systems
like rhodopsin, bacteriorhodopsin or phytochrome. The different structures are overlayed,
with the ground state 1otb.pdb (blue), the time resolved X-ray structures taken from
10 to 500 ns 1s1z.pdb (yellow) and the structure taken from 10 µs to 3 ms 1s1y.pdb (violet)
S.Anderson, S.Crosson, K.Moffat, Short hydrogen bonds in photoactive yellow protein,
Acta Crystallogr. Sect.D, Vol. 60, p. 1008, (2004)
S.Anderson, V.Srajer, R.Pahl, S.Rajagopal, F.Schotte, P.Anfinrud, M.Wulff, K.Moffat,
Chromophore conformation and the evolution of tertiary structural changes in photoactive
yellow protein, Structure, Vol. 12, p. 1039 (2004)
rclh1button.vmd:
pdb–files: 1pyh.pdb, 1kzu.pdb
This file contains two related proteins,which are structurally very much related. The first
protein is bacterial reaction center from Rhodopseudomonas Palustris and the surrounding
light harvesting complex LC I. The second protein is the LH-II complex from (Rhodopseu-
domonas Acidophila), which surrounds the RC -LH I complex. The chromophores are
11usually named according to their absorption wavelength as Bacteriochlorophyll B 800,
B850 and B875. The first two are present in LHII aranged in two rings, the latter, B875
is present as a one ring arrangement in LHI. The redshift of wavelength from outside to
inside is like an energy funnel, in which energy is collected and followingly transferred
to the reaction center by Förster Resonance Energy Transfer. For years there was a
discussion going on about the nature of a strong coupling of the B850 chromophores
in LHII (and accordingly in LHI). Due to recent single molecule studies, this could be
evaluated.
A.W.Roszak, T.D.Howard, J.Southall, A.T.Gardiner, C.J.Law, N.W.Isaacs, R.J.Cogdell,
Crystal structure of the RC-LH1 core complex from rhodopseudomonas palustris., Science
vol. 302 1969 (2003)
ribosomebutton.vmd:
pdb–files: 1jgp.pdb, 1giy.pdb
The ribosome from Thermus Thermophilus is shown, composed of two pdb–entries. The
pdb file 1jgp.pdb shows the path of messenger RNA through the ribosome. It contains the
30S ribosome subunit, three t-RNA and one m-RNA molecule. The file 1giy contains the
50S ribosome subunit. The ribosome complex is the largest biomolecular structure resolved
so far. The resolution is around 5 A , not exactly atom–resolution, but still good enough
to sketch the structure. It is composed of two subunits, which resemble the function of the
head of a tape reader. The biomolecule is composed of several large RNA, called ribosomal
RNA, that not only provide for structural integrity, but also act as ribozomes, and of
several proteins. In the center between the two subunits, the transformation from m-RNA
to protein takes place. A small strip of m-RNA is shown, which is attached to three
t-RNAs, which mediate the translation. There is another file that shows a t-RNA in detail.
M.M.Yusupov, G.Z.Yusupova, A.Baucom, K.Lieberman, T.N.Earnest, J.H.D.Cate,
H.F.Noller, Crystal structure of the ribosome at 5.5 A Resolution, Science, vol. 292, p.
883, (2001)
G.Z.Yusupova, M.M.Yusupov, J.H.D.Cate, H.F.Noller, The path of messenger rna through
the ribosome, Cell, vol. 106, p. 233, (2001)
You can find other examples for vmd-presentations in the folder VMD-lecture, that are
not connected to a button control window, but are used for demonstrating how to display
certain types of molecules.
12How to create button controlled presentations
This is a brief introduction, how to create the VMD - files including buttons in a relatively
short time. You can quickly produce nice representations for your own use and apply
alterations to these presentations easily by switching them on and off in the Graphics
Representation window. However, the change between different representations may take
too much time in the classroom or during similar demonstrations, while you would rather
like to spend this time with explanations. In these cases, the fast change between different
presentations by just clicking on buttons is useful. For example, by just pressing one
buttons you can switch back and forth from a general presentations of a protein like a
ribbon presentation to a detailed molecular view of a region of interest. Furthermore
the button based approach allows you to use features like overlying structures from time
resolved X-ray. In the following paragraphs, I include a short description how buttons
and animations can be included into a VMD script quickly. Briefly, the idea is to first
take advantage of the built -in automatic script creation by VMD, and followingly edit
the created script to include the button control.
Preparatory Arrangements
First you have to load all pdb files and produce all presentations which you want to show at
some stage. You have to do this by loading the molecules in the New Molecule dialog and
create the presentations in the Graphics Presentations dialog. It does not really matter,
which of these you switch to visible or invisible. However, it is a good idea to eventually
switch those to active, that you want to be presented directly after loading the script. Save
the script and exit VMD.
In the second step, you take this automatically created script and add support for the
buttons window manually by using an external editor. You may copy and past the program
code given in the button scripts provided, add it to your own files and modify it according
to your needs. The code in the provided example button files is split into the automatically
created part and the part containing the code for the buttons. In the example files, the
two parts are strictly separated, which faciliates transfer. The end of the automatically
created and the beginning of the edited part of the code is separated by comment lines.
To modify the button controll panel, you have to alter the name of the buttons and the
actions correlated with every individual button. Although I tried to keep the code as
readable as possible you may need some knowledge of the general structure of computer
languages. Some minimal knowledge of TCL/TK [Ousterhout(1995)] would also be an
advantage, especially if you wish to modify your scripts beyond a pure transfer of the
examples provided. The button creating code consists of two parts that I tried to keep
separated as far as possible. One part creates the buttons window and manages the click
events, the other one contains procedures with the actions you want to have performed.
In the button window part these procedures are called by clicking on the corresponding
button. In principle you need not really know, what is going on, as long as you stick to
the script and just fill in the appropriate button names and actions.
13The employed windows
This part consists of several procedures, the first of which (and least important one) is
aboutbox. This procedure is executed upon pressing the About button in the button
window.
# aboutBox --
#
# Pops up a message box with an "about" message
#
proc aboutBox {} {
tk_messageBox -icon info -type ok -title "Reaction Center LH1 complex" \
-message " This is a message text in the about window "
}
The second procedure (proc positionwindow w) positions the button window on your
computer screen and the code that follows creates the button window including all the
buttons. as displayed in the figure
proc positionWindow w {
wm geometry $w +300+300
}
set w .button
catch {destroy $w}
toplevel $w
wm title $w "PSII-LHI -Complex Demonstration"
wm iconname $w "button"
positionWindow $w
label $w.msg -font $font -wraplength 4i -justify left -text "Description."
pack $w.msg -side top
frame $w.buttons
pack $w.buttons -side bottom -fill x -pady 2m
button $w.buttons.dismiss -text Dismiss -command "destroy $w"
button $w.buttons.about -text "About" -command "aboutBox "
pack $w.buttons.dismiss $w.buttons.about -side left -expand 1
button $w.b1 -text "Title of Button" -width 15 \
-command "proc_to_be_executed "
button $w.b2 ........
button $w.b3 ........
14pack $w.b1 $w.b2 $w.b3 -side top -expand yes -pady 2
You can certainly include more than the three buttons, but beware of too complicated
button menues. If it makes sence you can also include several commands to be executed
when a button is pressed, including calls to more than one procedure, definition of variables
and conditional structures.
button $w.b4 -text "Title of button" -width 15 \
-command {
set bool_var 0
proc1_to_be_executed
proc2_to_be_executed
if $bool_var {destroy .hscale}
}
This pattern is employed in connection with animations.
Inclusion of button commands
The procedures called upon pressing buttons are defined in a second section. In these pro-
cedures you can switch on and off different grapical representation that you defined before
and saved as the abovementioned automatically created VMD script file. An example for
the lines of code representing a particular presentation are as follows:
mol new vmdscripteng/pdbfiles/1otb.pdb type pdb waitfor all
...................
mol representation Tube 0.100000 20.000000
mol color ColorID 0
mol selection {all}
mol material Opaque
mol addrep top
mol selupdate 2 top 0
mol colupdate 2 top 0
mol scaleminmax top 2 0.000000 0.000000
mol smoothrep top 2 0
mol drawframes top 2 {now}
mol showrep top 2 0
.....................
# done with molecule 1
This is the tube presentation of all of protein 1otb.pdb, the protein number is 1 (which
means it is the second protein loaded into VMD] and it is presentation number 2. The line
15showrep top 2 0 means it is not shown upon starting the script, but instead is switched on
at a latter stage when activating the resp. buttons.
You can switch on or off every presentation by referring to the resp. molecule number and
presentation number by using the command mol showrep moleculenumber presentation-
number on/off
You first define a procedure that switches off everything to Reset your graphical presenta-
tion.:
proc Reset {} {
label hide Atoms all
label hide Bonds all
set j 0
while {$j < 32} {
mol showrep 0 $j off
incr j
}
}
The purpose of this procedure is to get a well defined starting point prior to switching on
some presentations. This way, You than collect all representations that you wish to switch
on upon calling the resp. procedure. These procedures are usually those that you call by
pressing a button :
proc Proteinstart {} {
Reset
mol showrep 1 0 on
mol showrep 1 4 on
}
proc Proteinmany {} {
Reset
set j 0
while {$j < 17} {
mol showrep 1 $j on
incr j
}
}
16proc Showchromophores {} {
Reset
foreach i {3 5 6 9 10 12 13 16} {
mol showrep 1 $i on
}
}
The first example simply switches presentation 0 and 4 on without using loops. This is
convenient if there are only few presentations to be switched on. The second example
employse a while loop to switch on all graphical presentations from number 0 to 17. The
counter j does not need to start at zero. The third example employs the loop structure
foreach to switch on graphical presentations number 3, 5, 6, 9, 10, 12, 13 and 16. The
procedures are applied to molecule number 1.
Instead of using buttons you can also use radiobuttons or a sort of clickable hypertext,
and I provided examples for this. As an example I used the presentation of Photosystem
II to show this. The script files are psIIradiobutton.vmd and psIIhypertext.vmd . The
action upon selection of a button resp. a radiobutton or hypertext is identical, and solely
the button window layout is different.
Overlapping structures
If you want to create an animation file or otherwise want to compare structures, you
have to overlay the different structures. There are several ways to achieve this, and most
methods are based on the the RSMD algorithm. One way is too keep the original pdb-files
and include a procedure in the vmd-script that overlaps the structures. This is done by
selecting those parts of the protein, that are identical, and apply the RMSD- algorithm.
This way, the algorithm does not consider those parts of the protein that are different,
like the hypervariable regions of an antibody or the differently bound antigen. This way
is followed in the file antibody.vmd:
# The following is code to align the three lysozyme antibodies.
# For details check the VMD user manual!
#
set sel0 [atomselect 0 "backbone and (residue 5 to 85)"]
set sel1 [atomselect 1 "backbone and (residue 5 to 85)"]
measure rmsd $sel0 $sel1
set transformation_matrix [measure fit $sel1 $sel0]
set move_sel [atomselect 1 "all"]
$move_sel move $transformation_matrix
17set sel2 [atomselect 2 "backbone and (residue 5 to 85)"]
measure rmsd $sel0 $sel2
set transformation_matrix [measure fit $sel2 $sel0]
set move_sel [atomselect 2 "all"]
$move_sel move $transformation_matrix
set sel3 [atomselect 3 "backbone and (residue 5 to 85)"]
measure rmsd $sel0 $sel3
set transformation_matrix [measure fit $sel3 $sel0]
set move_sel [atomselect 3 "all"]
$move_sel move $transformation_matrix
The other way is to load the pdb-files in question and followingly apply the RSMD algo-
rithm from the VMD -Extensions menue:
Extensions > Analysis > RMSD calculator
or by using
Extensions > Analysis > Multiple Alignment
Upon execution, the pdb–files are rearranged, and you may save these rearranged coordi-
nates by using File > Save Coordinates from the VMD–menue.
There is also the option of overlapping or arranging the different structures manually. In
this case, you have to activate the fixed flag in the VMD main panel for all structures but
one, followingly move that structure with respect to the fixed structures and then save
the rearranged file as above.
Including Animations
Some proteins exhibit a specific time -dependent behaviour, for example upon excitation
by light. The chromophores of light detection proteins such as Photoactive Yellow Pro-
tein or Rhodopsins undergo a cis–trans isomerization upon light excitation, that afflicts
the whole protein. For some of these proteins, time resolved X–ray structures are available
and one can produce an animation by aligning the pdb–files belonging to the distinct struc-
tures. This is done in the script files pypanimation.vmd, bacteriorodopsinanimation.vmd
and phototropinanimation.vmd. The animationspeed in these scripts is set via a user–
controlled horizontal scale in a separate window. There was a specific problem concerning
the termination of the animation upon pressing a non–animation button, which is exam-
plarily illustrated in the script bacteriorodopsinanimation problemdemo.vmd. The only
fix to this problem is to check in every instance, if another button is pressed. To this end,
new functions were defined that are equivalent to the standard VMD commands, but check
for a changed button. For example, the command ’mol showrep molnr presnr on’ was
replaced by the command ’molshowAnim molnr presnr on’ which is defined as:
18proc molshowAnim {molnr presnr status} {
global stopanim
if {! $stopanim} {mol showrep $molnr $presnr $status}
}
This ensures synthax compatibility with the original VMD-commands. If you know a
better way to solve the problem, please let me know!
Other issues
There are some bugs in VMD, particularly in the versions prior to VMD 1.8.4, that made it
necessary to employ workarounds. Sometimes presentations based on the protein backbone
recognition like tube, trace, and the ribbons and cartoon presentations do not show the
protein structure correctly. In short, part of the structure is not shown. That happens in
case of the antibody 1igt and the ribosome structure. In both cases the workaround is to
extract the wrongly displayed part of the protein resp. RNA structure into a new file (for
example 1igt B chain.pdb, 1igt D chain.pdb) and separately load these into VMD. In case
of the antibody, the program seemingly got confused at the interchain disulfide bridges,
and is fixed in version 1.8.4.
Another problem encountered in versions prior to VMD 1.8.4 is the handling of alternative
structures contained in one file, which according to protein data bank regulation is the
altloc definition. This altloc definition is not recognized in old VMD versions and bonds
are drawn between atoms of separate structures, provided these are within the appropri-
ate radius defined by VMD. For example, Photoactive Yellow Protein contain alternate
structures from time -dependent X-ray in one file. The solution in this case is to select all
atoms belonging to one or the other structures for each presentation, which is fairly time
consuming.
The syntax of script files, that were created prior to the release of VMD 1.8.4 is kept as
mentioned above. While their syntax is more complicated, the files work fine under new
versions of VMD. However, new files will be implemented to run with VMD 1.8.4 and
may not work properly in old versions of VMD.
Some final remarks
Note that you can not save the manually edited script from within VMD, since all the
added features are going to be lost. You basically get your starting script back. You can
change representations directly by editing the parts by hand, but this is more difficult to
do.
There are more procedures defined that may be useful to you, for example one that creates
a sphere indicating the water splitting region in Photosystem II. Just take a look at the
examples.
19Acknowledgement
This work is based on the program ’Visual Molecular Dynamics’ from the University of
Illinois at Urbana-Champlain, and freely available to the scientific and educational com-
munity. I am thankful to the development team of VMD and the participants of the VMD
mailing list, in particular to John Stone for his responsiveness to problems, I encountered. I
am also thankful for people that tested the script and for their advice and contributions to
improve my teaching activities, by name Christopher Bruhn, Wolfgang Fritzsche, Matthias
Görlach, Karl Otto Greulich, Paulius Grigaravicius, Ayman Al Remawi and Sven Peters.
I am thankful to the students of the class ”Biomolecules: Databanks, Visualisations and
Computations” for their feedback, which helps improving the lecture.
References and Notes
[Berman et al.(2000)] H.M. Berman, J. Westbrook, Z. Feng, G. Gilliland, T.N. Bhat,
H. Weissig, I.N. Shindyalov, & P.E. Bourne (2000). ‘The protein data’. Nucleic Acids
Research 28:235–242.
[Caddigan et al.(2005)] E. Caddigan, J. Cohen, J. Gullingsrud, & J. Stone (2005). VMD
User’s Guide. Theoretical Biophysics Group, University of Illinois and Beckman Insti-
tute.
[Humphrey et al.(1996)] William Humphrey, Andrew Dalke, & Klaus Schulten (1996).
‘VMD – Visual Molecular Dynamics’. Journal of Molecular Graphics 14:33–38.
[Ousterhout(1995)] J.K. Ousterhout (1995). TCL und TK. Addison–Wesley, München,
Bosten, San Fransisco etc.
[Stone et al.(2001)] John Stone, Justin Gullingsrud, Paul Grayson, & Klaus Schulten
(2001). ‘A system for interactive molecular dynamics simulation’. In John F. Hughes &
Carlo H. Séquin (eds.), 2001 ACM Symposium on Interactive 3D Graphics, pp. 191–194,
New York. ACM SIGGRAPH.
20You can also read