IN NIGER AGRICULTURE AND FORESTRY - March 2009
←
→
Page content transcription
If your browser does not render page correctly, please read the page content below
A GRICULTURE AND FORESTRY
          IN NIGER

 PRESENT SITUATION AND ISSUES
      FOR DEVELOPMENT

         March 2009
Preface

  This study report is the Niger version of the series of “country studies” published by the
Association.

  In order to contribute to the agricultural and forestry development overseas, and implement
the agricultural and forestry development overseas, when various cooperation projects are
planned and formulated. In the formulation and implementation of these projects, it is
indispensable to precisely acknowledge the politics, economy, society, nature and culture of
the country concerned, and is needed to correctly understand the issues for economic and
social development of the country.

  The current series of studies intend to specify the role of Japan in cooperation and its
future direction concerning the subject countries, through sorting out the present situation of
economy and society of the developing countries, and their issues of agriculture, forestry and
food situation

  In this version, among the African countries, the Republic of Niger was selected among
the African countries which have increasing importance in official development assistance of
Japan.

  Major industry in Niger consists of traditional agriculture and livestock, and uranium
mining which is an important export commodity for foreign currency earning. Almost 80% of
the total population depends on the agriculture and livestock, but due to the harsh natural
condition of scarce rainfall less than 150mm /year for 3quarters of the total area, food
shortages and rural poverty are the perennial problems in this country. Further, decreasing
forest and expanding desertification are the source of concern and the country is ranked at
174 th among 177 countries on Human Development Index of UNDP 2007 Report. Thus the
improvement of natural and socio-economic environment and sustainable agriculture and
rural development are urgently required.

  It is strongly hoped that this report will contribute to clarify the current socio-economic
situation and issues to be addressed in the field of agriculture/ forestry, food and rural
development. Further, the report is expected to provide basic information for the
consideration of future development cooperation of Japan in these fields.

                                            March 2009
                                            Hisao AZUMA
                                            President
                                            Japan Association for International Collaboration
                                            of Agriculture and Forestry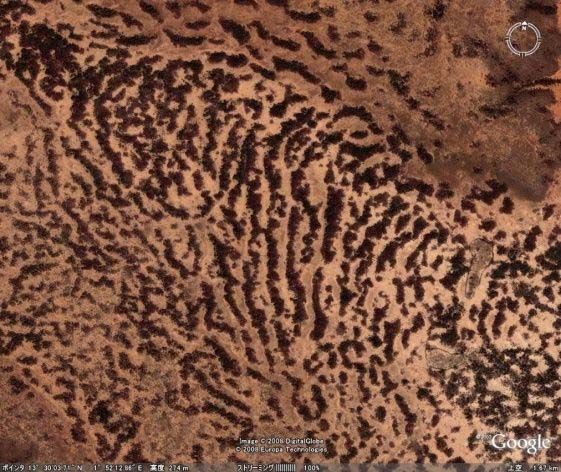
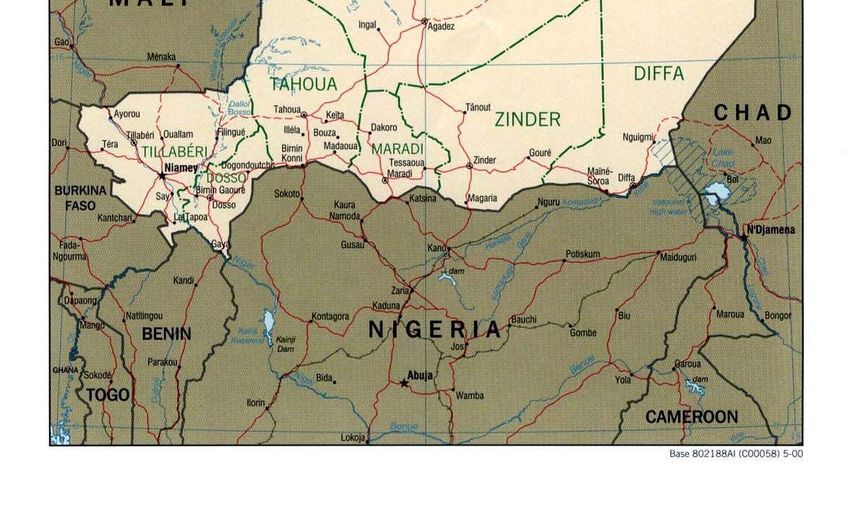
National boundary
Regional boundary
National capital
Regional capital
Railroad
Road
Track
Table of Contents

Preface

Chapter I. National Economy and Agriculture/ Forestry ....................................................... 1
    1. Structural Characteristics of Economy......................................................................... 1
        1) Structure of industry .............................................................................................. 1
        2) International trade.................................................................................................. 1
        3) Constraints on the economic growth ...................................................................... 3
        4) Recent economic trend ......................................................................................... 6
    2. Target of Development and Status of Agriculture and Forestry.................................... 7
        1) Poverty Reduction Strategy(PRS) ..................................................................... 7
        2) Accelerated Development and Poverty Reduction Strategy (ADPRS)..................... 8
        3) Rural Development Strategy(SDR)and problems to be tackled .........................10

Chapter II. Trend of Agriculture and Forestry Development ................................................12
    1. Current Situation of Agricultural Production ..............................................................12
        1) Agricultural system .............................................................................................12
        2) Types of agriculture and current situation of production .....................................15
    2. Theme and Target for Agricultural Development........................................................36
        1) Theme of agricultural development .......................................................................36
        2) Targets established recently by the Ministry of Agricultural Development............37
    3. Support System for Agricultural Production ...............................................................38
        1) Law and regulation on land and rural areas ...........................................................38
        2) Agricultural credit system .....................................................................................39
        3) Farmers organizations , agriculture cooperatives .................................................40
        4) Marketing of agricultural products ........................................................................41
    4. Current Situation of Livestock Industry and the Issues for Development ..................41
        1) Current situation of livestock ..............................................................................42
        2) Themes of livestock industry ..............................................................................45
    5. Trend of Forestry .......................................................................................................46
        1) Forest areas...........................................................................................................46
        2) Classification of forest (natural forest ) by types...................................................47
        3) Forest products .....................................................................................................49
    6. Trend of Fisheries ......................................................................................................50

Chapter III. Japan’s Development Cooperation on Agriculture and Forestry ......................54
    1. Japanese Cooperation in General ................................................................................54
    2. Performance of Japanese Development Cooperation on Agriculture and Forestry .......55
    3. Major Agriculture and Forestry Projects and their Performance..................................57
        1) Study on Sahel Oases Development ....................................................................57
        2) Anti-desertification projects..................................................................................60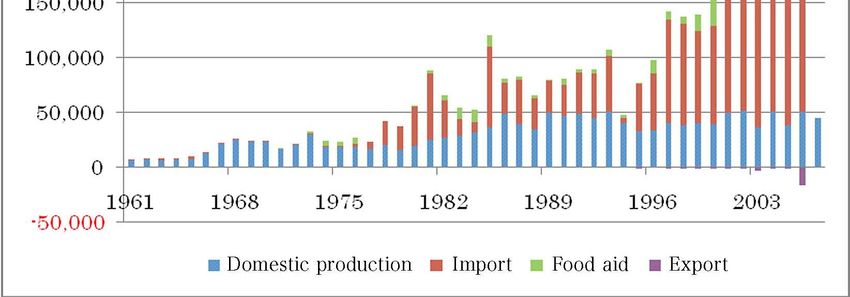
3) JOCV activities in Kareye-Gorou ..........................................................................61
   4) Grant Assistance for Underprivileged Farmers (ex-2KR) ......................................62
   5) Increase of Food Production (ex-KR: Kennedy Round) .........................................64
   6) Cooperation by NGOs, universities and others ......................................................64
4. Needs in Enforcement of the Program Approach ........................................................64
CHAPTER I. NATIONAL ECONOMY AND AGRICULTURE/ FORESTRY

1. Structural Characteristics of Economy

1) Structure of industry
  In 2005, with per-capita income of $244 per year, the Republic of Niger ranked 174th among
177countries by HDI: Human Development Index (UNDP 2007) and is considered as one of the
poorest countries in the world. Major industries are agriculture (livestock and cereal production) and
uranium mining which share around 40% of GDP and 80% of export earnings. About 90% of the
population engage in the primary sector.
  Since the independence in 1960 to 1980’s, the share of the primary sector in GDP has been
decreasing (Ref. Fig. I.1). This reflects the rapid development of the industrial sector owing to the
opening of uranium mining.
  Since 1990’s, primary sector increased its GDP share gradually, but this has had not so much the
positive implication, because it was due to the decline of other sectors and increased crop production
to meet the demand for food of increasing population. Secondary sector based on uranium is
characterized by the rapid growth in 70’s, followed by stagnation later. Since 2004, international
market price of uranium has been soaring but no significant change in export quantity was observed
and its share in GDP is gradually declining. As for tertiary sector, the GDP share recorded peak in
80’s and retain high share though stagnated. Informal sector is said to have 80% of GDP and seems to
provide significant contribution to the actual economic activities of the country.

         (%)
       80

                                                                                               Agriculture
                                                                                               農業
       60                                                                                      Mining /Industry
                                                                                               鉱工業
                                                                                               Services, etc.
                                                                                               サービス他

       40

       20

        0
             '60-'64 '65-'69 '70-'74 '75-'79 '80-'84 '85-'89 '90-'94 '95-'99 '00-'04 '05-'07

                     Fig. I.1 Trend ofFig.
                                        GDPI.1 Trend
                                               Sharesofby
                                                       GDP  Shares
                                                          Sector   by Sector (1960-2007)
                                                                 (1960-2007)

2) International trade
  Major export commodities are, in addition to uranium, agricultural products including livestock. In
the initial stage after independence, her export commodities consisted mainly of cotton and livestock

                                                   1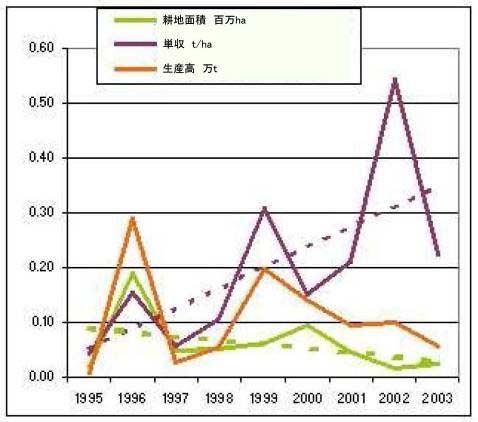
products such as meat and hides of cattle and sheep, following the pattern of the colonial days. Later in
1967, uranium deposits were discovered and then in 1977 production and export of refined uranium
started. Since then, mining sector has prospered and most of the export earning depended uranium.
  However, due to the hovering international market price of uranium in 1980’, export of uranium had
stagnated. In 1994, for a limited period just after devaluation policy taken, production had increased
temporally, but again in 1999 its export turned to declining trend. Further, since 2004, due to soaring
international price of uranium, its production and export has been on upward trend. In spite of unstable
situation of uranium production and export as observed, there exist no major alternative export
commodities to uranium as yet and uranium remains as a single important enterprise covering more
than 50% of the total export earnings (Table11). From 2005, gold used for craft products has been
included in export commodity in statistics. This resulted in the increase in share of mining sector in
total export.

                  Table I.1 Export of major commodities (2005-2007)              (Billon. FCFA)
                                 2002     2003     2004       2005       2006       2007             (%)
    Uranium                       62.5     65.6     70.1       78.5       79.6      142.8           69.8
    Gold                             -        -        -       30.0       20.0       28.3           13.8
    Livestock                     27.4     26.7     22.6       19.8       21.2       16.8             8.2
         (Cattle)                  9.3     11.1     10.3       10.3       10.5        8.7          (4.3 )
         (sheep)                   7.8      6.4      5.2        3.3        3.8        3.9          (1.9 )
    Agricultural Products         17.6     16.4     11.2       16.4       14.2        8.6             4.2
         (Cowpea)                  2.5      1.6      2.1        1.3        1.0        0.8          (0.4 )
         (Onion)                  13.1     12.6      8.1       13.8       11.7        6.8          (3.3 )
    Others                        10.1      7.5      7.5       15.7        9.3        8.1             4.0
    Source: INS (2005, 2008)

  Major export destinations of uranium are France followed by Japan. Livestock are mostly exported
to Nigeria. Additionally, onion is exported to Cote d’Ivoire and other neighboring countries
(ECOWAS).
  As for import commodities, food and food related items including cereals, oil and fat and processed
food are dominant. According to FAO Statistics, in 21007, about $240 mil. of agricultural products
were imported of which 40% were cereals headed by rice (Table1.2). Mineral products, notably
petroleum follows food in import (Table1.3).

                 Table I.2 Export/ import of agricultural products                   (Million $)
                            2000         2001       2002       2003        2004         2005            2006
 Agr. Export Total           91.0         58.3       76.9       81.6        90.3         69.2            70.5
 Agr. Import Total          115.3        146.0      171.8      189.8       218.4        257.7           238.0
      Cereals                37.2         57.0       64.7       54.1        86.4        121.4            88.8
      Wheat flour             8.6         11.2       12.8       13.0         9.1         11.2             9.8
      Maize                   2.5          1.5        2.5        2.4        10.5          7.5             4.4
      Rice                   24.2         39.6       47.8       37.7        56.9         94.0            63.7
  Source: FAOSTAT

                                                   2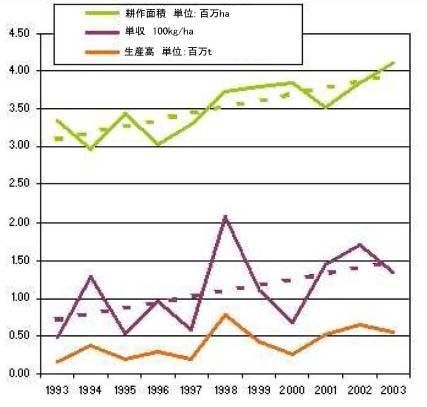
Table I.3 Import by commodity (1998-2002)                         (Million FCFA)
Commodity                                     1998        1999         2000             2001      2002     (%)*
Food grain and fresh food                   39,495       30,100       32,931       48,969       50,522     18.8
Mineral products and petroleum              28,506       27,934       33,836       38,652       50,348     18.7
Processed food                              25,483       23,436       24,944       31,652       28,754     10.7
Chemical products                           23,147       18,342       23,730       21,212       25,242      9.4
Oil and Fat                                 14,439       16,619       13,133       15,656       19,600      7.3
Machinery and equipment (Electrics)          6,907        8,801        6,821        9,075       17,684      6.6
Transportation and traffic materials        14,777       13,925       13,582       15,356       16,235      6.0
Machine and equipment (Ex. Electric)        15,759       16,811       10,296       16,836       10,805      4.0
Non metal and non metal products             8,408        8,620        7,635        8,782        9,722      3.6
Textile and textile products                 9,146        7,121        9,377        7,966        9,357      3.5
 *Share in 2002
 Source: CEDEAO

  Trade balance of Niger has been chronically negative (Table I.4). In recent years, Niger has nearly
achieved self sufficiency for pearl millet and sorghum, but in the year 2005 just after the severe
draught, self-sufficiency ratio dropped to 85% (Secrétariat permanent de la SRP 2008). As the next
important cereal, rice is imported from Pakistan, China, Vietnam and other Asian countries and
Nigeria. From Nigeria, in addition to rice, industrial and mineral products are also imported. Dairy
products are mostly from Europe, headed by France and Netherland. Sugar had been mostly from
France in the past, but in recent years, import from Brazil has been gradually increasing (ECOWAS).

                          Table I.4 Trade balance (2001-2007)                             (Billion FCFA)
                      2001         2002        2003           2004              2005             2006       2007
 Export                 119        117.5       116.1            128             164.7           143.9        205
 Import               238.1        275.1       287.2          330.4             361.2           414.3        416
 Balance             -119.1       -157.6      -171.1         -202.4            -196.5          -270.4       -211
Source: INS (2005, 2008 (1)

3) Constraints on the economic growth
(1) Natural condition
  Most of the agricultural products in Niger are crops for self sufficiency such as pearl millet and
sorghum grown under rain-fed condition. These crops cover about 70% of the total cultivated area.
Other crops such as onion, cowpea and cotton, important as export commodities, are also grown under
the rain-fed condition. As around 65% of the total area have less than 100mm/ year rainfall on average,
cultivated area is only 3.5% of the total land area of the country. Irrigation facilities are provided to
only 1.6% of the cultivated area (FAO).
  Impacts of climate change in recent years in Africa are serious, particularly in Niger, as is
located in the southern border of Sahara Desert. Drought and flood damages have occurred repeatedly.
Most recently in 2004, minor drought caused damages to self sustaining food and cash crops
production (Fig. I.2). In this year, in addition to drought, outbreak of desert locust caused damages to
self sustaining cereal crops by more than 20% in some areas, leading to serious food shortages in the
following year.

                                                     3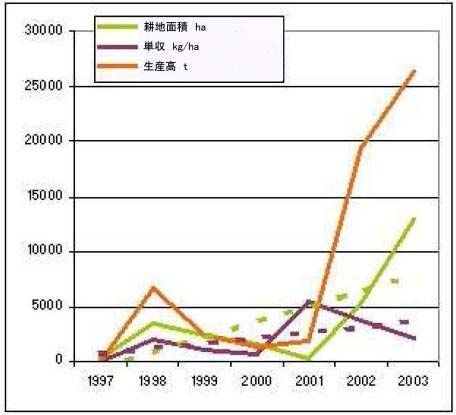
(mm/year)                                                                           (thousand t)
            1200                                                                     800

                                                                                     600
               1000
                                                                                     400

                 800                                                                 200

                                                                                     0
                 600
                                                                                     -200

                 400                                                                 -400

                                                                                     -600
                 200
                                                                                     -800

                   0                                                                 -1000
                        '90   '92     '94     '96    '98   '00   '02    '04    '06

              rainfall (mm/year)            pearl millet     sorghum          cowpea         onion*
         *onion: Total production in the country

             Fig. I.2   Agricultural Production and Rainfall (Maradi Region 1990-2006)

  Decreasing arable land and forest by the progressive desertification are noted. The level of water
flow of Niger river, the single most important river with perennial flow, has been declining and rising
temperature leads to increased transpiration. Torrential downpower within a short period and seasonal
wind bring disaster of soil erosion. Agriculture and livestock, which have more than 40% of GDP
share, are exposed always to these risks.

(2) Geographical condition
  Niger is an inland country surrounded by other countries. Distance from the capital Niamey to
Cotonou, the nearest port city is about 1,000km and to Abidjan of Cote d’Ivoire is more than 1,500km.
Water level of Niger river is not high enough to accommodate the navigation of big vessel, and
extensive Sahara Desert hinders the transportation to the northern Africa. Therefore transportation
depends mainly on upland route to the south. Compared to other coastal countries of Gulf of Guinea,
naturally cost and time for commodity trade are invariably high. Agricultural products for export are
mainly consumed in the region and so it is suited for land transportation. In contrast, rice and wheat
flour are imported with additional inland transportation cost. Therefore market prices of these
commodities are comparatively higher than in other countries.
  Transportation of uranium for export and import of equipment for uranium production depends on
the inland transportation. Due to road condition and others, bulk transportation seems to be difficult.
  As for domestic transportation, with vast national land area of 3.4 times of Japan, development of

                                                      4
transportation network seems to require huge amount of investment and time. As more than half of the
land areas are in desert, whether sustainable benefit is expected to meet the investment needs to be
considered, taking into account the survey/investigation results on petroleum and other mineral
resources deposit.

(3) Population growth
    Average GDP growth rate from 2002 to 2006 was 3.9%/year and the rate of inflation in the same
period was 1.9% /year. In spite of the food crisis of 2005, the performance of economic growth was
quite near to the target of 4.0%. Meanwhile, population growth rate remained very high with
3.1%/year in ‘90s and in 2006 this has risen to 3.4%. Therefore, total population which was 8 million
in 1991, is now 13 million, more than 1.6 times in 2006 (World Bank 2008). Due to this pressure of
population increase, actual GDP/capita growth of 2002-2006 remains at only 0.6%/year (Secrétariat
permanent de la SRP 2008).
    Population growth has also resulted in the negative impact through subdivision of land by
inheritance, shortened fallow period, deforestation and overgrazing, together with expanding
desertification, all of these being contributing factors to deterioration of agricultural environment and
stagnated economic growth. According to FAO estimate, 70,000-80,000ha of forest or pastureland are
being reclaimed for farmland every year (FAO 2005).

(4) International demand/supply situation
    As stated earlier, major export commodities are mineral products, notably uranium. Cotton is
another important export commodity though its share in total export earning is limited. As the prices
of these commodities highly depend on the demand/supply situation of the international market and
fluctuate highly, the sector has fragility which cannot be solved by domestic industrial policy
measures alone. Fig. I.3 shows production, export and price of uranium in recent years. Export price of
uranium in ’90 had been in declining trend1, but in recent years it has been rising due to the increased
international demand. Time lag between production and export is observed. This might be due to the
lack of infrastructure and personnel system to quickly respond to the demand from abroad. Anyway,
as production and export are controlled by overseas demand, cautious investment attitude seems to be
continued.

1
  In Fig.I.3, sharp rise of price in 1994 is observed. This is due to the devaluation of the currency in that year. As
the value of the currency declined to half, actual price could be said to have decreased.

                                                          5
(thousand t) (FCFA/kg)
5 30000
25000
4 20000
15000
3 10000
5000
2 0
'90 '92 '94 '96 '98 '00 '02 '04 '06
Production quantity Export quantity Average export price (FCFA/kg)
Source: INS (2008)
Fig. I.3 Trends of production, Export and Price of Uranium
(5) Political situation
Since her independence, Niger has experienced repeated military coup d’etat and internal strifes.
Changes of administration by 3 military coup d’etat occurred. In 1999, the President backed by army
at that time was assassinated at the airport. And since the military confrontation in 1990, between the
state power and nomadic tribe Tuareg a number of revolts has been occurring, showing unstable
security situation in the country.
Since the inauguration of Presidency by Mamadou Tandja on January 2000, political stability has
been recovered, but on February 2007, anti-government party called Niger Justice Movement
(Mouvement Nigérien pour la Justice: MNJ)started revolts in various parts of the country by
explosion of mine and attacks to uranium investigation facilities. In combat with state army in August
2008, many casualties were recorded. The Government has issued alert for northern area on August
2007 but since then combat remains to continue.
Revolt by MNJ this time was based on their belief that they were politically discriminated and they
wanted the profit of uranium export to be returned to the northern area. As the northern area has No.2
large uranium deposits in the world, deterioration of security situation over there has serious
consequence to economic growth of the country. Again, in this area he dotted Sahara Desert is the
world famous tourist destination. Since revolts in this area rural inhabitants depending on the sale of
handicraft have seriously hit by decrease of visitors.
4) Recent economic trend
Record low of GDP growth of 0.8% by minor drought in 2004 caused food crisis in the following
year. However, since then the climate has been moderate and agricultural production has been better off.
6Together with the favorable situation of mining sector, GDP growth rate of 2005-2007 recorded
5.4%/year (Table1.5). On August 2007, the Government adopted Accelerated Development and
Poverty Reduction Strategy : ADPRS in which average annual GDP growth rate was set for 2008-2011
at 5.7%, though World Bank forecasts it at 5.0%, taking note of the performance of 2007 at 3.2%
(World Bank2008).
As for foreign debt, taking the debt rescue measures of IMF’s expanded HIPCs Initiatives applied on
December 2000 as the opportunity, the Government has started action for debt issue. By obtaining loan
from Poverty Reduction/Growth Facility (PRGF), the Government has tackled economic reconstruction
through public finance and smooth implementation of the Poverty Reduction Strategy since 2002. This
has been highly evaluated and thus in February 2004, Niger has achieved to reach Completion Point
(CP) of HIPC’s. Based on this performance, most of the donors, both bilateral and multilateral, agreed
to give up the claim. In addition, through Multilateral Debt Relief Initiative (MDRI), IMF, African
Development Bank and others gave up claims of $300 million in total. By these rescue measures,
foreign debt decreased in 2006 more than 60% from the previous year of $800 million. Based on the
favorable appraisal by IMF on the performance, additional PRGF has been provided in 2005 and 2008.
Further in 2008, USA agreed to extend credit of Millennium Challenge Account (MCA).
Quite recently, China has extended credit of $300million for oil factory (petroleum refinery). Since
2004, in the midst of soaring international price of mineral resources led by uranium, (gold, iron ore,
copper, tin, lime, coal, phosphorous etc), investment from abroad are increasing, giving a positive
prospect to Niger’s economy.
Table I.5 Major macro economic indicators (2001 - 2007)
2001 2002 2003 2004 2005 2006 2007
GDP Annual growth rate (%) 7.1 3.0 4.4 -0.8 7.4 5.2 3.2
GDP growth rate per capita (%) * 1.9 -0.1 -4.1 3.9 1.5 *
GNI per capita ($) 170 170 200 220 250 270 280
GNI PPP per capita ($) 530 530 570 570 600 630 630
Inflation rate (%) 4.0 3.0 -2.9 0.6 6.8 1.8 3.0
Debt overseas (Million $) 1587.4 1786.5 2069.9 1973.1 1979.9 805.0 *
Source: World Bank (2008), INS (2005, 2008) * lack of data
2. Target of Development and Status of Agriculture and Forestry
1) Poverty Reduction Strategy (PRS)
In 2000, Niger was approved as a country to be rescued by HIPC’s Initiatives.
By this, Niger could obtain PRGF’S loan from IMF but also was required to accept a number of
obligation as a precondition of this loan. One of these commitments is the formulation of the Poverty
Reduction Strategic Paper (PRSP). PRSP consists of policies and programs the Government intends to
implement on macro-economic, financial and social development issues, for the economic growth and
poverty reduction. It also includes necessity of loan from abroad. It took 2 years for the preparation of
7PRSP and on January 2002, Poverty Reduction Strategy was officially announced.
In line with the Millennium Development Goals (MDGs) of the U.N. adopted on September 2000,
PRS aims to reduce ratio of poverty to 50% by the year 2015 as a primary goal of the strategy,
including comprehensive issues such as stabilization of macro-economy, improved access to social
services and infrastructure, improved governance, economic development led by private sector,
capacity building etc. Basic principles of sector-wise strategies were also prepared in PRS and wide
ranges of strategic documents have been issued. (Table I.6)
2) Accelerated Development and Poverty Reduction Strategy (ADPRS)
The Government of Niger prepared ADPRS, which was the 2nd Poverty Reduction Strategy, on
August 2007. This was submitted to the Donors’ Meeting at Brussels on October of that year and
accepted as the sole and common framework for the development assistance by donors. The ADPRS
document reviews the performances of PRS from 2002 to 2006 and indicates development goals and
targets for the following 5 years. In ADPRS review, such social development indicators as, decrease in
infant mortality, increased enrollment of primary school, improved access to safe drinking water were
well appreciated, and decentralization, improvement of governance and monitoring of the
development policies by the establishment and operation of National Statistics Institute (INS) were
noted as the remarkable performance. However, review also pointed out that as economic growth
highly depended on unstable agriculture that was vulnerable to climatic conditions, actual economic
growth remained low and, in addition to such important sectors as education, health, drinking water
and energy, new development needs for transportation, information and communication were
emerging and thus delayed in achieving MDGs. As the contributing factors, insufficient economic
growth, population increase, lack of fund for infrastructure and others, inefficient program
implementation, lack of human resources and organizational capacity for the implementation of the
development policies were raised. Further, such issues were also pointed that the opportunities for
consultation were limited after adoption of PRS among concerned parties, monitoring works were
concentrated to the Government, participation of citizen in monitoring were limited, official
announcement of the results was not enough etc.
Based on the examination study, mid-term review was decided to be made by 5 years (2008-2012)
against 3 years of the previous one, so as to actively implement poverty reduction strategy on the
medium and long term perspectives, and prepared Action Plan to be closely linked and coordinated to
the regional programs of MDGs and NEPAD. In the Action Plan, various indicators to be achieved in
2012 were presented and to achieve these indicators, 7 strategic guidelines were reconstructed (Table
I.6). On Agriculture/Rural Development, in 1.1 (Promotion of economic growth factors with high
potentials of job creation), it is elaborated in detail referring to Rural Development Strategy (SDR).
However, for the implementation of the Action Plan, as 72.1% of the required fund is expected to
depend on foreign resources, assistance from overseas seems to be the key for realization of the plan.
8Table I.6 Comparison of the framework of PRS and ADPRS
Poverty Reduction Strategy (PRS) Accelerated Development and Poverty Reduction
Strategy(ADPRS)
Overall goal Overall goal
Reduce poverty ratio to 50% by 2015 Reduce poverty ratio to 50% by 2015
Specific goals and strategic guideline Strategic goals
1. Ensure steady and sustainable growth 1. Explore dynamic, diversified, sustainable and
1.1. Set out a stable macro-economic framework employment-created growth
1.2. Ensuring sustainable growth in rural 1.1. Promote economic growth with high potentials
production and creating job opportunity
1.3. Taking maximum advantage of opportunities 1.2. Promote development on local basis
offered by the regional integration. 1.3. Strengthen macro economic framework
1.4. Improving public finance management policy 1.4. Strengthen global competitiveness of Nigerien
1.5. Private sector promotion economy
2. Developing the productive sectors 1.5. Participate in regional and global markets
2.1. Rural sector and food security 1.6. Promote art and culture
2.2. Infrastructures, mines and energy 2. Equitable access to Social services with high
2.3. Private sector, tourism and handicraft quality
3. Ensure access to basic social services by the 2.1. Promote education and vocational- technical
poors training
3.1. Education 2.2. health improvement
3.2. Water and Sanitation1) 2.3. Reduce undernourishment
3.3. Health HIV/ Aids 2.4. Improve access to drinking water
3.4. Access to safe water and sanitation 2.5. Urban and Habitat development and sewage
3.5. Urban development treatment
4. Improve governance and strengthening human 2.6. Improve access to modern energy services
and institutional capacity 2.7. Promote regular employment and income
4.1. Improving governance generation activities
4.2. Transparency and corruption control 3. Control population growth
4.3. Strengthening human and institutional 3.1. Reproductive health, family planning・
capacity 3.2. Countermeasures to early marriage and every
4.4. Developing Information and communication possible female discrimination
technology 3.3. Make customary of breast feeding for the health
of mother and baby
3.4. Enlighten opinion leaders and communities on
improving measures related to child delivery
4. Reduce inequality and strengthen social protection
to vulnerable groups
4.1. Ensure gender equality
4.2. Ensure Child Protection
4.3. Support healthy growth of the youth
4.4. Develop social protection to deprived groups
4.5. Forecast the risk of natural disasters
5. Development of infrastructure
5.1. Transportation
5.2. Information communication technology
5.3. Increase energy supply
5.4. reinforce public heritage
6. Promotion governance of high quality
6.1. Strengthen political governance
6.2. Enhance the rule of law and judiciary reform
6.3. Strengthen administrative governance
6.4. Improve economic governance
6.5. Strengthen local governance
6.6. Social participation
7. Effective Implementation of the ADPRS
7.1. Improve formulation of public policy
7.2. Augmented and Effective Allocation in line with
the priority set by ADPRS
7.3. Provide high quality services to the poor
97.4. Establish monitoring/ evaluation system by
rewarding rules.
7.5. Strengthen manpower, facility and organizational
structure
7.6. Risk management and forecast
Note1) Duplication is observed with Strategy "3.4." but followed original text.
Source: Secrétariat Permanent de la SRP 2002 and 2007.
3) Rural Development Strategy(SDR)and problems to be tackled
The preparatory work of Rural Development Strategy (SDR) had started on December 2001, just in
advance to the adoption of Poverty Reduction Strategy (SDR) with participatory manner by various
actors involved in rural development, such as the Government, donors, producers’ organizations,
NGOs and others with their active discussions. Through these discussions and works, SDR was
officially adopted on December 2003 by the Government.
The SDR defines outline of the strategy, general goals, strategic principles, expected results, and
adds 14 sectorial programs led from the consideration on rising problems and their courses of solution.
(Fig I.4)
Overall targets are shown in the form of required indicators to achieve the goals of Poverty
Reduction Strategy. To achieve this, 3 specific targets are set in the form of 3 strategic principles.
These principles are ①Improved access of rural inhabitants to economic activities ②Food security
and conservation of environment, and ③Capacity building and strengthening organizations of rural
inhabitants and extension workers. Led from these are 10 structural programs and4 priority sectors, all
of them are introduced from either currently operational or at planning stage of the projects with
support from donors. Therefore, future projects to be implemented by the Government and /or donors
need to follow automatically this program.
After adoption of SDR, preparation of Action Plan for each program started in 2004 as a 3rd stage of
planning operation. Planning operation of the draft Action Plan consists roughly of two parts, one for
logical frame and another on collection and analysis of project information (including assessment of
budget requirement for projects from now on) for Middle Term Expenditure Framework (MTEF). In
2006, Action Plan and MTEF were approved in advance, but until the end of 2007, this Action Plan
was not yet operational.
ADPRS succeeded PRS, also emphasizing rural development as an engine for economic growth and
specifically elaborated SDR. From now on, it seems to be a challenge that how these 14 sectorial
programs (23 if sub-programs are included) will actually be implemented with the leading role of the
Government.
10Overall Goals
To reduce poverty ratio from the current 66% to 52% by 2015, through establishment of the situation for
sustainable socio-economic development, ensuring food security of the people and sustainable
management of natural resources.
Strategy I Strategy II Strategy III
Enhance access of community Forecast risks, improve food Strengthen the capacity of
to economic opportunity for security and conduct sustainable public and rural organizations,
establishing the situation for management of natural for the improvement of
sustainable economic resources, to ensure security of management system of the rural
development of the community daily life of the people development sector
(Specific goals) (Specific goals) (Specific goals)
・ increase agricultural ・ reduce unstable food supply ・ strengthen capacity of rural
production which hinders access to food actors
・ increase value of agricultural of farm household ・ improve the management of
products ・ improve the quality and rural sector
・ diversify income sources of hygiene of food for farm
farm household household
・ create the situation for
sustainable management of
natural resources
Structure programs Priority sectoral programs
① Local and community development ⑪ Food security through irrigation development
② Management of natural resources by ⑫ Pastureland development and stabilization of
region grazing system
③ Organizing of professional groups and ⑬ Land restoration and reforestation
establishment of marketing system ⑭ Kandadji : regeneration of ecosystems and
④ Rural infrastructure development of the Niger river valley
⑤ Rural financial system
⑥ Research, human resources and extension
⑦ Strengthen public system in community
sector
⑧ Safe water and sanitation
⑨ Decrease fragility of the household
⑩ Environmental protection
Fig. I.4 Framework of SDR
11CHAPTER II. TREND OF AGRICULTURE AND FORESTRY
DEVELOPMENT
1. Current Situation of Agricultural Production
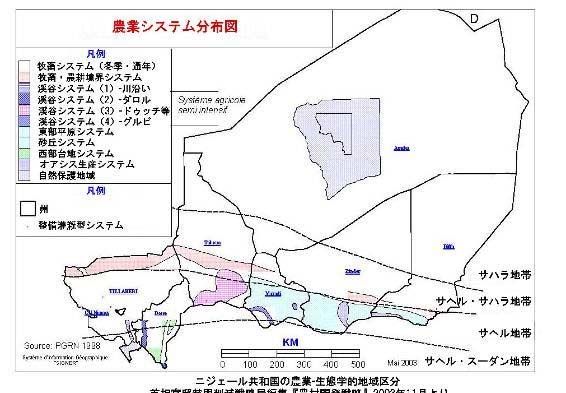
1) Agricultural system
According to [Rural Development Strategy, Nov.2003], issued by the Bureau of Poverty
Reduction Strategy of the Prime Minister’s Office, agricultural system of Niger is classified into
5 types further subdivided into 11 categories.
Pastoral system (winter and permanent)
Transitional system of pastoral and farming
Valley system (river basin)
Valley system (Dallols)
Valley system (Doutchi etc.)
Valley system (Goulbis)
Eastern plain system
Sand dune system
Eastern plateau system
Oasis production system
Nature rese
region
Consolidated irrigation system
Sahara zone
Sahel/ Sahara zone
Sahara zone
Sahel/ Sudan zone
Source: SDR 2003
Fig. II.1 Distribution of Agricultural System
(1) Northern Pastoral System
This system covers the whole areas of Sahara zone (rainfall less than 150mm/year) with 77%
and Sahel-Sahara zone (Rainfall 150mm-350mm/year) with 12% share of total national land
area, located in the northern part of the country. All of the Agadez region, most of the Diffa
region, northern halves of Tahoua and Zinder regions, Northern part of Maradi region and
Northern border of Tillaberi region are included in this system.
Basically limited in supply of grass for feed, nomadic activities of goats and camels are the
12dominant feature of this system. Though this vast extending area has potentials for nomadism,
severe natural condition and lack of water resources hinder the development of productive
nomadic system.
(2) Transitional system from pastoral to sedentary farming
Located in the southern part of Sahel / Sahara zone, it had been nomadic area originally. In
spite of the law enacted in 1961 to prohibit crop cultivation in areas of rainfall less than 350
mm/year, pasture land has been turned to farmland; due to increasing population. This area is
vulnerable to the climate change and in addition to low productivity, has been exposed to the
menace of desertification. The area of this transitional system is an important for nomadic
system as a most appropriate from the viewpoint of land use. There may exist possibility to
avoid friction with farmers in the south if the intensive livestock farming system is developed in
this area.
(3) Rain-fed agricultural system
① Sand dune system
Annual rainfall exceeds 400mm, but sand dunes extend widely, from the northern part of the
regions of Tillaberi and Dosso to the central part of Tahoua and south western part of Diffa.
Nomads are limited here, as single crop of pearl millet production and intensive livestock
production are popular. However, cereal production does not meet local requirement. In parallel
to population increase, soil fertility is deteriorating as fallowing period is being shortened,
progressing wind erosion and ponds and basins are being buried by sands.
② Eastern plain system
The system is located in the Eastern part of Sahel zone (rainfall 350-600mm, 10% of the total
land area) connecting cross-wise to the south of Maradi and Zinder regions. Semi-intensive
farming/ livestock system is common, with growing Acacia albida (Faidherbia albida) for
agro-sylvo-pastoral system and provide more than half of cereals in the country. Though
intensification of farming and shortened fallow period are going on, mixed farming of cereals
with cowpea and ploughing by animal are widely observed. Fattening of cattle and sheep are
widely practiced.
③ Western plateau system
This system covers the area of southern part of Tillaberi region and most of the Dosso region,
where spotted bush and tiger bush are widely distributed, in the Sahel- Sudanese Climatic zone
(rainfall 600mm to 800mm, 1.0% of total land area).
13Utilization of natural forest to livestock are fairly preceding compared to other area. In
lowland Dallol valley (fossil valley), Ronier palm and Doum palm have been introduced while
in the higher part of the plateau, fuel trees are being introduced. In areas surrounding forest,
agro-sylvo-pastoral system is adopted, combining crop growing with cattle raising in the forest.
Further, in the basin with available water, growing of vegetable in dry season are expanding.
In this area, in addition to the issue such as increasing number of farmers and herders and
their land title, problem is arising on the ways for harmonious development and utilization of
national forest resources by sedentary livestock farmers who have been living for several
generations.
(4) Oasis and irrigated farming system
① Valley system
This system is semi-intensive farming one of growing vegetable in dry season using
irrigation. This system is applied in various part of the country, particularly in Dallol (fossil
valley), Goulubis, Maggia and Tarka of the Maradi region and Zinder region, clearly
differentiating from consolidated irrigation system in the basin of Niger river and flood plain of
Komadougou river which will be mentioned later. Production includes wide range of crops,
such cereals as wheat and maize, root crops as cassava, potatoes and sweet potatoes, vegetables
and fruits. Small scale motor-driven water pumps are used. Improved technology is relatively
well defused. Rather than domestic consumption, production is more oriented to the market,
including export for cash income. Double cropping might be heavy burden to soil fertility, but it
seems attractive for farmers from the point of profitability. In addition to the problem of
ensuring stable water resources, preservation of product, particularly of onion, is the important
issue. Though this farming system is of the highest productivity in Niger, it is difficult to
expand this nationwide due to the limited water resources.
② Oasis production system
This system is adopted at oases in Agadez region and Maine-Soroa district of Diffa region.
Crops grown are very diverse, including cereals, vegetable, fruits and fodder crops. Crops and
livestock (sheep and goat) are well combined and camels are widely used to pump up the well
water.
Oases are relatively immune to climatic change and to unstable rainfall. Food security of the
household is ensured through stable crop production. Oases are also the supply sources of high
quality food crops and livestock products.
14③ Consolidated irrigation system
In the past, this system had been introduced in various part of the country. However,
practically it is now operational only for rice growing in Niger river basin. In other part of the
country, more diversified crops such as sorghum, wheat, vegetable, cotton etc., were grown.
Though they had potential for intensive and stable production, problems on operation and
maintenance of antiquated facility and equipment and marketing of the products hindered the
sustainability of the system.
(5) Other system
① Suburban system
In response to the increasing urban population (annual population growth rate ’90: 5.3%,
2001: 13%, 2020: 30% estimate) demand for food is rapidly increasing. Food import (rice, palm
oil, sugar, dairy products, wheat flour etc.) of Niger accounted for 47% of the total import or
226.5 billion FCFA of the total import of 56.5 billion FCFA (source: DSCN 2000). Major part
of these import are consumed by urban dwellers. Responding to the growing demand of urban
dwellers, production of cow milk, horse, vegetable and fruits are gaining momentum together
with cereal crops in suburban system. Proximity to urban area is an advantage in transportation
of cash crops and this encourages intensive cultivation. On the other hand, expanding urban area
is increasing pressure on farmland.
② Nature Reserve
Niger has relatively abundant wild flora and fauna in West Africa. There exists many
sanctuaries covering more than 80,000km2 in total. Particularly in "W" National Park located
from southern part of Niamey to the border with Benin and Burkina Faso and Air-Tenere
Reserve of mountain-desert area of Agadez region have unique flora and fauna and are called
for rational and comprehensive development including eco-tourism by local inhabitants.
Due to successive unstable rainfall and drought, isohyetal line in Niger is said to have shifted
80-100km southward compared to that of 60’. In addition to the constraints of both natural and
man-made, population pressure is increasing. Under the circumstance, in what way agriculture
will be developed? In the following chapter, a number of typical cases will be introduced.
2) Types of agriculture and current situation of production
(1) Rain-fed agriculture
Rain-fed agriculture in Niger is classified by their location into Sand Dune system, Eastern
Plain System and Western Plateau System. However, basically Eastern Plain is the most
favorable and suitable area for cultivation from the viewpoints of rainfall, topography and soil.
15Historically, in parallel to the increase in population, cultivated area has been expanded
gradually to the sand dune area in the north and forest on the plateau in the west. Crops grown
in these areas will be observed.
① Pearl millet and sorghum
Rain-fed farming (growing such cereals as pearl millet, sorghum, maize etc., beans such as
cowpea and ground nut) without any type of irrigation is the dominant feature of farming in
Niger.
Statistics of millet and sorghum’s combined production from 1980’ until 2001 prepared by
WFP shows that cultivated area for 5 year average of ’80-84 was 4,099,952ha, and it increased
to 7,764,696ha for 5 years average of ’00-04, being 1.89 times to the former. Increase in planted
area during the past 20 years was 3,664,744ha, with yearly increase at 183,237ha.
As for production, from 5 year average of ’80-’84, at 1,535,70t, it increased to 2,889,775t
for ’00-’04 average, with yearly increase by 67,700t.
Planted area/capita and production/capita show no significant changes, as the planted area
and production/capita in 5 year average of ’80-’84 was at 0.7ha and 260kg respectively, while
corresponding figures for ’00-’04 were 0.7ha and 254 kg respectively.
Similarly, from the aggregated figures of planted area and production of pearl millet and
sorghum, yield in ’80-’84 was 374kg/ha and 372kg/ha in ’00-’04, with no significant change.
Some reports, (for example, Report on sector-wise diagnosis on environment and
desertification, Sept. 2005: MHELCD) describes that "In the past 15 years, yields of pearl millet
and sorghum have declined. Pearl millet 406kg/ha 388kg/ha and sorghum 319kg/ha
206kg/ha. This means that increase in production is the result of increased planted area".
However, WFP statistics shows no change in yields of pearl millet and sorghum. More
important problem would be that, as many documents describe, for many centuries, not only for
20 years, traditional farming practices have been adopted without change, and this might have
caused stagnated yield of pearl millet and sorghum. However there exists fact partly undeniable
on yields in the description of the above mentioned (Report on sector-wise diagnosis on
environment and desertification, Sept. 2005: MHELCD).
16Table II.1 Pearl millet and sorghum (planted area, production and per capita index)
Pearl millet and Sorghum
Year Population
Planted area(ha) Production(t) Area/capita (ha) Production /capita (kg)
1980 5,578,000 3,840,490 1,730,780 0.7 310
1981 5,763,000 4,070,568 1,635,492 0.7 284
1982 5,954,000 4,218,384 1,651,279 0.7 277
1983 6,151,000 4,242,140 1,653,760 0.7 269
1984 6,355,000 4,128,179 1,007,538 0.6 159
Av.(80-84) 4,099,952 1,535,770 0.7 260
1985 6,565,000 4,310,931 1,774,113 0.7 270
1986 6,783,000 4,348,597 1,743,559 0.6 257
1987 7,008,000 4,359,029 1,362,777 0.6 194
1988 7,240,000 4,995,768 2,326,505 0.7 321
1989 7,480,000 5,094,042 1,754,605 0.7 235
Av.(85-89) 4,621,673 1,792,312 0.7 256
1990 7,728,000 6,942,899 2,045,960 0.9 265
1991 7,967,568 6,456,77 2,314,991 0.8 291
1992 8,214,563 7,519,314 2,171,693 0.9 264
1993 8,469,214 6,099,128 1,714,310 0.7 202
1994 8,731,760 6,950,251 2,368,538 0.8 271
Av.(90-94) 6,793,673 2,123,098 0.8 259
1995 9,002,444 7,164,356 2,034,983 0.8 226
1996 9,286,395 7,138,358 2,172,213 0.8 234
1997 9,574,274 6,386,922 1,641,530 0.7 171
1998 9,871,071 7,607,398 2,894,013 0.8 293
1999 10,177,080 7,449,871 2,772,346 0.7 272
Av.(95-99) 7,149,381 2,303,017 0.7 239
2000 10,492,569 7,306,951 2,049,890 0.7 195
2001 11,060,261 7,835,456 3,022,350 0.7 273
2002 11,403,160 7,816,590 3,236,927 0.7 284
2003 11,756,658 8,041,222 3,502,464 0.7 298
2004 12,121,114 7,823,260 2,637,242 0.6 218
Av. (00-04 7,764,696 2,889,775 0.7 254
Av.(80-04) 6,085,875 2,128,794 0.72 253
Source: Collection and analysis of secondary data.
Rapport d’analyse de la sécurité alimentaire et de la vulnérabilité au Niger, PAM, juillet 2005
Traditional rain-fed agriculture has been the culmination of ingenious wisdom of the farmers.
Farmland of declined fertility by crop growing is put to fallow for several years, or 10 years,
waiting for the recovery of soil fertility. Cycle of land use system includes fallow period.
However, this system is now facing serious difficulty. Increased pressure on farmland due to
population increase does not allow appropriate management of cycle of land use practiced in the
past.
As virgin land with high soil fertility is no more available, shortening of fallow period
proceeds and finally fallow period will be suspended. Therefore, yield decline could not be
avoidable in the land of degraded soil fertility.
Separate method of analysis for pearl millet and sorghum, other than WFP Statistics will
clarify the above. [Trend of planted area, production and yields of major crops. 1980-2001]
17Direction de l’Agriculture/MDA, which seems to be the basic data for the above mentioned
Report on sector-wise diagnosis on environment and desertification, Sept. 2005: MHELCD
describes that, average yield in 5 years of ’80-84 was 391.8kg/ha for pearl millet and
322.2kg/ha for sorghum. Corresponding figures in 5 years of’97-’01 were 393.5kg/ha and
209.6kg/ha. While yield of pearl millet remained unchanged, sorghum showed sharp yield
decline of 112.6kg/ha, or 65% during this 17years.
Aggregated yield of pearl millet and sorghum make the situation of respective yield obscure
by the difference of ratio of planted area of each crop. Meager increase in millet production
compensates substantive decline of sorghum production.
Table II.2 Trend of planted area, production and yield of pearl millet and sorghum
Pearl millet Sorghum
Year Planted area Production Yield Planted Production Yield
(ha) (kg) (kg/ha) area (ha) (kg) (kg/ha)
1980 3,072,420 1,362,785 444 768,070 367,995 479
1981 3,088,248 1,313,842 425 982,320 321,650 327
1982 3,083,804 1,292,548 419 1,134,580 358,731 316
1983 3,135,550 1,298,345 414 1,106,590 355,415 321
1984 3,029,730 771,040 254 1,098,449 236,498 215
Av.(80-84) 3,081,950 1,207,712 391.8 1,018,002 328,058 322.2
1997 4,503,635 1,351,868 300 1,883,287 289,662 154
1998 5,366,055 2,391,282 446 2,241,343 502,731 224
1999 5,351,203 2,296,227 429 2,098,668 476,119 227
2000 5,151,395 1,679,174 326 2,155,556 370,716 172
2001 5,231,937 2,358,741 451 2,603,519 663,609 255
Av.(97-01) 5,120,845 2,015,458 393.5 2,196,475 460,567 209.6
Source: Direction de l’Agriculture/MDA
Sorghum requires more water than pearl millet and mostly grown at flood plain and areas
with better access to water in southern border with Sudan. In contrast, pearl millet can be grown
even in the area of rainfall less than 300mm/year, with high adaptability to dry land.
Decline of sorghum yield could be attributed not only to the effect of climatic change but also
to the difficulty to find the virgin land, and decreasing fallow period in the Eastern plain area.
More than 90 % of the total population live in this area.
In case of pearl millet, production started by the small population in the northern part with
scarce rainfall, originally under nomadic system, and could gradually extend to the western
plateau forest of favorable rain fall. Traditional land use cycle by fallow system could have been
continued and thus they could avoid degradation of soil fertility and yield decline.
However, population increases rapidly. Total arable land of Niger is said to be at 1.5 million
ha, around 12% of the total national land area. Cultivated area in 2003 has already surpassed 0.8
million ha and in 2006 it’s getting near to 0.9 million ha. If the fallow lands are taken into
18consideration, it seems that the expansion of farmland has already reached to the northern limit
without any more virgin land for cultivation. Land in the northern part with scarce rainfall
requires long period for the recovery of soil fertility. Furthermore, in addition to soil erosion,
wind erosion, soil degradation and sand dune movement, irregular rainfall and outbreak of
desert locust are the serious threat expected at least every 3 years. In future, possibility of losing
fallow period will high.
Problems surrounding sorghum production in the south will be occurring to pearl millet in
near future if the current situation remains to continue.
19Table II.3 Trend of planted area, production and yields of cowpea, maize, groundnuts
(1982-2001)
Cowpea Maize Groundnut
Year
Area Production Yield Area Production Yield Area Production Yield
ha ton kg/ha ha ton kg/ha ha ton kg/ha
1982 1,427,948 281,744 197 12,545 7,280 580 190,385 87,484 460
1983 1,608,525 271,349 169 10,515 6,690 636 167,560 74,970 447
1984 1,512,739 194,843 129 10,700 7,055 659 142,600 30,800 216
1985 1,566,199 115,332 74 7,200 3,400 472 29,700 8,400 283
1986 1,590,541 292,935 184 9,400 6,100 649 118,200 54,500 461
Av.(82-86) 1,541,190 231,241 150.6 10,072 6,105 599.2 129,689 51,231 373.4
1987 1,790,809 208,768 117 14,019 7,778 555 158,244 40,427 255
1988 1,925,194 301,549 157 9,560 4,947 517 78,256 12,921 165
1989 2,209,460 320,496 145 3,035 1,977 651 59,518 25,522 429
1990 2,662,503 223,543 84 5,600 1,759 314 62,766 17,533 279
1991 2,866,153 381,207 133 1,255 946 754 103,533 39,664 383
Av.(87-91) 2,290,824 287,113 127.2 6,694 3,481 558.2 93,463 27,213 302.2
1992 3,898,409 402,319 103 2,276 974 428 175,180 57,100 326
1993 3,357,718 162,823 48 499 73 146 84,702 20,152 238
1994 2,966,418 382,578 129 2,407 1,752 728 151,036 67,433 446
1995 3,439,112 184,062 54 1,582 1,293 817 269,294 111,092 413
1996 3,041,227 295,243 97 2,302 376 163 416,055 195,970 471
Av.(92-96) 3,340,577 285,405 86.2 1,813 894 456.4 219,253 90,349 378.8
1997 3,295,570 192,453 58 2,583 3,000 1161 232,502 87,873 378
1998 3,720,167 774,630 208 5,378 5,130 954 229,719 112,136 488
1999 3,793,793 420,671 111 nd nd nd 250,101 103,733 415
2000 3,846,277 262,657 68 6,149 3,920 638 360,338 113,216 314
2001 3,512,464 509,469 145 8,901 2,325 261 192,321 82,006 426
Av.(97-01) 3,633,654 431,976 118.0 5,753 3,594 753.5 252,996 99,793 404.2
Source: Direction de l'Agriculture/MDA nd : no data J-64
20② Cowpea
Cowpea is usually planted with major cereal crops such as pearl millet, sorghum, maize etc.,
using spaces between these crops. Therefore, in parallel to the increase in cereal planting,
cowpea’s planting area and production have been increasing year by year. Cowpea is the 3rd
important crop following pearl millet and sorghum, and important cash crop such as onion. As
high value cash crop, it is priced at 600,000-900,000 FCFA/t. About 80-90% of total production
are exported and export value stands at 3rd following onion and livestock. Strong demand from
Nigerian and other existing markets influence cowpea production both positively and
negatively.
Niger and Nigeria have been the major cowpea producers in the world, but in recent years,
Burkina Faso is increasing cowpea production. In general, many neighboring countries
bordering with Niger are seeking the way for technical improvement by concentrating
production to one specific variety. But in Niger, this sort of effort has not been taken. Judging
from the statistical information, it is apparent that both planted area and yield are increasing.
(Planted area of cowpea increased from1,566,200ha in 1985 to 4,000,000ha in 2003).
Planted area:million ha
Yield:100kg/ha
Production: million t
Source: Pini & Tarchiani 2007: 17
Fig. II.2 Trend of planted area, yield production of cowpea
Yield of cowpea fluctuates year by year, caused by rainfall and insect damages. According to
21official report, production in 1985 was 115,000t while that in 2000 was 500,000t, perhaps
depending mainly on expansion of planted area rather than yield increase.
Average annual harvested volume for home consumption and sales is estimated at 340,000t.
As the domestic consumption is estimated at 80,000t (7.82kg/capita/year), around 260,000t
(70%) are considered to have been exported.
Nigeria’s demand for cowpea is the highest and her annual demand of cowpea is estimated at
2,400,000t. Domestic production cannot suffice the demand. Therefore, Nigeria needs to import
300,000-500,000t of cowpea every year from abroad. At the moment Nigeria is the biggest
importer of Niger’s cowpea, with the share of 70-80% of Niger’s total export.
Zinder Zinder
Tillaberi Tillaberi
Tahoua Tahoua
Maradi Maradi
Dosso Dosso
Source: Pini & Tarchiani 2007: 18
Fig. II.3. Trend of planted area and production of cowpea in each region 1995-2003
Production of cowpea in Niger is concentrated in 5 major agricultural regions, among which
Zinder is the top producer with the share of 30%, followed by Maradi. In Zinder, 40% of the
total production are from 30% of the total planted area, while in case of Maradi, 30% of the
production come from 20% of the planted area. In other regions cowpea production is
negligible.
Cowpea is also an important crop for food security. If the surplus is sold by the average price
of 2001-2003 (178FCFA/kg), it will be able to purchase necessary food for 1.5 million people.
③ Maize
Maize is not planted widely in Niger. Its yield fluctuates widely by the years and is seen as a
most unstable crop. However, it is reported that maize is also produced in oases and is an
important income source of oasis farmers with such crops as cassava and date (Etude filieres
agricoles et forestieres/PAGRN).
Average yearly import of maize for 1999-2004 was 37,146t, of which 20% or 7,256t were
from Benin and 44% or 16,480t were from Burkina Faso, Mali and others. Domestic production
was less than 10% of the total import.
④ Groundnut
Groundnut has maintained its importance as an export crop since independence in Niger.
22You can also read