Indoor humidity of dwellings and association with building characteristics, behaviors and health in a northern climate
←
→
Page content transcription
If your browser does not render page correctly, please read the page content below
Indoor humidity of dwellings and association with building
characteristics, behaviors and health in a northern climate

Downloaded from: https://research.chalmers.se, 2021-10-07 19:14 UTC

     Citation for the original published paper (version of record):
     Psomas, T., Teli, D., Langer, S. et al (2021)
     Indoor humidity of dwellings and association with building characteristics, behaviors and
     health in a northern climate
     Building and Environment, 198
     http://dx.doi.org/10.1016/j.buildenv.2021.107885

N.B. When citing this work, cite the original published paper.

research.chalmers.se offers the possibility of retrieving research publications produced at Chalmers University of Technology.
It covers all kind of research output: articles, dissertations, conference papers, reports etc. since 2004.
research.chalmers.se is administrated and maintained by Chalmers Library

                                           (article starts on next page)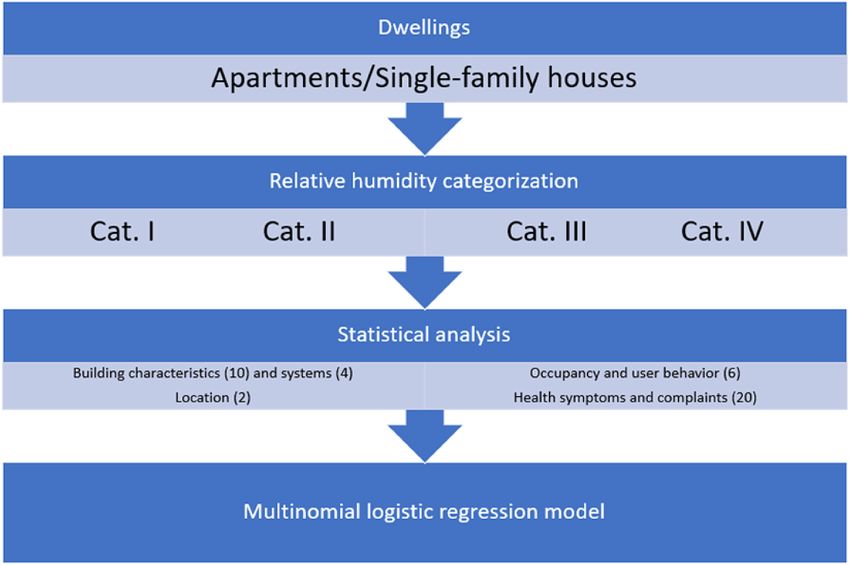
Building and Environment 198 (2021) 107885
Contents lists available at ScienceDirect
Building and Environment
journal homepage: http://www.elsevier.com/locate/buildenv
Indoor humidity of dwellings and association with building characteristics,
behaviors and health in a northern climate
Theofanis Psomas a, *, Despoina Teli a, Sarka Langer a, b, Paula Wahlgren a, Pawel Wargocki c
a
Department of Architecture and Civil Engineering, Chalmers University of Technology, 41296, Gothenburg, Sweden
b
IVL Swedish Environmental Research Institute, 40014, Gothenburg, Sweden
c
Department of Civil Engineering, Technical University of Denmark, 2800, Lyngby, Denmark
A R T I C L E I N F O A B S T R A C T
Keywords: Data from a nationwide survey on the status of the Swedish residential building stock and indoor air quality was
Relative humidity placed in the public domain by the National Board of Housing, Building and Planning of Sweden. The current
Air quality research investigates the indoor humidity conditions in Swedish residential buildings, single-family houses and
Residential building
apartments, assessing the measurements from the extensive BETSI-survey against adjusted relative humidity
Dry air
Symptom
levels based on existing norms and Standards. The aim of this study is to investigate associations and correlations
Complaint between relative humidity levels and multiple building and system characteristics, occupancy patterns and be
Ventilation haviors and health symptoms-complaints. The analysis uses 13 categorical and 9 continuous variables-
parameters of the examined dwellings.
Analysis shows that low indoor relative humidity is a realistic issue in Swedish dwellings during the heating
season. The issue is more prevalent in apartments than single-family houses. In addition, low indoor relative
humidity seems to be more extensive in dwellings with higher indoor temperature, smaller volume, higher
ventilation rate and frequent airing practices, lower number of occupants, constructed mainly after 1985, in city
suburbs and in the northern parts of the country. The developed multinomial logistic regression model may
predict very accurately the relative humidity level of the Swedish dwellings, during heating season. This analysis
offers additional evidence to the scientific literature for possible correlation of low relative humidity with specific
health symptoms, complaints and disturbances.
1. Introduction building characteristics and renovation processes, systems and controls,
occupancy behaviors and health symptoms [3–5]. An important quality
The indoor environment is the microenvironment in which most factor of the environment of a dwelling, which influences comfort,
people spend the major time of their daily life. People have always spent health, stress level, sleep quality and the building construction itself, is
a considerable amount of time indoors, especially at home, which has the level of humidity indoors [6–8].
seen a significant increase during the period of the COVID-19 pandemic. Humidity is frequently measured by psychrometer or hygrometer,
High quality indoor environment for residential buildings is essential for integrated into a compact temperature sensor and is reported as relative
good physical and mental health, high productivity and learning per (%; RH) or absolute humidity, (g/m3; AH). Relative humidity always
formance, and comfort of occupants [1,2]. Recent studies have shown refers to a specific temperature at a defined pressure. Low, i.e. below
that the cost of low-quality indoor environment for the employers, 30–40%, and high, i.e. above 60–70%, relative humidity indoors may
building owners and the society, is directly comparable with the cost of lead to physical discomfort, as relative humidity has a direct impact on
the energy used for the same building [1,2]. However, research effort how comfort is perceived [9,10]. High moisture content may cause
focuses mainly on the assessment and rating of dwellings in terms of structural damages, decreased thermal resistance and modification of
thermal comfort and pollutant concentrations, in association with the physical properties of building materials, deform materials and
Abbreviations: AH, Absolute humidity; BETSI, Bebyggelsens Energuanvändning, Tekniska Status och Innemiljö; CI, Confidence interval; OR, Odds ratio; RH,
Relative humidity; VIF, Variance inflation factor.
* Corresponding author.
E-mail address: th.psomas@gmail.com (T. Psomas).
https://doi.org/10.1016/j.buildenv.2021.107885
Received 8 January 2021; Received in revised form 25 March 2021; Accepted 11 April 2021
Available online 16 April 2021
0360-1323/© 2021 The Author(s). Published by Elsevier Ltd. This is an open access article under the CC BY license (http://creativecommons.org/licenses/by/4.0/).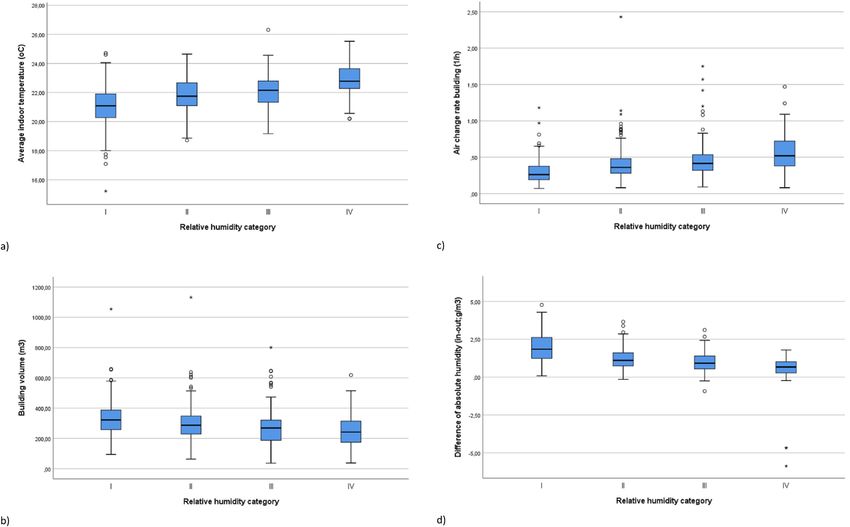
T. Psomas et al. Building and Environment 198 (2021) 107885
result in shorter service life of the building [11,12]. Common hygiene such as building and systems’ characteristics, occupancy patterns and
indicators of high RH are among others visible mold, damp stains, behaviors and health symptoms or complaints. The proposed method
condensation on walls and windows, odors and smells [11,13,14]. Hu ology has been widely used in the past for thermal comfort, ventilation
midity analysis indoors is not mandatory for residential buildings, in and carbon dioxide (total indoor environmental quality) assessment and
contrast with other types of buildings, e.g. museums, churches and it is described analytically in Chapter 2.3 [1,2,30,31].
historical buildings [1,2]. The analysis is conducted primarily to prevent
moisture damages (e.g. crawl spaces and attics), which are the main 2. Materials and methods
cause of building structure deterioration and poor environment
(“dampness” complaints) in spaces with high occupancy like offices, 2.1. BETSI study and buildings’ characterization
schools and kindergartens [15,16]. A strong focus is therefore seen in
current research on presence of high humidity and its impacts. The BETSI (Bebyggelsens Energianvändning, Tekniska Status och
In response to new construction practices and airtightness levels in Innemiljö) study was a reference project, which was commissioned by
buildings for energy efficiency optimization, upper limits of RH have the Swedish National Board of Housing, Building and Planning (Bover
been recommended for thermal comfort and to mitigate growth of mold ket) in 2006 [32–42]. The target of the project was the data collection of
and fungi indoors [17,18]. On the other hand, there is no widely the indoor environmental conditions, energy consumption and technical
accepted boundary for low RH value, in parallel with acceptable expo status of the Swedish residential building stock and the comfort and
sure time [8,10,15]. Research studies and guidelines use 40% RH as a health condition of the users [33,39,43]. Thirty Swedish municipalities
comfort-related limit value and others use 20–30% RH, as a of a total of 290 were selected across the country through a stratified
health-related limit value [8,10,15,19,20]. Relative humidity level, random selection (4 stages sampling, clustering and stratification) in
below 50%, has been associated with a number of respiratory infections, respect of geographic and demographic characteristics [32,43]. The
asthma and allergies [8,16,21]. In addition, in health effects are selected apartments (permanently inhabited) had minimum real estate
included pathogens and disease transmission [8,21]. Relative humidity, value of 50,000 SEK and user area 50 m2 [5]. The size limitation applied
below 30–40%, is associated with dryness of nasal and laryngeal airways also to single-family houses. Detailed information about the survey can
(e.g. throat), dry hands and eye irritations [6,21–23]. The mechanism is be found in Refs. [32–46].
not well understood. The effect of pollution to the mechanism should A total of approximately 1400 residential buildings were inspected in
also be considered, however its effect is debatable and requires further the BETSI study. Measurements of indoor air temperature and relative
investigation [20,22]. Decrease in morbidity and mortality of the lethal humidity were taken during two-week periods. The current analysis
viruses (e.g. influenza, rhinoviruses and human rotavirus) and bacteria, includes 678 residential buildings, 520 single-family houses and 158
is probably the most beneficial output of an increase in RH [10,15,24]. multi-family buildings, monitored between October 2007 and April
More specifically, water content affects the diameter, cell wall and the 2008 (defined as heating season). The analysis uses only measurements
viral cover of a number of aerosols and as a result their suspension time of the indoor humidity level in living rooms, as the most representative
[10,15]. Finally, low levels of RH have been related with static elec room of the house. Dwellings with measurements during less than 10
tricity complaints [8]. Extensive reviews of the effects of the low RH on days were also excluded from the analysis (data cleaning and pre-
biological and chemical factors (bacteria, viruses, fungi, house dust processing).
mites, formaldehyde, sulphur and nitrogen dioxides, ozone and other), The inspection data used in the analysis were made available by
as well as human factors are presented in Arundel et al. (1986) for Boverket and include the buildings’ and systems’ properties [40,41].
studies before 1985, and in Derby et al. (2017) and Wolkoff (2018; [6,8, The heated area and volume of the rooms and windows of the building
21]) for studies after 1985. were calculated by the inspectors through drawings or in-situ. The heat
Dry air is common in Scandinavian countries because outdoor air transfer coefficient (U-value; W/m2K) of the different construction ma
cannot hold the moisture and it condenses. Indoor humidity appears to terials and elements were calculated and the average overall U-value of
correlate better with outdoor AH values, compared with indoor-outdoor the dwelling was estimated. Air change ventilation rates (h− 1) were
RH values [25,26]. In many residential buildings, in these climatic calculated for the living room and for the dwelling (several gas sources
conditions (cool-temperate continental climate), indoor RH is lower were positioned throughout the dwelling) using the passive perfluoro
than 20% for long periods during the heating season [8,27]. However, carbon tracer gas method, as described in ISO 16000–8:2007 [5]. The
this is not the case for many new buildings [28]. The association of in tracer gases were collected passively in charcoal tubes for approximately
door humidity with different building-systems characteristics, behaviors two weeks. An average value for this period in each dwelling was
and health symptoms or complaints has been investigated in the past [5, calculated [5]. The air temperature (oC) and RH (%) were measured
29]. In the majority of these studies, the humidity level is assessed either using SatelLite20 TH sensors (Mitec Instruments, Säffle, Sweden) in 15
with the use of descriptive values for RH or AH (absolute min steps [5]. Generally, the loggers were placed 1.6–1.8 m above the
minimum-maximum or average value of measurements over a period of floor [44]. The measurement range was 10%–95% for RH and − 40 to
time) or with the use of the moisture supply value, also referred to in the +80 ◦ C for temperature [44]. The uncertainty for air temperature values
literature as moisture or vapor excess-increment or moisture balance, in was ±0.3 ◦ C and for humidity ±3 RH% [44]. Outdoor temperature and
combination with the period of occurrence. The current research in RH were collected from the Swedish Meteorological and Hydrological
vestigates the humidity conditions in Swedish residential buildings, Institute and refer to the nearest stations (SMHI).
assessing the measurements from the extensive 2007/2008 Fig. 1 presents a graphic representation of the methodology of the
BETSI-survey conducted by the National Board of Housing, Building and analysis. The analysis uses 13 categorical and 9 continuous variables-
Planning (Boverket), against adjusted RH categories based on existing parameters for the examined dwellings for possible correlations and
norms [1,2]. associations with different RH levels (Fig. 1, Tables 1 and 2). The
The objectives of this study are: a) to correlate the RH levels with the available options for the 13 categorical parameters are presented in
building and occupancy-user behavior characteristics and b) to associate Table 1. Descriptive statistics of the continuous parameters are pre
the low RH levels with health symptoms and disturbances, using a sented in Table 2. Five classes of building construction periods were
comprehensive and extensive dataset from a nationwide survey. To our used in the BETSI study, as they represent major changes in building
knowledge there is no previous research that assesses the indoor envi technology linked with upgrades of building codes [32–42]. There are
ronment of residential buildings, in terms of indoor humidity, for these four climate zones for examination (latitude 55oN to 70oN; Table 1). A
climatic conditions (cool-temperate continental climate), in a holistic higher number indicates a southern climate zone (Table 1). The location
way, i.e. based on RH levels and correlations with various parameters of the dwellings is classified into 4 categories (Table 1). Ventilation
2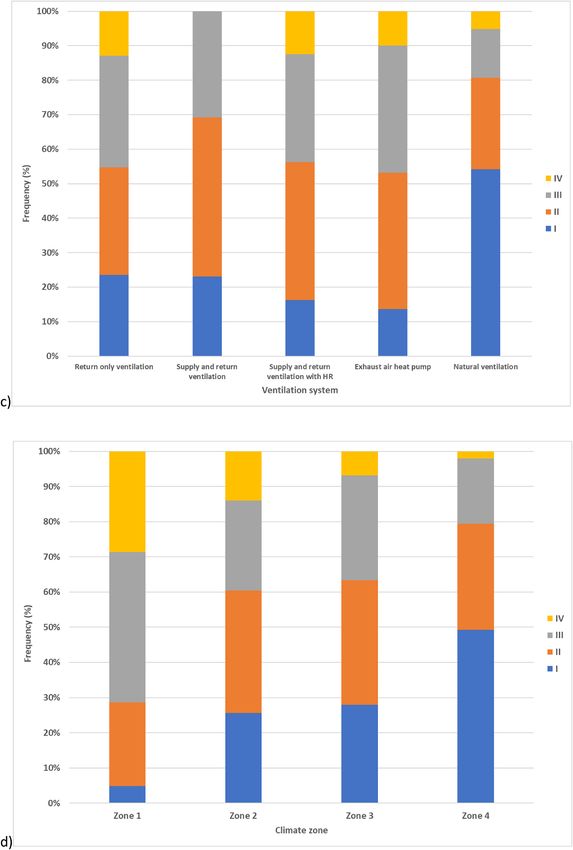
T. Psomas et al. Building and Environment 198 (2021) 107885
Fig. 1. Methodology of the analysis.
Table 1 Table 2
Examined categorical variables and available options in the dataset. Examined continuous variables and descriptive statistics (mean, standard de
viation, interquartile range, range, number of cases).
a/ Parameter (Number of Available options
a cases) a/ Parameter Mean Standard Interquartile Range Number
a deviation range of cases
1 Construction period before 1960, 1961–1975, 1976–1985, 1986–1995
(461) and 1996–2005. 1 Indoor air 21.77 1.35 21.75 11.10 678
2 Heating system (676) other systems, wood stove, directly produced temperature
electricity, own combustion boiler, electric boiler, (◦ C; average)
electric resistances, electric radiator, district 2 Building 296 117 286 1094 672
heating, stove, local produced district heating, volume (m3;
fireplace, pellet stove and heat pump. heated;
3 Ventilation system return only, supply and return, supply and return average
(640) with heat recovery, exhaust air heat pump central ceiling height
(for apartment), exhaust air heat pump (for single- of 2.4 m)
family houses), exhaust air heat pump local (for 3 Ventilation 0.40 0.23 0.36 2.36 646
apartment) and natural ventilation. air change
4 Location (675) city suburb (e.g. apartments), sparsely populated rate, building
area, city center and residential neighborhood (e.g. level (h‾1)
single-family houses). 4 Ventilation 0.41 0.28 0.36 3.20 614
5 Climate zone (461) inner regions of North Sweden (Norrland; 1), coastal air change
Norrland and some inner areas of Svealand (2), rate, living
Svealand (3) and Götaland (4). room level
6 Automated bathroom no and yes. (h‾1)
fan (454) 5 U value 0.53 0.24 0.46 1.65 678
7 Window vents (452) no and yes. building (W/
8 Closing kitchen area no and yes. m2K; average,
(457) thermal
9 Pets (455) no and yes. bridging)
10 Cooking (457) 1-3 times per month, 1–4 times per week, never and 6 U value 2.09 0.34 2.00 3.70 678
daily. windows (W/
11 Airing frequency once per week, never/rarely, daily/almost every m2K; average)
(454) day and sometimes/once per month. 7 Delta absolute 1.30 0.96 1.17 10.65 678
12 Airing practice (446) windows open all day, windows open for a few humidity or
hours, windows open for a few minutes and never. indoor
13 Drying cloths indoor no and yes. moisture
(455) supply (g/m3;
in-out;
average)
systems are classified into 7 categories and heating systems into 13 8 Window area 0.15 0.07 0.14 0.86 678
categories (Table 1). Six options for heating systems, ventilation sys to heated
living area
tems, and cooking option are not represented with cases in the sub
ratio (%)
sample used in the analysis. The analysis is conducted also for different 9 Number of 2.48 1.24 2.00 7.00 534
types of dwellings (apartments and single-family houses). occupants
3
T. Psomas et al. Building and Environment 198 (2021) 107885
2.2. Indoor environment and health questionnaire Table 4
Examined health symptoms and complaints and frequency of yes-responses for
The air quality assessment and health questionnaire were developed the optimum and non-optimum assessment groups of RH. In the parentheses are
from Uppsala University, Medical Science Department, based on previ the number of responses for every health symptom.
ous research [44]. The questions reflect to the “MM-questionnaire”, a/ Disturbances last 3 Optimum Non-optimum Exact
which was developed at the Örebro University Hospital, in the early a months (Number of group Cat. I-II group Cat. III- significance
responses) (YES %) IV (YES %) (Chi Test
1980’s [45]. The questionnaire was posted by mail to residents in Spring
-Fischer Exact
of 2008 (two reminders; [43]). Almost half (46%) of the adults partic Test)
ipated in the project [44]. Information about demographic and medical
1 Asthma+ (217) 9.0 9.6 0.999
information of the participants are presented in various past research 2 Cough (820) 33.9 27.8 0.091
articles [44–46]. The questionnaire is divided into six categories and 3 Difficulty to 22.6 20.3 0.467
includes 35 questions [43]. Questions in the first part referred to the concentrate (813)
general opinion of the individuals about the indoor environment and if 4 Dry air (864) 23.1 24.0 0.796
5 Dry or red skin face 18.4 13.1 0.057
certain problems appeared in their dwellings [43]. The following three
(814)
parts referred to more detailed questions about occupants’ perception of 6 Dry, itchy, red skin 19.5 13.5 0.038
thermal comfort, air quality and sound quality. The fifth part included in hands (814)
questions about health and the sixth part information about the partic 7 Dust and dirt (862) 34.8 33.1 0.645
ipants [43]. The main question of interest for the present analyses is: 8 Eye sensitivity++ 25.8 24.7 0.802
(865)
“During the last 3 months, have you had any of the following symp
9 Headache (815) 51.2 46.9 0.261
toms?”, followed by a list of symptoms [45]. The possible responses 10 Heavy head (816) 46.4 41.6 0.201
were: “yes, often (every week)”, “yes, sometimes” (merged together), or 11 Huskiness, throat 25.6 23.8 0.604
“no, never” [45]. The list of symptoms referred to three categories and a dryness (820)
12 Irritated, stuffy or 41.9 37.4 0.250
total of nine questions: general symptoms, mucous membranes symp
runny nose (818)
toms and dermal symptoms [45]. Health symptoms and complaints that 13 Itchiness, pain 23.1 28.1 0.138
have not been reported in literature as being relevant to indoor humidity irritation eye (815)
content (high or low values) are not used in this research. A list of 20 14 Itchiness, peeling in 19.8 13.2 0.023
symptoms was collected for further analysis. Table 4 presents the health hair, ears (814)
15 Nausea, dizziness 16.3 16.1 0.999
symptoms used in this analysis and the reference period (also number of
(819)
responses). 16 Respiratory 51.9 44.0 0.034
infection (870)
17 Static electricity 4.9 9.1 0.023
2.3. Relative humidity assessment
(866)
18 Stuffy air (865) 25.6 16.4 0.030
The analysis aims to highlight the specific characteristics of the 19 Stuffy smell++ (866) 24.3 12.8 *
residential buildings with low indoor relative humidity. In order to 20 Tiredness (822) 71.1 70.6 0.934
classify the dwellings according to their measured humidity levels, we +
12 months, ++
In general, * Lower than 0.0005.
adopted a categorization based on recommendations in the European
Standard EN 16798:2019 [1,2], which we adjusted to the focus of this Kruskal-Wallis test was used (Table A.1). The Kruskal-Wallis test is a
study on low RH levels. Table 3 presents the four RH levels for every rank-based nonparametric test. It is an alternative to the one-way
assessment category as used in this analysis. The lower limits of the ANOVA test or the Mann-Whitney U test, and it allows the comparison
categories are based on EN 16798:2019 (RH in a descending order). The of more than two independent groups [47]. It can also be applied when
upper limit of relative humidity for all the categories was set to 60%. the homogeneity of variance is not satisfied. The p-value is adjusted by
This upper value is normal for indoor RH, during the heating season, for the Bonferroni correction for multiple tests. In addition, all the p-values
these climatic conditions (no issues to human health or the construction are asymptotic, computed by approximation with a standardized normal
elements [1]). Dwellings with RH over 50% are only 5.8% of the sample. distribution [47]. The distribution shapes during the tests are similar in
This subsample of the cases is small and referred almost exclusively to all groups for the entire analysis. The tests are conducted on all the
single-family houses. Deviation percentage for every category is set to available data for the given variable. In total, 6 combinations of the RH
3% [1,2]. Assessment period is the monitoring period for every dwelling. categories were calculated (Table A.1). The comparisons are considered
The minimum period is 10 days and the maximum 3 weeks, always statistically significant when p is lower to 0.05 (two-tailed tests). To
within the heating season. detect the relationship or differences between categorical variables the
Chi-Square test of independence is used [47]. The Chi-Square test is also
2.4. Statistical analysis a nonparametric test. For this analysis, the strength of the association is
described by Cramer’s V [47]. For the health symptoms analysis, the
All statistical analyses were conducted with SPSS software version Fischer’s Exact Test (Chi-Square analysis) is used.
26.0 (SPSS Inc., Chicago, IL, USA). For the normality distribution check, To examine the relationship between the RH categories and the
the numerical Shapiro-Wilk method is used. To determine if there are building, systems, location, and occupancy characteristics, multinomial
statistically significant differences between group medians of an inde logistic regression analysis was conducted. Multinomial logistic regres
pendent variable on a mainly continuous dependent variable, the sion is a classification method [48–50]. It is mainly used to generalize
logistic regression to multiclass problems [48–50]. The independent
Table 3 variables may be real-valued, binary-valued, categorical-valued or
Relative humidity category boundaries used in this analysis. other. Instead of predicting the value of a variable Y from different
Category Upper and lower level of relative humidity (%) predictor variables Xi, in multinomial logistic regression, a probability P
(Y) of Y occurring is calculated using the Equation (1) [50]:
I 30–60
II 25–60 1
III 20–60 P(Y) = (1)
1 + e− (bo+b1X1i+…+bnXni)
IV 0–60
4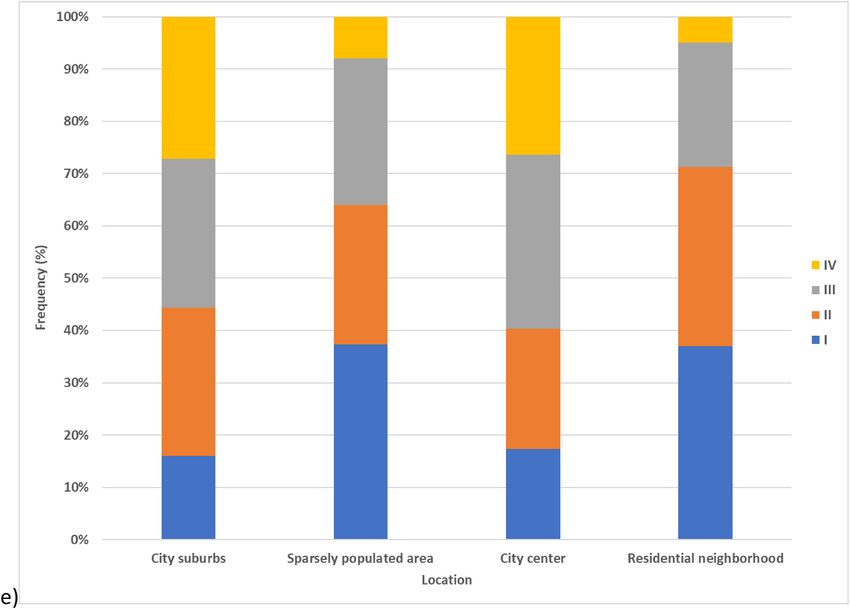
T. Psomas et al. Building and Environment 198 (2021) 107885
The multiple linear regression equation is expressed in logarithmic level ventilation air change rate (h− 1) and the average difference be
terms (“e” is the base of the logarithm). The output of this equation is a tween indoor and outdoor absolute humidity (indoor moisture supply;
value between 1 and 0. Maximum likelihood estimation method is used g/m3), for the four RH assessment categories. The bottom and the top of
for the estimation of each predictor variable [50]. Our approach con the box indicate the 25th and 75th percentiles. The black colored line
siders an analysis of four groups or else three comparisons against one near the middle of the band is the median. The ends of the whiskers are
reference category, which is the group of “Cat. IV” (Table A.4). Associ the 10th and 90th percentiles and the symbols show the outliers.
ations are expressed as odds ratios (OR) with a 95% confidence interval Increase of the indoor air temperature lowers the RH level and “in
(CI). The odds of an event occurring is defined as the probability of an creases” the assessment category level. Category I has lower mean in
event occurring divided by the probability of not occurring [50]. Again, door air temperature, 21.1 ◦ C, compared with Cat. IV at 22.9 ◦ C
the results are considered statistically significant when p is lower to 0.05 (Fig. 3a). Mean and median values are close to each other for every
(two-tailed tests). The variance inflation factor (VIF) is used to explore category. The boxplots are similar for all the categories. The mean
the collinearity level between the predictors included in the models (VIF values of the apartments are always higher than the values of the single-
less than 10). Case with studentized residuals greater than 3 were re family houses for every category and in total. All the categories apart
ported. No outliers have been detected for this analysis. The interest is from Cat. I pass the Shapiro-Wilk test for normality with p-values higher
only on main effects of the multinomial logistic regression analysis. Only than 5%. Statistically significant differences were found between the
dwellings with full data on all the variables were included in this median values of almost all four categories, with asymptotic signifi
analysis. cances lower than 5% (Table A.1).
Increase of the volume of the dwelling tends to improve the indoor
3. Results RH condition (Fig. 3b). The median values of the boxplots are 134.3 m2
and 100.8 m2, for Cats. I and IV respectively (average ceiling height of
3.1. Dwellings’ assessment 2.4 m). The mean volume of single-family houses is almost double
compared with apartment’s volume for every assessment category.
Assessment of the examined building sample in terms of RH cate Again, mean and median values are close to each other for every cate
gories shows that only 63.3% of the cases belong to the Cats. I and II gory. Only Cat. IV values are normally distributed and the median dif
(Fig. 2). The percentages of dwellings in Cats. III and IV are 61.4% for ferences between the assessed categories are statistically significant for
apartments and 29.2% for single-family houses (absolute frequencies). four out of six combinations (pairs of categories; Table A.1).
For apartments, the highest share belongs to Cat. III (36.1%) and then Decrease of the ventilation air change rate improves the indoor RH
Cat. II (27.2%) and for single-family houses to Cat. I (38.1%) and then to levels in room (not presented) and building levels (Fig. 3c). At the
Cat. II (32.7%). In Cat. IV belongs 25.3% of the apartments and 6.2% of building level, the mean values are 0.30 (h− 1) and 0.55 (h− 1) for Cats. I
the single-family houses (10.6% on average). and IV respectively. The ventilation air change rates are higher for
apartments in each category and in total. None of the samples is nor
mally distributed and almost all the median differences between the
3.2. Building characteristics
categories are statistically significant at building and room level (5 out
of 6 combinations; Table A.1). More than 70% of the cases, have an
Fig. 3(a–d) presents the boxplot diagrams of the average indoor air
average ventilation air change rate for the assessment period that is
temperature (oC), the total heated building volume (m3), the building
Fig. 2. Frequency bar chart of different building types (apartments and single-family houses) and in total (dwellings), for the four RH assessment categories (678
cases in total). Category I: >30%, Category II: >25%, Category III: >20%, Category IV: >0%.
5
T. Psomas et al.                                                                                                             Building and Environment 198 (2021) 107885

Fig. 3. Boxplots of different examined parameters: a) average indoor air temperature (oC), b) the total heated building volume (m3), c) the building level ventilation
air change rate (h− 1), d) the average difference between indoor and outdoor absolute humidity (indoor moisture supply; g/m3), e) the average U-value of the
dwelling (thermal bridges; W/m2K), f) the average U-value of the windows (W/m2K) g) the window area to heated area ratio and h) the number of occupants, for the
four RH assessment categories. Category I: >30%, Category II: >25%, Category III: >20%, Category IV: >0%.

                                                                                  6
T. Psomas et al. Building and Environment 198 (2021) 107885
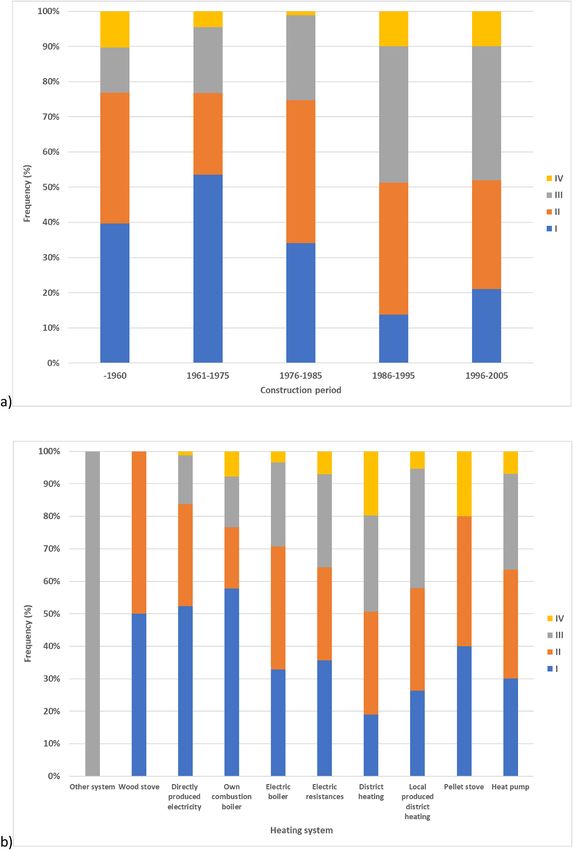
Fig. 4. Frequency bar charts of different examined categorical parameters: a) building construction period, b) heating systems, c) ventilation systems, d) Swedish
climatic zones (Table 2) and e) building locations, for the four RH assessment categories. Category I: >30%, Category II: >25%, Category III: >20%, Category
IV: >0%.
7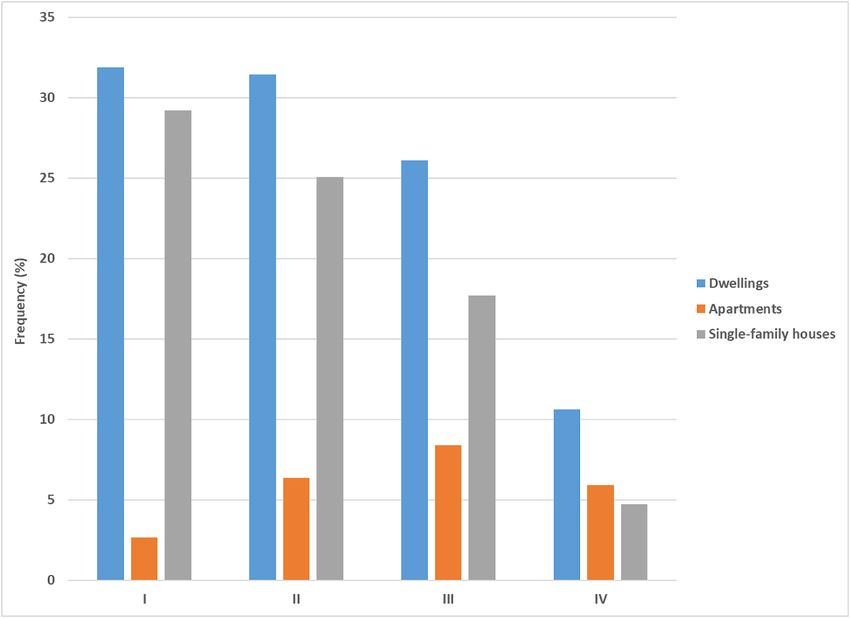
T. Psomas et al.                          Building and Environment 198 (2021) 107885

                   Fig. 4. (continued).

                            8
T. Psomas et al. Building and Environment 198 (2021) 107885
Fig. 4. (continued).
lower than the minimum benchmark of the guidelines, i.e. 0.5 h− 1 [51]. categories for each of the construction age-period of the examined
Analytical correlations between ventilation and building characteristics dwellings. Almost 50% of the recently built dwellings (after 1985)
or occupancy behaviors for the BETSI project may be found in Langer belong to Cats. III and IV. For the remaining construction periods the
et al. (2013; [5]). Ventilation systems are analyzed in Section 3.3. percentages are between 70 and 80% for Cats I and II. Similar results
As expected, smaller difference between indoor and outdoor absolute may be extracted also for the two different building types and the con
humidity leads to lower RH levels (Fig. 3d). The conclusion is similar struction age. Dwellings constructed between 1961 and 1975, followed
when we compare outdoor absolute and relative humidity for the by dwellings constructed before 60’s, present the highest shares in Cat. I.
different assessment categories (not presented). The values are higher Buildings constructed before the 60’s followed, by dwellings constructed
for single-family houses compared with apartments for every category after 1996, present also the highest shares in Cat. IV. The results of the
and in total. The negative values belong mainly to Cats. III and IV. All the statistical analysis regarding the Chi test of association, and more spe
categories apart from Cat. III do not pass the Shapiro-Wilk test for cifically the Cramer’s V value and the approximate significance values,
normality, with p-values lower than 0.05. Statistically significant dif are presented in the Appendix (Table A.2). All the values are lower than
ferences were found between the median values for all the four cate 0.25 and 8 out of 13 examined parameters present p-values lower than
gories (Table A.1). For single-family houses, a mean value for moisture 0.05.
supply for optimum conditions for indoor RH, higher than Cat. II, is 1.3 Finally, the percentage of the closed-kitchen area responses is 39.9%
g/m3 and for apartments equals to 1.0 g/m3 (1.2 g/m3 in total). The and 25.8%, for Cat. I and Cat. IV respectively (not presented). This
values are 84% and 85% (85% in total) and 5.3 g/m3 and 5.0 g/m3 (5.1 output probably related with the fact that the question refers to the
g/m3 in total) for outdoor RH and AH respectively. structure of the dwelling not the actual behavior, i.e. close the door, of
For the next three examined parameters: average U-value of the the users. For apartments, the shares are equal. For single-family houses
building with thermal bridges, average U-value of the windows and the open space responses are more than double compared with the close-
windows area to heated area ratio, no clear correlations and associations space responses. The Cramer’s V is pretty low and the approximate
with the assessment categories could be concluded (Fig. 3e, f, g). All the significance higher than the benchmark (Table A.2).
samples are not normally distributed, and the number of outliers is
considerable for every category and parameter. For the 3 analyses, there
are no statistically significant differences between the median values of 3.3. Building systems
all four categories with asymptotic significances higher than 5%, almost
in every comparison and examined parameter (4 out of 6; Table A.1). Fig. 4b presents the frequency bar chart of the four assessment RH
The average building U-value for every category is lower for single- categories for each of the heating systems of the examined dwellings.
family houses compared with apartments. The average U-value of the The systems with the highest share in Cat. I are the “own combustion
windows is 2 W/m2K for every RH category. The window area to heated boiler” followed by the directly produced electricity system (referred
living area ratio is higher for single-family dwellings, for Cats I and II, mainly to houses). On the other hand, the systems with the highest share
and lower for the remaining two categories. in Cat. IV are the pellet stove, followed by the district heating system.
Fig. 4a presents the frequency bar chart of the four RH assessment District heating is the major heating system for apartments (80.4%).
However, many single-family houses are connected to the system too.
9T. Psomas et al. Building and Environment 198 (2021) 107885
For single-family houses, the systems with the highest percentages are indoor environment in terms of RH. The results again are not so
heat pumps, district heating and directly produced electricity. District straightforward for single-family dwellings. For drying clothes indoors,
heating systems perform better, in terms of RH, in houses than in the conclusions are straightforward for both types of the dwellings (not
apartments. Heat pumps seems to be a trustworthy solution in houses for presented). The results of the statistical analysis regarding the Chi test of
acceptable RH levels, with 63.6% in optimum categories. association, Cramer’s V, and the approximate significance values are
Similar outputs were derived for the different examined ventilation presented in the Appendix (Table A.2).
systems (Fig. 4c). The ventilation systems with the highest share in Cat. I Apartments tend to ventilate their spaces daily or almost every day in
are natural ventilation, which is the most common system in single- a percentage of 70.9% compared with the houses in a percentage of
family houses, followed by return only ventilation. On the other hand, 54.7% (airing frequency). Apartment users open their windows all day
the systems with the highest share in Cat. IV are return only ventilation and for a few hours 25% and 46.1% respectively (airing practice). The
followed by supply and return ventilation with heat recovery. The share percentages for houses are 15.4% and 35.1% respectively. The analysis
of the optimum RH levels in naturally ventilated dwellings is more than for the different assessment categories and airing behaviors supports the
80% (Cats. I and II). This is further explored in Section 3.5. In 44.3% of conclusions analyzed earlier, whereby less frequent ventilation leads to
the houses natural ventilation is being used as the only ventilation sys higher RH levels. The Cramer’s V values are rather low and the
tem of the building. Return only ventilation system is typical for approximate significance values higher than the benchmark (both var
apartments, with existence in 71.9% of the cases. This system exists also iables; Table A.2).
in many single-family houses (24.4%). Supply and return ventilation
system without heat recovery is not found in many cases in the sample, 3.6. Health symptoms and complaints
but it performs well in terms of RH. Results related with exhaust air heat
pumps were merged in one category (Table 1). The Cramer’s V for The correlation and association of specific health symptoms and
heating and ventilation systems are higher than most of the other pa complaints with various building and system characteristics, occupancy
rameters and the approximate significance lower than 5% (Table A.2). behaviors and other parameters of the BETSI database has been con
In approximately 75% of the examined cases automated fans in ducted in many scientific publications in the past [43–46]. In these
bathrooms are not being used. The share is similar for both apartments analyses, humidity is represented either as a maximum/minimum or as
and houses. Analysis showed that the installation of automated fans in an average value. In this research study the indoor humidity condition
bathrooms increases the possibilities for the dwelling to have higher during heating season of a building is assessed using the entire mea
levels of RH and acceptable moisture content. The Cramer’s V is rela surement datasets and based on the described RH categories (Section
tively high and the approximate significance lower than the benchmark 2.3). In Table 4 the yes-response percentages for two aggregation
(Table A.2). Windows vents are common in apartments, at higher than groups, Cats. I-II (optimum) and Cats. III-IV (non-optimum) are pre
50%, but not in houses. No general conclusions may be extracted in sented. More than 800 responses, apart from the asthma responses, for
terms of RH for the use of windows vents in dwellings. The Cramer’s V is every health symptom and complaint were used in this analysis. The
rather low and the approximate significance higher than the benchmark reference period is 3 months in most of the cases. The reference period
(Table A.2). covers the monitoring period of the dwellings. For the optimum group,
the “yes” percentage is higher in 16 out of 20 categories compared with
3.4. Location the non-optimum (5 statistically significant differences). Asthma, dry
air, itchiness-pain-irritation in the eyes and static electricity are the
Fig. 4d presents the frequency bar chart of the four assessment RH health complaints and symptoms with higher “yes” percentage for the
categories for each of the 4 different Swedish climatic conditions of the non-optimum humidity group. In one out of four complaints, static
examined dwellings. The warmer the average outdoor conditions the electricity, the difference is also statistically significant. From the liter
higher the share of the optimum indoor conditions in terms of RH. Zone ature review it is clear that all these disturbances can be related with the
4 (southern part of Sweden) shows the best outputs. The majority of the humidity level indoors for shorter or longer periods or in parallel with
cases refers to single-family houses (82.9% of the examined population). other reasons (e.g. dust or pollution). Health symptoms such as tired
In terms of location, the residential neighborhoods (houses) and the ness, respiratory infections and headaches present very high
sparsely populated areas show the highest shares for optimum humidity yes-responses, for both aggregation groups. For symptoms like dry hands
indoors (Fig. 4e). High Cat. IV shares are presented for the remaining and irritated nose, which related with low RH, the optimum group
two groups. The Cramer’s V is again rather low and the approximate percentage is higher than the non-optimum. The results of the statistical
significance lower than the benchmark (both variables; Table A.2). analysis regarding the Chi test of association, and the Cramer’s V are
presented in the Appendix (Table A.3).
3.5. Occupancy and user behaviors
3.7. Multivariate analysis
Fig. 3h presents boxplot chart of the number of occupants in the
dwellings for the different assessment categories. Increase of the number The statistical analyses of the previous Sections highlight the most
of occupants increases the possibility for a dwelling to be at the optimum significant and dominant parameters that determine the indoor RH level
RH category. The average number of occupants in the examined apart of the dwellings. For the multinomial regression analysis model 9 out of
ments is 1.94 and in the houses 2.71. These numbers are close to the 21 parameters-variables of this analysis have been used (Tables 1 and 2).
average numbers of occupants for optimum categories of RH for both These parameters are easily obtained before the categorization process,
types, 2.00 and 2.74 respectively. Two occupants per dwelling is a for almost every residential building. Four of the variables are contin
prevailing number and a median for all the assessed categories. The uous (average indoor air temperature, total building volume, building
samples are again not normally distributed. The median differences ventilation air change rate and number of occupants) and 5 are nominal
between the assessed categories are statistically significant for three out (construction period, heating system, ventilation system, location and
of six combinations (Table A.1). climate zone). The remaining parameters based on the previous analysis
Analysis showed that the existence of pets increases the possibilities are secondary and less important. Many of these parameters related with
for an apartment to have higher levels of RH (not presented). The out the building use and because they were not monitored systematically,
puts are not so conclusive for houses. Similar conclusion was also they cannot be used for the development of a solid model and general
derived for the cooking process in apartments (not presented). The daily ization purposes. The reference category was Cat. IV. The regression
cooking, compared with the cooking 1–4 times per week, improves the coefficients, the standard errors of the coefficients, the Wald test results
10T. Psomas et al. Building and Environment 198 (2021) 107885 (statistically significance), the antilogarithms and the 95% confidence periods, this outcome suggests limited window opening behavior, interval bounds are presented for the 3 remaining categories in leading to higher humidity levels compared to the dwellings with Table A.4. The model was run on 413 cases (data for 9 parameters). The continuous ventilation. On the other hand, the systems with the less results of the likelihood ratio tests are respectively: 343.5, 81,
T. Psomas et al. Building and Environment 198 (2021) 107885
recorded along with other building systems. To our knowledge, hu dwellings during the heating season. The issue is more prevalent in
midifiers are not widely applied in the Swedish market for residential apartments than single-family houses. In addition, indoor low relative
buildings, even today. The number of the apartments in the examined humidity seems to be more extensive in dwellings with higher indoor
building stock population is under-represented. This limitation is temperature, smaller volume, higher ventilation rate and frequent airing
fundamental for future research and related with the development of practices, lower number of occupants and pets, constructed mainly after
guidelines for residential buildings, as far as indoor relative humidity 1985, in city suburbs and in the northern parts of the country. Lower
problems are concerned. In addition, the monitoring campaign was ventilation rates assure acceptable RH levels during heating period, but
conducted during the extended heating season, which corresponds to potentially non-acceptable conditions for hygienic reasons and pollut
autumn, winter and spring period in Sweden. It is widely acknowledged ants (0.5 ach benchmark). This leads to the challenging problem of
that the monitoring period for the dwellings, i.e. 10 days to three weeks, achieving the right balance between air quality factors when designing
is short to include significant weather changes. Periods with intense new buildings or renovating existing ones. U-value of the building ele
wind speed and rain, or high indoor-outdoor temperature differences ments and windows, and window to living area ratio are not important
may significantly influence the ventilation rate of dwellings. Periods factors associated with low humidity levels indoors. In dwellings with
with low outdoor air quality or noise may influence the occupants’ district heating (mainly apartments), exhaust heat pump systems or
behavior and habits (e.g. window use) and the measured environmental return only systems for ventilation and without bathroom fans are ex
parameters. This limitation is particularly important for the climatic pected to have low relative humidity conditions. On the other hand,
conditions of Sweden. Furthermore, the outdoor conditions were indoor activities, like cooking and drying of clothes improves, in terms
extracted from meteorological stations few kilometers away from the of RH, the indoor environment significantly. Moreover, moisture supply
dwellings (e.g. airports). As a result, the local microclimate and condi values are suggested, for optimum levels to avoid dry air, for different
tions were overlooked. Differentiation of the living routines over time is residential building types. These values refer only to the Swedish cli
also an import reason for deviations. Regulations suggest longer periods matic conditions or similar and during the heating season. The devel
for indoor humidity assessment, such as a month or a full heating season oped model may predict very accurately the relative humidity level of
[1,2]. The high amount of examined cases in this research aimed to the dwellings for the whole country, during heating season. Finally, this
compensate for this limitation. analysis offers additional evidence to the scientific literature for possible
Finally, there is a time lag between the monitoring campaign and the correlation of low relative humidity with specific health symptoms, and
questionnaire survey. The survey responses are based on personal complaints.
anamnesis and thoughts of the users and not on documented evidence, The conclusion and suggestions of the current research can be used
written on logbooks or other recording tools. The reported health for future planning of national survey campaigns of building stocks in
problems and complaints may have also been affected by this limitation Sweden or other countries with similar issues. The low relative humidity
in the research procedure. The logbooks can be also helpful for occu of the stock is a realistic air quality issue that has not been highlighted
pancy patterns documentation. These patterns cover indoor activities, enough in the official publications of the project and drastically affects
users’ habits (e.g. use of doors and windows) and systems’ operation. the building-users.
For health symptoms correlations and associations, a holistic assessment
of the indoor spaces used by the occupants is suggested for future Declaration of competing interest
analysis.
The authors declare that they have no known competing financial
6. Conclusions interests or personal relationships that could have appeared to influence
the work reported in this paper.
This research presents an assessment of the humidity conditions in
Swedish dwellings, including apartments and single-family houses, Acknowledgements
based on the monitoring campaign of the BETSI-survey, following a
state-of-the-art methodology. To our knowledge there is no previous The data analyzed in this paper is drawn from the BETSI database,
research analysis that assesses the indoor environment in terms of hu which was made available by Björn Mattsson at Boverket. The research
midity, in a holistic way, based on categories and their associations with was developed within the framework of the project “I-CUB: "Indoor
various parameters, such as building-systems characteristics, occupancy Climate-Users-Buildings" - interrelationships affecting residential ther
patterns and behaviors and health symptoms-complaints. The method mal comfort and building related health symptoms” which was funded
ology applied here is simple and easily communicated to developers, by The Swedish Research Council FORMAS (project Nr 2018-00698).
stakeholders, policy makers and building users. This work was also supported by the Swedish Energy Agency (project Nr
Analysis shows that low indoor RH is a realistic issue in Swedish 2018-006191).
Appendix A
Table A.1
Pairwise comparisons of relative humidity categories, independent samples Kruskal-Wallis test results (adjusted asymptotic significance values), for different
parameters.
a/a I-II I-III I-IV II-III II-IV III-IV
Indoor air temperature * * * 0.232 * *
Building volume 1.000 0.031 * 0.093 * 0.009
Ventilation air change rate, building level * * * 0.036 * 0.094
U-value, building level, thermal bridging 1.000 0.204 0.003 0.363 0.008 1.000
U-value windows 1.000 0.076 * 0.345 * 0.074
Delta absolute humidity or indoor moisture supply (in-out) 0.016 * * 0.018 * *
Window area to heated living area ratio 0.706 0.008 0.042 0.499 0.666 1.000
Number of occupants 0.215 0.002 * 0.266 0.007 1.000
Relative humidity outdoor 0.031 * * * * 0.685
Absolute humidity outdoor 0.023 * * * * *
12T. Psomas et al. Building and Environment 198 (2021) 107885
*Lower than 0.0005.
Table A.2
Chi-Square test results, Cramer’s V value and approximate significance, for different categorical parameters.
a/a Variable Cramer’s V value Approximate significance
1 Construction period 0.210 *
2 Heating system 0.213 *
3 Ventilation system 0.234 *
4 Location 0.197 *
5 Climate zone 0.190 *
6 Automated bathroom fan 0.226 *
7 Window vents 0.115 0.111
8 Closing kitchen area 0.119 0.090
9 Pets 0.103 0.186
10 Cooking 0.132 0.014
11 Airing frequency 0.067 0.730
12 Airing practice 0.099 0.157
13 Drying clothes indoor 0.158 0.010
*Lower than 0.0005.
Table A.3
Chi-Square test results and Cramer’s V value, for different health symptoms and
complaints.
a/a Variable Cramer’s V value
1 Stuffy air 0.123
2 Dry air 0.056
3 Static electricity 0.085
4 Stuffy smell 0.144
5 Tiredness 0.045
6 Heavy head 0.117
7 Headache 0.043
8 Nausea/dizziness 0.065
9 Difficulty to concentrate 0.039
10 Itchiness/pain/irritation eye 0.064
11 Irritated/stuffy or runny nose 0.068
12 Huskiness/throat dryness 0.039
13 Cough 0.104
14 Dry or red skin face 0.084
15 Itchiness/peeling in hair/ears 0.097
16 Dry/itchy/red skin in hands 0.078
17 Respiratory infection 0.075
18 Asthma 0.123
19 Eye sensitivity 0.091
20 Dust and dirt 0.020
*Lower than 0.0005.
Table A.4
Multinomial logistic regression model parameter estimates: regression coefficients, standard errors of the coefficients, Wald test results (statistically significance),
antilogarithms and the 95% confidence interval bounds.
Relative humidity categorya B Std. Error Wald df Sig. Exp(B) 95% Confidence Interval for Exp(B)
Lower Bound Upper Bound
I Intercept 79.165 1071.563 .005 1 .941
Average indoor temperature (OC) − 2267 .458 24.558 1 .000 .104 .042 .254
Building volume (m3) -.010 .003 10.074 1 .002 .990 .984 .996
Air change rate building (1/h) − 13.923 2355 34.945 1 .000 8.985E-7 8.887E-9 9.083E-5
Number of occupants 1515 .415 13.332 1 .000 4548 2017 10.253
[Construction period = 1] -.614 1376 .199 1 .655 .541 .036 8028
[Construction period = 2] -.511 1272 .162 1 .688 .600 .050 7251
[Construction period = 3] 2959 1615 3357 1 067 19.275 .813 456.696
[Construction period = 4] 1474 1440 1048 1 .306 4367 .260 73.480
[Construction period = 5] 0b . . 0 . . . .
c
[Heating system = 2] 18.432 7772.722 .000 1 .998 .000 .
c
[Heating system = 3] 14.028 1606.969 .000 1 .993 .000 .
[Heating system = 4] − 2048 1793 1305 1 .253 .129 .004 4329
[Heating system = 5] -.605 1745 .120 1 .729 .546 .018 16.712
[Heating system = 6] 1563 2507 .389 1 .533 4772 .035 649.291
[Heating system = 8] − 2228 1263 3114 1 .078 .108 .009 1280
c
[Heating system = 10] 33.834 4067.140 .000 1 .993 .000 .
[Heating system = 12] − 6083 3453 3103 1 .078 .002 2.626E-6 1983
[Heating system = 13] 0b . . 0 . . . .
[Ventilation system = 1] − 1376 1358 1027 1 .311 .253 .018 3615
(continued on next page)
13T. Psomas et al. Building and Environment 198 (2021) 107885
Table A.4 (continued )
Relative humidity categorya B Std. Error Wald df Sig. Exp(B) 95% Confidence Interval for Exp(B)
Lower Bound Upper Bound
c
[Ventilation system = 2] 14.145 1272 123.683 1 .000 114.935.018 16.815.481.928
[Ventilation system = 3] − 5560 1684 10.907 1 .001 .004 .000 .104
[Ventilation system = 4] − 44.840 8226.250 .000 1 .996 3.360E-20 .000 .
[Ventilation system = 5] − 7292 2044 12.735 1 .000 .001 1.240E-5 .037
[Ventilation system = 7] 0b . . 0 . . . .
[Location of the building = 1] − 1176 1403 .703 1 .402 .309 .020 4821
[Location of the building = 2] 2282 2207 1069 1 .301 9794 .129 741.005
[Location of the building = 3] -.079 1190 .004 1 .947 .924 .090 9509
[Location of the building = 4] 0b . . 0 . . . .
[Climate zone = 1] − 24.605 1071.500 .001 1 .982 2.062E-11 .000 .
[Climate zone = 2] − 21.023 1071.499 .000 1 .984 7.412E-10 .000 .
[Climate zone = 3] − 19.622 1071.498 .000 1 .985 3.007E-9 .000 .
[Climate zone = 4] 0b . . 0 . . . .
II Intercept 61.594 1071.560 .003 1 .954
Average indoor temperature (OC) − 1577 .444 12.623 1 .000 .207 .087 .493
Building volume (m3) -.009 .003 8197 1 .004 .991 .985 .997
Air change rate building (1/h) − 8132 2099 15.003 1 .000 .000 4.800E-6 .018
Number of occupants 1069 .400 7156 1 .007 2912 1331 6372
[Construction period = 1] -.017 1300 .000 1 .990 .983 .077 12.564
[Construction period = 2] -.699 1210 .334 1 .563 .497 .046 5324
[Construction period = 3] 3445 1558 4885 1 .027 31.328 1477 664.530
[Construction period = 4] 2043 1333 2349 1 .125 7714 .566 105.192
[Construction period = 5] 0b . . 0 . . . .
c
[Heating system = 2] 15.726 7772.722 .000 1 .998 .000 .
c
[Heating system = 3] 13.942 1606.969 .000 1 .993 .000 .
[Heating system = 4] − 4025 1778 5125 1 .024 .018 .001 .583
[Heating system = 5] -.852 1685 .256 1 .613 .426 .016 11.587
[Heating system = 6] -.105 2343 .002 1 .964 .900 .009 88.810
[Heating system = 8] − 2113 1220 3000 1 .083 .121 .011 1321
c
[Heating system = 10] 33.823 4067.140 .000 1 .993 .000 .
[Heating system = 12] − 6424 3439 3490 1 .062 .002 1.919E-6 1371
[Heating system = 13] 0b . . 0 . . . .
[Ventilation system = 1] -.578 1316 .193 1 .661 .561 .043 7402
c
[Ventilation system = 2] 15.806 .905 304.706 1 .000 1240967.583 43179092.108
[Ventilation system = 3] − 3808 1584 5780 1 .016 .022 .001 .495
[Ventilation system = 4] − 43.981 9693.650 .000 1 .996 7.933E-20 .000 .
[Ventilation system = 5] − 4351 1910 5190 1 .023 .013 .000 .545
[Ventilation system = 7] 0b . . 0 . . . .
[Location of the building = 1] − 1098 1323 .688 1 .407 .334 .025 4460
[Location of the building = 2] 2427 2187 1231 1 .267 11.323 .156 823.608
[Location of the building = 3] -.595 1077 .305 1 .581 .552 .067 4554
[Location of the building = 4] 0b . . 0 . . . .
[Climate zone = 1] − 20.773 1071.499 .000 1 .985 9.518E-10 .000 .
[Climate zone = 2] − 19.553 1071.498 .000 1 .985 3.222E-9 .000 .
[Climate zone = 3] − 18.281 1071.498 .000 1 .986 1.150E-8 .000 .
[Climate zone = 4] 0b . . 0 . . . .
III Intercept 56.075 1071.559 .003 1 .958
Average indoor temperature (OC) − 1395 .441 10.016 1 .002 .248 .105 .588
Building volume (m3) -.008 .003 6440 1 .011 .992 .986 .998
Air change rate building (1/h) − 5842 2049 8128 1 .004 .003 5.236E-5 .161
Number of occupants .822 .394 4360 1 .037 2275 1052 4923
[Construction period = 1] -.764 1276 .358 1 .549 .466 .038 5685
[Construction period = 2] -.594 1166 .260 1 .610 .552 .056 5423
[Construction period = 3] 2940 1539 3648 1 .056 18.922 .926 386.625
[Construction period = 4] 1857 1314 1998 1 .158 6403 .488 84.065
[Construction period = 5] 0b . . 0 . . . .
[Heating system = 2] − 2397 10.081.136 .000 1 1000 .091 .000 .
c
[Heating system = 3] 13.694 1606.969 .000 1 .993 .000 .
[Heating system = 4] − 3793 1782 4529 1 .033 .023 .001 .741
[Heating system = 5] − 1583 1682 .886 1 .347 .205 .008 5550
[Heating system = 6] .319 2221 .021 1 .886 1375 .018 106.935
[Heating system = 8] − 2078 1204 2979 1 .084 .125 .012 1325
c
[Heating system = 10] 32.488 4067.139 .000 1 .994 .000 .
[Heating system = 12] − 23.877 6708.774 .000 1 .997 4.268E-11 .000 .
[Heating system = 13] 0b . . 0 . . . .
[Ventilation system = 1] -.140 1303 .012 1 .914 .869 .068 11.167
c
[Ventilation system = 2] 15.639 .000 . 1 . 6190734.476 6190734.476
[Ventilation system = 3] − 3213 1559 4248 1 .039 .040 .002 .854
[Ventilation system = 4] − 22.569 1071.502 .000 1 .983 1.580E-10 .000 .
[Ventilation system = 5] − 3393 1884 3244 1 .072 .034 .001 1349
[Ventilation system = 7] 0b . . 0 . . . .
[Location of the building = 1] -.767 1301 .348 1 .555 .464 .036 5945
[Location of the building = 2] 2930 2178 1809 1 .179 18.720 .262 1337.539
[Location of the building = 3] -.710 1058 .450 1 .502 .492 .062 3913
(continued on next page)
14You can also read