Population Disaggregation on the Building Level Based on Outdated Census Data
←
→
Page content transcription
If your browser does not render page correctly, please read the page content below

International Journal of
              Geo-Information

Article
Population Disaggregation on the Building Level Based on
Outdated Census Data
Elias Pajares 1, * , Rafael Muñoz Nieto 1 , Liqiu Meng 2 and Gebhard Wulfhorst 1

                                          1   School of Engineering and Design, Chair of Urban Structure and Transport Planning, Technical University of
                                              Munich, 80333 Munich, Germany; rafael.nieto@tum.de (R.M.N.); gebhard.wulfhorst@tum.de (G.W.)
                                          2   School of Engineering and Design, Chair of Cartography, Technical University of Munich,
                                              80333 Munich, Germany; liqiu.meng@tum.de
                                          *   Correspondence: elias.pajares@tum.de

                                          Abstract: A wide range of disciplines require population data with high spatial resolution. In
                                          particular, accessibility instruments for active mobility need data on the building access level. Data
                                          availability varies by context. Spatially detailed national census counts often present the challenge
                                          that they are outdated. Therefore, this study proposes a novel approach to hybrid population
                                          disaggregation. It updates outdated census tracts and disaggregates population on the building
                                          access level. Open and widely available data sets are used. A bottom-up population estimation
                                          for new development areas is combined with a top-down dasymetric mapping process to update
                                          outdated census tracts. A particular focus lies on the high flexibility of the developed procedure.
                                          Accordingly, users can utilize diverse data and adapt settings to a specific study context. Instead
                                          of requiring ubiquitous 3D building data, often unavailable free of charge, the approach suggests

                                          collecting building levels only in new development areas. The open-source software development
                                   was done using PostgreSQL/PostGIS as part of the co-creative development of the accessibility
Citation: Pajares, E.; Muñoz Nieto,       instrument GOAT in three German municipalities. A comparison with reference data from the
R.; Meng, L.; Wulfhorst, G.               population registry of one district was realized. On the building level, an R2 of 0.82, and on the
Population Disaggregation on the          grid level (100 m × 100 m), an R2 of 0.89 is reached. The approach stands out when land-use
Building Level Based on Outdated          information is outdated; however, a spatially detailed census grid exists, but no ubiquitous 3D
Census Data. ISPRS Int. J. Geo-Inf.       building information is available. Enhancements are proposed, such as improving the dasymetric
2021, 10, 662. https://doi.org/           mapping with machine learning and remote sensing techniques. Moreover, more reliable detection
10.3390/ijgi10100662
                                          of new building development in already built-up areas is suggested to account better for urban
                                          densification.
Academic Editor: Wolfgang Kainz

                                          Keywords: population disaggregation; accessibility; open data
Received: 1 August 2021
Accepted: 21 September 2021
Published: 1 October 2021

                                          1. Introduction
Publisher’s Note: MDPI stays neutral
with regard to jurisdictional claims in        Up-to-date high-resolution population data are essential for understanding a dynamic
published maps and institutional affil-   environment and thus conducting accurate urban and spatial planning studies [1]. High-
iations.                                  resolution population data provide public authorities, non-governmental organizations,
                                          companies, and academics the possibility to design solid development metrics. This
                                          optimizes interventions in their respective communities [2], organizes an accurate response
                                          to natural disasters [2–5], and is the foundation for many other studies. In contrast,
Copyright: © 2021 by the authors.         aggregated data risks masking important hotspots and smoothing out spatial variations
Licensee MDPI, Basel, Switzerland.        inside the population [6].
This article is an open access article         In the field of transport, studies related to non-motorized modes (walking and cy-
distributed under the terms and           cling) require high-resolution population data at the building scale. For instance, walking
conditions of the Creative Commons        accessibility studies require detailed population data to calculate the benefited population
Attribution (CC BY) license (https://     within a specified walking or cycling distance to a new public transport station or a set
creativecommons.org/licenses/by/          of points of interest [7,8]. Moreover, spatially disaggregated data are needed to define a
4.0/).

ISPRS Int. J. Geo-Inf. 2021, 10, 662. https://doi.org/10.3390/ijgi10100662                                        https://www.mdpi.com/journal/ijgi
ISPRS Int. J. Geo-Inf. 2021, 10, 662                                                                                           2 of 21

                                       more granular traffic analysis zone system, known as non-motorized traffic analysis zones
                                       (NM-TAZ), as an approach to analyzing walking and cycling inter-zonal trips [9].
                                             Even though the demand for high-resolution population data is increasing, detailed
                                       databases often remain scarce or unavailable, due to limitations on the collection of indi-
                                       vidual micro-data [10,11]. For confidentiality reasons, public data are aggregated [6,12],
                                       or could be available but not digitized [9,13]. Therefore, the census population data are
                                       usually grouped by census tracts [14].
                                             The use of raw census data has many implications to be considered before their use.
                                       First, census tracts polygons are designed according to administrative criteria to facilitate
                                       zone enumeration rather than specific demographic parameters [15,16], which can mislead
                                       results for demographic studies due to the effect of the modifiable area unit problem [17].
                                       Second, due to their complexity and high cost, censuses are only conducted every 5, 10,
                                       or even 20 years, and therefore misrepresent the current population conditions; for instance,
                                       the latest German census was conducted in 2011 [18], while between 2011 and 2020, the
                                       populations of cities such as Munich have experienced a growth rate of 9% [19,20]. New
                                       population distribution cannot be easily anticipated. However, new development areas
                                       attract new inhabitants at higher rates than established neighborhoods. While census tracts
                                       are not frequently updated, up-to-date population counts are often available on the city,
                                       district, or even sub-district levels. The lack of high-resolution data is treated through the
                                       application of spatial disaggregation methods [21]. Spatial disaggregation is the process
                                       by which information on a coarse spatial scale is transformed into finer scales [2]. There
                                       are a variety of approaches, each based on different assumptions about the distributional
                                       information [16]. Disaggregation methods can be grouped into two categories: areal
                                       interpolation methods and statistical modeling methods [22]. Statistical methods consist
                                       of constructing stochastic models to generate simulated (or synthetic) distributions of
                                       population [23], for example, the iterative proportional fitting method [10,24].
                                             Areal interpolation methods consist of transforming data from a source zone to many
                                       smaller and non-intersecting target zones [12,14]. Areal interpolation methods can be
                                       further classified into two categories, based on whether they use ancillary data or not [12].
                                       Areal interpolation with ancillary information uses external data, usually land use or
                                       transportation networks, to refine population interpolation. Dasymetric mapping is one
                                       of the most popular methods in this category [25], which consists of refining polygons by
                                       discarding uninhabited areas obtained from ancillary data [9,26,27]. Areal interpolation
                                       without ancillary data can be either point-based or areal-based [22]. Point-based methods
                                       rely on census points to create a continuous representation of the population [12,16,28].
                                       The continuous surfaces then support a wide range of spatial analytic processes [29].
                                       The areal-based methods, also known as volume-preserving methods, target the calculation
                                       of the proportional distribution of the population with weighted factors [1–3,9,12,22]. Their
                                       advantage is the use of control units, which preserve the total number of the population.
                                             Most recent studies propose to combine different methods to increase the accuracy,
                                       often starting with a dasymetric process [6]. The hybrid process combines a dasymetric
                                       analysis with a fit regression model, dasymetric techniques with machine-learning algo-
                                       rithms [11,30]. A two-step disaggregation is proposed based on a dasymetric processing
                                       and a weighted distribution method using 3D building information [2].
                                             As the finer population at the building level has gained importance, different research
                                       has studied population disaggregation at this level. LiDAR data were used to detect build-
                                       ing characteristics, such as footprint and volume to obtain detailed population data [31,32].
                                       Bast et al. (2015) disaggregated population on the building level using OSM and population
                                       counts on the municipality level [33]. The population was recently also disaggregated to a
                                       10 m × 10 m grid for the whole of Germany. Using remote sensing techniques, building
                                       settlement structures and buildings volumes were derived from Sentinel-1 and Sentinel-2
                                       data. The disaggregation combines a bottom-up population estimation with a top-down
                                       dasymetric mapping process [34].
ISPRS Int. J. Geo-Inf. 2021, 10, 662                                                                                          3 of 21

                                            The review of the presented studies is far from complete, but it can be concluded
                                       that: First, a comprehensive spectrum of disaggregation approaches exists depending
                                       on the available information type and the study purpose. Second, there is no systematic
                                       framework for data disaggregation [12], and in the worst case, each study has to develop
                                       their own models. This problem tends to occur due to the diversity of input data and
                                       use cases that makes the standardization process more complex. Furthermore, deriving
                                       accurate population data on the building level without ubiquitous 3D building information
                                       is particularly challenging. Besides the fact that 3D building data does not exist in every
                                       context, it is often expensive to procure. For example, standardized building data are
                                       available nationwide in Germany in the CityGML specification LOD 1 and LOD 2, but the
                                       data are not openly accessible in many German states [35].
                                            In this context, this paper proposes a standardized four-step hybrid approach to
                                       calculate high-resolution population data at the building-access level, based on widely
                                       available data sources. It uses a bottom-up population estimation for new development
                                       areas and a top-down dasymetric mapping process. Outdated census tracts are updated
                                       to a respective target year and then disaggregated to the building access level. There is
                                       no intention to derive additional demographic characters. Particular attention is paid to
                                       the balance between standardization and flexibility of the data used for the procedure.
                                       Accordingly, mostly open-source databases, like OpenStreetMap (OSM) or National Open
                                       Data Portals, are utilized. A focus is placed on developing a re-usable and highly flexible
                                       script that can cope with varying data quality. This process is realized with population data
                                       on the district level and land-use data from the target year. While it is generally expected
                                       that 3D building data would improve the procedure results, the presented approach aims
                                       to work without ubiquitous 3D building data. Instead, it suggests the collection of building
                                       levels only for selected building footprints in new development areas.

                                       2. Materials and Methods
                                       2.1. Study Context
                                            The approach is developed as part of the Geo Open Accessibility Tool (GOAT)
                                       project [36], an open-source planning instrument focused on modelling active mobility
                                       and local accessibility. One of the main data sources for the application is population
                                       numbers at the building access level. GOAT was developed in a co-creative process in
                                       collaboration with practitioners from the City of Munich, Freising and Fürstenfeldbruck in
                                       southern Germany. Therefore, the development of the presented procedure was applied to
                                       the mentioned municipalities visualized in Figure 1.

                                       Figure 1. Studied municipalities.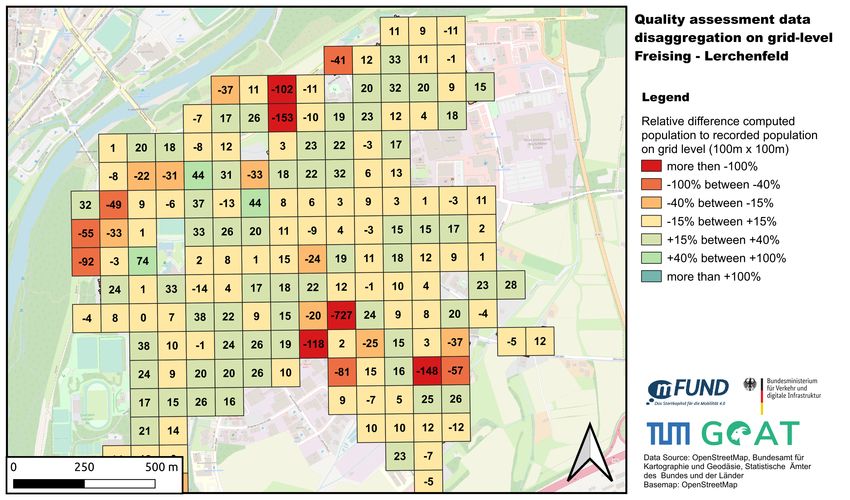
ISPRS Int. J. Geo-Inf. 2021, 10, 662                                                                                              4 of 21

                                            In the last few years, all three municipalities have experienced significant population
                                       growth. Munich is the Free State of Bavaria capital, with approximately 1.488 million
                                       inhabitants, and Germany’s third-largest city. It thus outnumbers the much smaller mu-
                                       nicipalities of Freising (48,872 inhabitants) and Fürstenfeldbruck (36,843 inhabitants) [20].
                                       All three municipalities have a historical center and contain areas with diverse spatial
                                       typologies. The City of Munich is the most densely populated municipality in Germany,
                                       with a population density of 4777 inhabitants per km2 [37]. Accordingly, urban spatial
                                       typologies dominate many districts. However, the outer districts also comprise suburbs
                                       with relatively low density and high-rise housing estates developed in the 1960s and 1970s.
                                       Freising and Fürstenfeldbruck are less densely populated and contain rural settlement
                                       structures in their outer districts. In the City of Munich, new housing development is
                                       almost exclusively realized in multi-family dwellings, either in new development areas or
                                       through densification in the existing built environment. Moreover, in the municipalities of
                                       Freising and Fürstendfeldbruck, a trend toward multi-family dwellings can be observed.

                                       2.2. Data
                                            The Table 1 lists all data sources used in this study with their respective reference year.
                                       The listed data can be considered a sample, as the developed procedure works with data
                                       from other contexts representing the same objects. Furthermore, if not available, only parts
                                       of the data sets are required (see Section 3.1).

                                              Table 1. Data used for population disaggregation.

              Data Set                         Official Name                          Data Provider                   Reference Year
              Land-use                  Urban Atlas LCLU 2018 [38]        European Environment Agency (EEA)                2018
              Land-use                  OpenStreetMap raw files [39]            OpenStreetMap contributors                 2021
                                                                         Landesamt für Digitalisierung, Breitband
              Land-use                     ATKIS Basis-DLM [40]                                                            2020
                                                                                  und Vermessung Bayern
         Points of Interest             OpenStreetMap raw files [39]            OpenStreetMap contributors                 2021
        Building attributes             OpenStreetMap raw files [39]            OpenStreetMap contributors                 2021
                                                                         Landesamt für Digitalisierung, Breitband
        Building footprints               ALKIS Hausumringe [41]                                                           2020
                                                                                  und Vermessung Bayern
                                                                          Statistische Ämter des Bundes und der
         Census Germany                     Census Germany [18]                                                            2011
                                                                                         Länder
  City districts with population
                                              Stadtbezirksteile          City of Munich, Freising, Fürstenfeldbruck        2021
             numbers

                                            All data are represented as spatial vector data in the XML format, as Shapefile or
                                       GeoPackage. The presented data sets are either openly accessible or provided free of charge
                                       by the local public authorities. The data were downloaded in the specific raw formats
                                       for the study and converted into the spatial reference system EPSG 4326. Later, the data
                                       were imported into the spatial database system (see Section 2.3) for processing. In Figure 2,
                                       most of the used data sets are visualized. Three different sources were used for land-use
                                       data. While the land use data originating from the official ATKIS Basis-DLM contain
                                       only formally defined land-use categories, the data from OSM also contain categories that
                                       contributors defined. Furthermore, the land use data from OSM can contain overlapping
                                       geometries, which is not the case for the other land use data. The land use information from
                                       Urban Atlas is standardized by the European Environment Agency and again contains a
                                       different classification. As reference data set for the comparison with the disaggregated
                                       population (see Section 3.6), counts on the address level were provided by the City of
                                       Freising for their largest district, Lerchenfeld. These data originate from their municipal
                                       population register. In Germany, there is an existing obligation to register at a specific
                                       address. Therefore, the data can be regarded as remarkably accurate.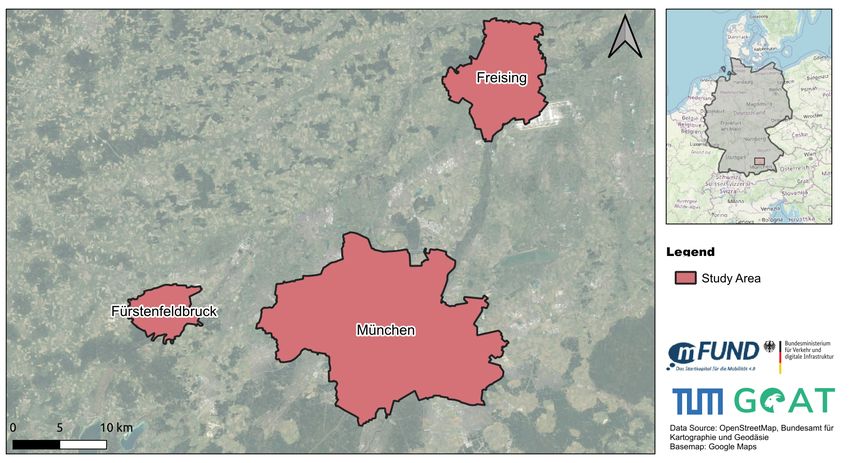
ISPRS Int. J. Geo-Inf. 2021, 10, 662                                                                                           5 of 21

                                       Figure 2. Core spatial data used.

                                             Building footprints were used from the official source ALKIS and OSM. The building
                                       footprint of ALKIS usually consists of one building per address. A building in OSM may
                                       correspond to several buildings in ALKIS, and vice versa. While building footprints are
                                       not mapped everywhere in OSM, almost all buildings exist in OSM for the study context.
                                       Furthermore, the OSM data on the building footprints were usually more up-to-date than
                                       the available data from ALKIS. Due to the active OSM community in the study area,
                                       new buildings are usually mapped during construction. Although the building type is
                                       collected in ALKIS, this information was not shared by the public authority. Accordingly,
                                       the available building footprints in ALKIS do not contain information on the use of the
                                       building. This information, however, exists for approximately 66.17% of the buildings in
                                       OSM in the City of Munich.
                                             Finally, the Census of Germany is a vector layer with the population for each census
                                       tract. In this case, each census tract is represented by a 100 m × 100 m square grid and was
                                       last updated in 2011. In addition to the total population, census tracts contain demographic
                                       information, such as age groups and citizenship. The German census is repeated every ten
                                       years (the next one in 2022); the currently available data is out-of-date.

                                       2.3. Software
                                            GOAT is a WebGIS application created with various open-source software (see Figure 3).
                                       For the development, the software was installed on a ThinkPad T470 with 16 GB of RAM
                                       and an i7 processor running the Linux distribution Ubuntu LTS 18.04. The setup was
                                       running with a Docker container. To set up the application, a step-by-step guide exists on the
                                       project website [42].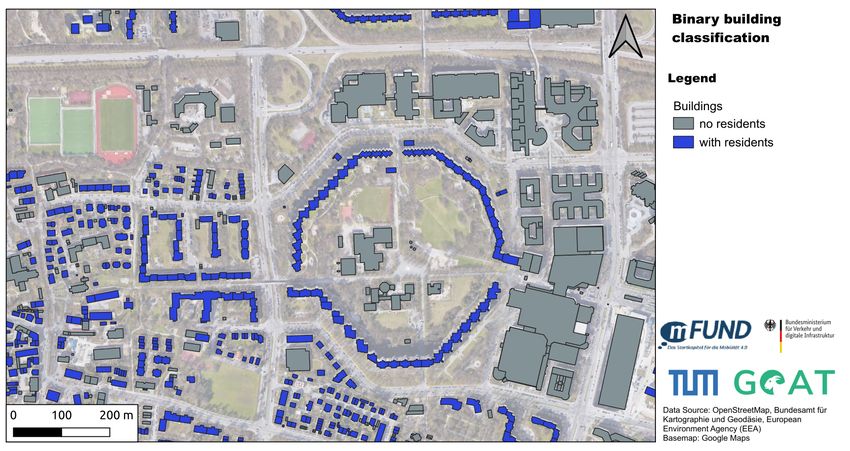
ISPRS Int. J. Geo-Inf. 2021, 10, 662                                                                                         6 of 21

                                       Figure 3. GOAT Architecture [43].

                                             The core of the application is a spatial database system consisting of PostgreSQL 12
                                       and PostGIS 3. A custom Debian-based database image was used as the database docker
                                       image [36]. Accordingly, the presented procedure is written in SQL, making extensive use
                                       of the spatial functions provided in PostGIS. Besides classical SQL, the SQL Procedural
                                       Language PL/pgSQL is used to develop database functions and in anonymous code
                                       blocks. In addition, Python functions are developed to execute the different SQL scripts
                                       automatically and to import the required data. These functions are integrated into the
                                       GOAT setup routines. If running the GOAT setup, the procedure is executed automatically,
                                       but can also be triggered manually. Customization can be realized in the configuration
                                       file “goat_config.yaml” and when preparing the raw data. A detailed description of data
                                       preparation and the options for configuration are provided on the project website [44].
                                       For the data visualization and the creation of maps, QGIS is utilized. The developed source
                                       code has been frequently published on Github and is available here [42]. If data were
                                       collected, it was performed directly with the OSM iD editor and JOSM. The most recent
                                       changes in the OSM database were frequently fetched using the daily dumps and the
                                       Overpass API.

                                       3. Results
                                            The population disaggregation approach presented in this paper is composed of four
                                       steps: 1. Fusion of Building data and Dasymetric mapping, 2. Detection of building
                                       entrances and new development areas, 3. Updating of census tracts, and 4. Population
                                       distribution. As part of the workflow, data verification and collection is suggested in the
                                       respective areas. To ensure high flexibility of the procedure, users can customize important
                                       settings in a configuration file.
                                            The overview of the procedure can be seen in Figure 4. The developed table schema
                                       will be presented in the following section, and then the individual steps will be elabo-
                                       rated further.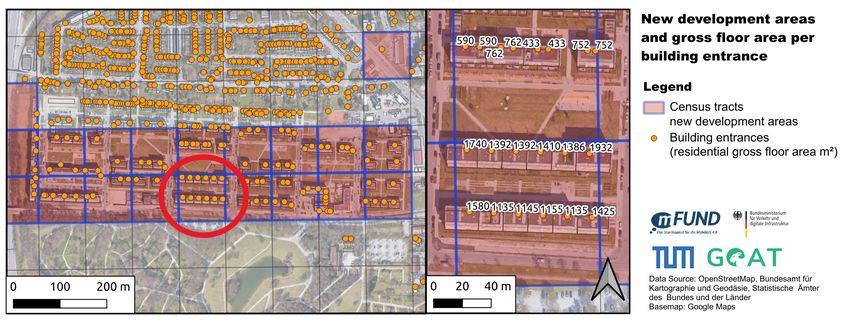
ISPRS Int. J. Geo-Inf. 2021, 10, 662                                                                                          7 of 21

                                       Figure 4. Overview procedure.

                                       3.1. Table Schema
                                            For the presented data (see Section 2.2), a suitable table schema was developed. Two
                                       schemas are defined for a high flexibility on the data used: required (see Figure 5) and
                                       optional (see Figure 6).

                                       Figure 5. Required input tables.

                                              For required tables, there are only defined minimum data requirements. Accordingly,
                                        only data from OSM, census tracts and administrative boundaries with up-to-date popula-
                                        tion data are needed. While the required data is sufficient to make the procedure work,
                                        especially when OSM Data lacks completeness, the optional data tables are suggested to
                                        obtain better results. Furthermore, not all attributes, but only the attributes labeled with
                                       ‘not null’ in Figures 5 and 6, are required.
                                              As output schema, the tables in the Figure 7 are produced as either intermediate or
                                        final results. While the presented table attributes and data types are identical to the SQL
                                        implementation, the table names differ slightly to read the figures better. A translation of
                                        the table names into the names used in the SQL scripts is in the Appendix A.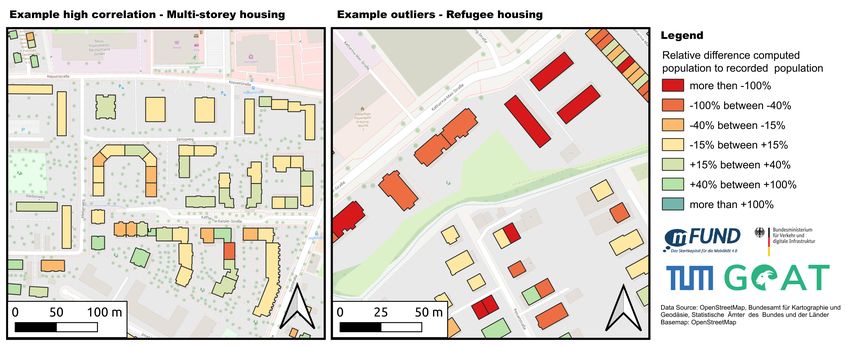
ISPRS Int. J. Geo-Inf. 2021, 10, 662                                                                                           8 of 21

                                       Figure 6. Optional input tables.

                                       Figure 7. Data structure output tables.

                                       3.2. Fusion of Building Data and Dasymetric Mapping
                                             As visualized in Figure 8, this first step consolidates the different building data
                                       sets. Therefore, the OSM data (if available, custom building data) are fused by spatial
                                       intersection. If available, a priority is given to the custom building data set, and fusion
                                       is performed based on the largest share of spatial intersections, in case there are multiple
                                       intersections. If available, attributes such as building type and building levels are combined
                                       from OSM and custom building footprints. If the height of buildings is known, the number
                                       of floors is computed using average height per building level. If neither the height nor the
                                       building levels are available, a default number of building levels is assigned per district
                                       of the study area. In the study, this average varied from one to five, depending on the
                                       district and municipality. This value was derived from the author’s knowledge of the
                                       study context, and was assigned to each district. Another option will be assigning the
                                       observed average from a reference data set, such as OSM if building levels are available for
                                       a statistically significant number of buildings.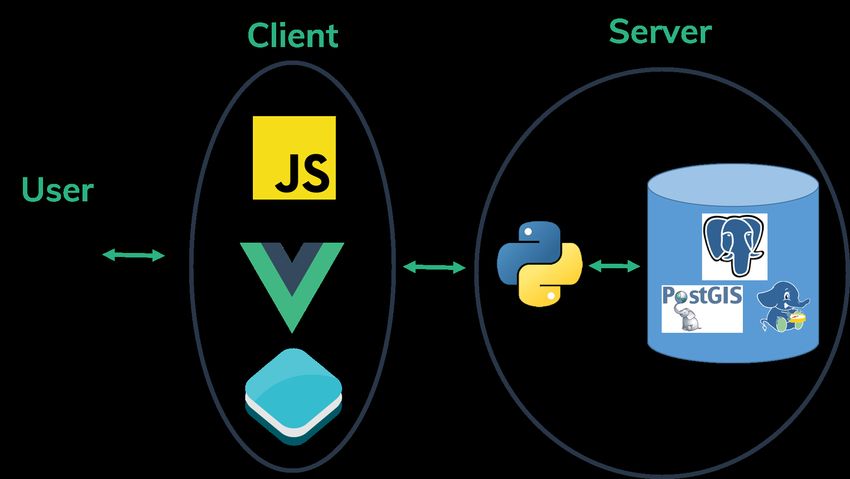
ISPRS Int. J. Geo-Inf. 2021, 10, 662                                                                                           9 of 21

                                       Figure 8. Fusion building data and dasymetric mapping.

                                             Next, dasymetric mapping is performed to identify buildings with residents. Sim-
                                       plified binary classification is applied to categorize buildings into “with residents” and
                                       “no residents”. Therefore, buildings are first classified using the attributes building and
                                       amenity, which specify the use of the building. For the classification, users can define a
                                       list of residential and non-residential categories in the configuration file. However, as is
                                       common in OSM, there is no specification on the building type. Therefore, other auxiliary
                                       data are needed to classify the buildings further. Land use data from OSM is used as the
                                       default data set, and (if available), two more custom land-use data sets can be provided.
                                       For each of the land use data sets, a configuration of different categories contains informa-
                                       tion on whether the buildings are residential or not. Accordingly, land use categories such
                                       as industrial or commercial can be labeled as non-residential, while residential use can be
                                       labeled as residential. If multiple files are provided, a hierarchy between the land-use files
                                       can be defined if the data sets assign contradicting categories to the buildings.
                                             A particular challenge, however, is the detection of outbuildings such as detached
                                       garages or garden houses. In this case, a final filter is applied using a minimum residential
                                       building size of square meters to label these non-residential buildings. Similar to other
                                       settings, this filter can be customized to the local study context. After that, ground floor
                                       commerce is identified using a set of points of interest from OSM. If buildings have ground
                                       floor commerce, the residential floor levels are reduced by one floor. If no ground floor
                                       commerce exists, it is assumed that all floors are residential. Finally, the residential gross
                                       floor area is calculated per building using the following equitation:

                                                                      G = A × ( NBL + 0.5 × NRL)                                  (1)

                                       where G is the residential gross floor area in m2 , A is the area of the building footprint in
                                       m2 , NBL is the number of residential floors and NRL is the number of roof levels. As the
                                       final result of this step, a fused building data table is saved and made available for the
                                       subsequent steps. The final result of the process is visualized in a chosen neighborhood in
                                       Munich in Figure 9.
ISPRS Int. J. Geo-Inf. 2021, 10, 662 10 of 21
Figure 9. Binary classification buildings.
3.3. Detection of Building Entrances and New Developments Areas
In this step, the procedure is intended to estimate access points to buildings and
identify census tracts recognized as areas of new residential development (see Figure 10).
The entrances and addresses are identified from OSM point data (if available) or based
on the edge of the building closest to the OSM street network. If several access points
are identified in one building, the residential gross floor area is equally distributed. It is
also possible to complement data by feeding in custom population point data sets. This
optional data set allows one to specify the exact number of residents for a given access
point. If buildings intersect points from the custom population data set, their population is
considered static for the upcoming steps.
Figure 10. Detection of building entrances and New development areas.
Subsequently, these entrances containing building-related data are compared with
census tracts. If the census tract has no recorded population but contains a residential
access point, it is labeled a census tract with new development. The population is computed
bottom-up using the residential gross floor area and an average gross floor area per resident
for these selected new census tracts. The average gross floor area per resident is defined per
municipality. According to official statistics, the net living area per person is 39 m2 in the
City of Munich and 49 m2 in the Munich region [45]. Following this, parameters for average
gross floor area 50 m2 for the City of Munich and 60 m2 for Freising and Fürstenfeldbruck
were chosen. However, the procedure allows one to freely chose a suitable gross floor area
in the configuration. For the bottom-up estimation, the building data quality in the tracts
with new development is critical. Therefore, the table “Census Tracts New Development”ISPRS Int. J. Geo-Inf. 2021, 10, 662 11 of 21
is created. It is suggested that the building type and the number of building levels are
collected directly in OSM for buildings located in these tracts. An alternative could be to
acquire commercial building data for the selected areas. While the upcoming procedures
also work without further data collection, it is highly suggested to improve the final result.
Since only a fraction of census tracts are usually affected, the resources needed for this step
are relatively small. Once data collection is realized, the previously described steps should
be repeated. The final result of the process is visualized in Figure 11 for an exemplary
neighborhood in a new development area in Munich. The buildings visualized in the
new census tracts have four to five stories and flat roofs with no commerce on the ground
floor. This area can be classified as a typical new development area in the outer districts
of Munich.
Figure 11. New development areas and gross floor area per building entrance.
3.4. Updating of Census Tracts
In this step, the population per census tract is updated to meet the population number
of the study area as a control unit in the respective reference year (see Figure 12). Therefore,
a combination of a bottom-up and top-down approach is implemented. First, the pop-
ulation is computed using a bottom-up approach for the census tracts detected as “new
development areas”. Accordingly, for all census tracts, the intersecting building entrances
are taken, and population numbers are computed using an average gross floor area per
resident as follows:
c
P= ∑ GAi /AGR (2)
i =1
where P is the computed new population for the census tracts, c is the number of intersect-
ing building entrances, GAi is the gross floor area assigned to the entrance, and AGR is the
average gross floor area needed per resident.
Figure 12. Update census tracts.
Consequently, the population assigned by the bottom-up distribution will be corrected
using the total population of the related district of the study area as a control unit through
a top-down approach. It is checked whether the sum of the newly assigned populationISPRS Int. J. Geo-Inf. 2021, 10, 662 12 of 21
growth matches the overall growth in the related district. In case the population in the
new development areas exceeds the overall population, the newly assigned population
in the tracts is adjusted. If the distributed population is lower than the overall growth,
the remaining population is distributed proportionally according to the residential gross
floor area to all remaining census tracts. By that, densification in already built-up areas
should be modeled. As a final result, a census table with updated population numbers
is stored. The combination of bottom-up and top-down approaches ensures that the
population in the census tracts does not exceed the total population of the respective
study area.
3.5. Population Distribution
In a final step, the population from each census tract is distributed proportionally to
the residential entrances using the residential gross floor area (see Figure 13). Inaccuracies
which come with assigning default building levels per district are reduced, as due to small
grid sizes, building levels are likely homogeneous within the grid. The disaggregated
population data are saved as vector point data sets in the database.
Figure 13. Population distribution.
The data are aggregated on a hexagonal grid with an edge length of 150 m for visual-
ization purposes. The map in the Figure 14 shows the distribution of the population in the
City of Munich. Despite the overall very high density, the large green areas within the city
and main transport infrastructures are clearly visible as uninhabited. The zoomed-in map
further visualizes how the population is distributed on the building entrance level. To the
author’s knowledge, the displayed buildings have five stories and consist of ten flats per
building, of varying sizes.
Figure 14. Population distribution.ISPRS Int. J. Geo-Inf. 2021, 10, 662 13 of 21
3.6. Comparison with the Municipal Population Registry
For the comparison, the district of Lerchenfeld in Freising was selected. The reason for
this was the availability of suitable reference data. The district had, in 2020, a population of
13,135 inhabitants, and had growth of 13.8% since 2011. It is very heterogeneous in terms of
building structure and demography. It is characterized by single-family housing, detached
housing, and multi-story building of up to nine building levels. There are also major
commercial and industrial areas in the district. Urban growth has happened since 2011,
mostly in new multi-story buildings with three to four building levels. Besides greenfield
development, existing neighborhoods were densified. A particularity in the area is the
existence of two complexes for the housing of refugees, particularly with high population
density. Although the reference data can be regarded as very accurate, there are two
significant limitations. First, assigning the provided population on the address level to
a specific building was not always possible. Not all buildings had address information,
and sometimes, one population point represents several buildings. Second, the inspection
revealed implausible outliers. There were buildings with a comparatively low living area,
but many residents and non-residential buildings with residents. In the population registry,
persons can be registered at a specific address, but live at another location. Nevertheless,
the provided data are considered the most suitable one for the comparison.
The disaggregated and recorded population point data were summed up on the build-
ing level, and their relative difference is visualized in Figure 15. There could be both over-
and underestimations of population detected. Moreover, there are also neighborhoods
with an exceptionally high correlation of disaggregated and recorded data. The highest
mismatch was yielded on the building complexes for refugees. There were up to 450%
more residents registered compared to the disaggregation (see Figure 16). Another signif-
icant outlier was a nursing home for the elderly classified as a non-residential building,
due to consideration of this edge case in the dasymetric mapping not being appropriate.
While these strong outliers are few, they affect the quality of the disaggregation for the
whole district, as the missing population is assigned to other buildings, resulting in an
overestimation. This was observed mainly for single-family houses. It can also be observed
that identical buildings face a high relative mismatch of population numbers for single-
family houses. This is most likely related to differences in the household structure and
age. However, with the available data, differences in age or household size could not be
considered on the building level. Overall, an R2 of 0.82 was achieved for the disaggregation
on the building level, as shown in the Figure 17.
Further comparisons were realized on the level of the census grid (100 m × 100 m),
as shown in Figures 17 and 18. Due to the lower spatial resolution, the correlation be-
tween disaggregated and recorded populations was higher. As a result, an R2 of 0.89 was
reached. Despite the higher correlation, still, significant outliers are visible, mainly in the
previously described cases. A correlation between unmodified population numbers from
the census registered in 2011 and the recorded population in 2020 is shown in Figure 19.
Without updating the population data, a significantly lower R2 of 0.78 on the grid level
would be achieved.ISPRS Int. J. Geo-Inf. 2021, 10, 662 14 of 21
Figure 15. Comparison disaggregated and recorded population data on the building level.
Figure 16. Comparison disaggregated and recorded population data correlation examples.
(a) (b)
Figure 17. Correlation disaggregated and recorded data on (a) building-level and (b) grid-level
(100 m × 100 m).ISPRS Int. J. Geo-Inf. 2021, 10, 662 15 of 21
Figure 18. Comparison disaggregated and recorded population on grid-level.
Figure 19. Comparison census population from 2011 and recorded population 2020.
4. Discussion
The methodology was applied in three growing municipalities in southern Germany.
The results were used for accessibility analyses in planning workshops, with urban and
transport planners in the studied municipalities. A comparison with recorded population
data on the address level for a selected district in the municipality of Freising indicates a
relatively high quality of the produced data. However, it also shows that the population
is significantly over- or underestimated for selected buildings. As the total population
is used as a control unit for the district, significant deviations for selected buildings can
strongly influence the results for the remaining buildings. The comparison of data from
the census of 2011 and the recorded data from 2020 shows that the procedure updates the
data successfully, and quality is higher than without the update.
An explicit limitation of the presented approach is that the procedure expects, a priori,
that the population grows in the respective study area. It would be feasible to adjust
the scripts to model population decline. However, it has not yet been implemented.
Further testing would be needed to see if the procedure produces relevant results when
the population declines. Another methodological weakness of the presented solution is
the insufficient attention paid to new housing development in areas with a populationISPRS Int. J. Geo-Inf. 2021, 10, 662 16 of 21
in the outdated census tracts. As the population is initially assigned to census tracts that
previously had no population and only afterward is the remaining growth assigned to
all other already inhabited census tracts, the phenomena of urban densification are not
captured well enough. However, detecting new development in a separate tract without
historical building footprints is particularly challenging. The procedure assigns the same
average gross floor area for all districts within a study area with the current design. This is a
limitation as the average living area can vary significantly between different neighborhoods
and building types.
While collecting data on building levels improves the results of the procedure, it
requires additional resources. Therefore, fallback values in the configuration files can be
favorable in larger regions and regions with homogeneous buildings levels. An interesting
source for further exploration could be building heights derived through remote sensing.
Due to the absence of area-wide building heights, emphasis is placed on estimating building
heights using freely available data such as products from Sentinel and Landsat. Building
heights were estimated on a 1 km grid for Europe, the USA, and China using a random
forest model and training data sets from the different regions [46,47]. A validation showed
an R2 of 0.81 for the building height estimation [46]. On the national scale, significantly
higher resolutions of 10 m were achieved using Sentinel 1 and Sentinel 2 data. Machine
learning regression models were utilized with robust training data sets composed of almost
15 million buildings in LOD 2. A frequency-weighted RMSE of 2.9–3.5 m was achieved [48].
Despite the increasing availability of data on building footprints and land-use, this might
not be the case in every context. Accordingly, the procedure is not recommended for areas
with missing building footprints and missing land-use information. The procedure also
expects census data on a high resolution, and grid sizes of 100 m were used for the tests.
Although not tested yet, it is expected that larger grid sizes would weaken the detection of
new housing development areas, as census tracts with new development are identified by
searching tracts with no population recorded in the reference year but having residential
buildings in the target year. Moreover, the resolution of the districts of the study area
influences the results of the disaggregation. Generally, it can be assumed that a higher
resolution of the districts will improve results, and vice-versa.
The application has shown that dasymetric mapping works particularly well with
several land-use files. However, it is still challenging to properly classify buildings that
have no specific information on the use of the buildings, either from OSM or other data
sources. Especially in mixed land-use areas, it is not trivial to detect which building
contains residents or not. Furthermore, the detection of outbuildings solely by size can
be error-prone.
Dasymetric mapping could be improved by the use of remote sensing techniques
and machine learning. Lu et al. (2014) classified buildings into single-family, multi-
family, and non-residential buildings using LiDAR data. Four different machine learning
techniques were used: decision trees, aggregated decision trees, support vector machines,
and random forest. Accuracies of 60–88% were reached. The best-performing one was
supported vector machines in both urban and suburban areas. Diverse attributes falling into
categories such as building shape attributes and spatial relationships with other land-use
features were used [49]. Although the mentioned study utilizes LiDAR data, the methods
for the classification could partially be applied with the available vector data from OSM
and public sources. With the wide availability of building footprints, the dimension of
buildings could be utilized as a good proxy for building type classification. In the German
context, officially labeled data on the building type could be retrieved from cadastre for
states where the data are open access.
Moreover, street view imagery is utilized to classify building types. Using a convo-
lutional neural network on geotagged imagery from Google StreetView, buildings were
classified into diverse categories, such as industrial, office, and garages [50]. As part of
a German-wide population disaggregation, building areas were classified using random
forest on Sentinel 1 and Sentinel 2 data. The procedure reached an overall accuracy ofISPRS Int. J. Geo-Inf. 2021, 10, 662 17 of 21
81.4% [34]. These mentioned examples indicate that the use of additional data sources and
methods can improve the developed procedure.
While the presented solution produces population point data on a particularly high
resolution, it lacks further socio-demographic attributes such as age, gender, or income.
This makes it particularly unsuitable for activity-based land-use and transport models,
which usually require a synthetic population. While advanced population synthesizers ex-
ist, as reported in [51–53], the objective of this study was to develop a well-performing and
simple solution, which produces exclusively up-to-date population counts at a very high
resolution under minimal data requirements. A high-resolution population is relevant for
a wide array of use cases. In countries such as Germany, population registries exist, which
provide an up-to-date picture of population data on the address level. However, these
data are usually sensitive and not shared with upper administrative bodies, researchers,
or private businesses at a high resolution. Therefore, the developed procedure could be
of special value for official statistics at the higher administrative levels or public service
providers in the studied context. Meanwhile, in contexts where citizens are not forced to
report on their home location, the procedure can also be relevant for municipalities by
providing a granular disaggregation of the population.
5. Conclusions
The new population disaggregation approach demonstrates that population numbers
can be disaggregated on the building level based on outdated census data. Unlike other
existing solutions, the procedure works without ubiquitous 3D building data. It suggests
the collection of building levels in OSM for new residential areas, or suggests the definition
of average building levels per administrative district. Furthermore, diverse but easily
available data sets are fused and utilized. This significantly reduces the data requirements
and makes it possible to utilize the census tracts’ spatially detailed but outdated population
information. It can adjust to local requirements through configuration files and fuses
data from varying sources to remain useful in varying contexts. Different configurations
should be tested in the future and best practices documented for different contexts. As the
procedure was integrated into the setup of the software GOAT, it can be executed in a
highly automated fashion and can be directly used in the application. However, it is also
possible to use the scripts independent of the GOAT application. Overall, the develop-
ment is a pragmatic contribution to the existing landscape of population disaggregation.
The solution is advantageous if an inexpensive approach is favored and good open data
are available, but no 3D building information exists. This study was mainly intended to
prepare population data for accessibility analysis on the neighborhood level. Meanwhile, it
could be useful for other applications.
So far, the scripts have been primarily tested in the studied municipalities. However,
further testing will be conducted. Large-scale tests in Germany are currently prepared,
and tests in regions worldwide are envisaged. To date, the results have been verified
by comparing them with recorded population data from one district. As described in
Section 3.6, it could be feasible to reach higher correlations with data from population
registries in other areas with less dynamic growth and fewer outliers. Further strategies
need to be developed to detect and handle outliers. Due to the unavailability of data, no
large-scale comparison can be realized yet. Whenever possible, this should be done in
the future. Furthermore, data verification using data produced by other disaggregation
algorithms or newly published census data are being sought. To improve the detection of
new development areas, historical data on building footprints should be examined further.
A potential source could be the OSM database, as timestamps exist for each feature created
or modified. In addition, remote sensing techniques on satellite imagery could be tested to
detect areas with changes in the built environment. This improvement could particularly
help in identifying urban densification. As described in Section 4, the dasymetric mapping
could benefit from remote sensing and machine learning. Promising is, in particular,
the extension of the current binary building classification towards multiple classes, suchISPRS Int. J. Geo-Inf. 2021, 10, 662 18 of 21
as single-family housing, multi-family housing, mixed-use and non-residential. Further
experimentation with deriving building type and gross floor area for residential purposes
with the help of points of interest is targeted.
Overall, it is seen that this work adds especially the following contributions:
• A standardized and adaptable yet pragmatic solution was developed to disag-
gregate the population on the building access level.
• Compared to many other solutions, no ubiquitous 3D building data or LiDAR
data are necessary.
• An outdated census grid is updated to the target year, and therefore the spatially
detailed but outdated census data are set in value.
Among others, the following are seen as the most important limitations:
• Dasymetric mapping is solely based on a boolean classification; accordingly,
different residential buildings are not differentiated.
• A spatially detailed census grid, up-to-date population data on the district level,
building footprints are necessary to obtain appropriate results.
• It is suggested to collect buildings level in new development areas, which means
additional effort and limits scaling.
• More validation of the produced results is necessary to judge the accuracy finally.
Besides the aforementioned technical optimization, one might ask if it is sufficient to
include only the static population. There are high temporal variations in the distribution
of the population within a city region; most notably, the variations between day and
night. Moreover, many applications such as accessibility instruments would benefit from
showing the variations of population. Recent research [54,55] underscores the potential and
feasibility of disaggregation procedures, which incorporate the tempo-spatial dynamics of
the population in cities and regions. To specifically enrich accessibility instruments with
temporal dynamic population data, further research and development are envisaged.
Author Contributions: Conceptualization, Elias Pajares and Rafael Muñoz Nieto; Data curation,
Elias Pajares; Funding acquisition, Elias Pajares and Gebhard Wulfhorst; Investigation,Elias Pajares,
Rafael Muñoz Nieto and Liqiu Meng; Methodology, Elias Pajares and Rafael Muñoz Nieto; Project
administration, Elias Pajares; Resources, Gebhard Wulfhorst; Software, Elias Pajares; Supervision,
Liqiu Meng and Gebhard Wulfhorst; Visualization, Elias Pajares; Writing—original draft,Elias Pajares
and Rafael Muñoz Nieto; Writing—review & editing, Elias Pajares, Liqiu Meng and Rafael Muñoz
Nieto. All authors have read and agreed to the published version of the manuscript.
Funding: This research has been developed in the funded research project GOAT under the mFUND
program. mFUND is an initiative from the Federal Ministry of Transport and Digital Infrastructure
of Germany (BMVI) that supports research and innovation projects related to digital data-based
innovation in the field of mobility.
Institutional Review Board Statement: Not applicable.
Informed Consent Statement: Not applicable.
Data Availability Statement: The data used and its sources are listed in the methodology section
of the manuscript. Most of it is openly available. The produced data sets are not published due to
conflicts concerning the terms of use of selected data sets. However, the source code of the developed
procedure is available open-source and can be used to reproduce the results.
Acknowledgments: The authors are very thankful for the support of the municipalities of Munich,
Freising, and Fürstenfeldbruck for testing GOAT with the produced population data sets and their
feedback on improving the data quality and analysis. A special thank you goes to Joelean Hall for
proofreading this manuscript. Furthermore, the authors are very thankful to the reviewers who
helped with their comments to improve this paper significantly.
Conflicts of Interest: The authors declare no conflict of interest.ISPRS Int. J. Geo-Inf. 2021, 10, 662 19 of 21
Abbreviations
The following abbreviations are used in this manuscript:
ALKIS Amtliches Liegenschaftskatasterinformationssystem
ATKIS Amtliches Topographisch-Kartographisches Informationssystem
GOAT Geo Open Accessibility Tool
LOD Level of Detail
OSM OpenStreetMap
PL/pgSQL Procedural Language/PostgreSQL
SQL Structured Query Language
WebGIS Web geographic information system
Appendix A
Table A1. Table Schema Mapping in SQL.
Table Names Figures Table Names SQL
Buildings Custom buildings_custom
Buildings OSM buildings_osm
Census Tracts census
Census Tracts New Development census_split_new_development
Fixed Population fixed_population
Land-use Custom 1 landuse
Land-use Custom 2 landuse_additional
Land-use OSM landuse_osm
Population population
Residential Entrances residential_addresses
Study Area study_area
Updated Census Tracts census_prepared
References
1. Wang, L.; Wu, C. Population estimation using remote sensing and GIS technologies. Int. J. Remote Sens. 2010, 31, 5569–5570.
[CrossRef]
2. Qiu, Y.; Zhao, X.; Fan, D.; Li, S. Geospatial Disaggregation of Population Data in Supporting SDG Assessments: A Case Study
from Deqing County, China. ISPRS Int. J. Geo-Inf. 2019, 8, 356.
3. Hofstee, P.; Islam, M.; Disaggregation of Census Districts: Better Population Information for Urban Risk Management. In
Proceedings of the 25th Asian Conference on Remote Sensing, ACRS 2004, Chiang Mai, Thailand, 22–26 November 2004; p. 6.
4. Nadim, F.; Kjekstad, O.; Peduzzi, P.; Herold, C.; Jaedicke, C. Global landslide and avalanche hotspots. Landslides 2006, 3, 159–173.
[CrossRef]
5. Garb, J.L.; Cromley, R.G.; Wait, R.B. Estimating Populations at Risk for Disaster Preparedness and Response. J. Homel. Secur.
Emerg. Manag. 2007, 4. [CrossRef]
6. Monteiro, J.; Martins, B.; Pires, J.M. A hybrid approach for the spatial disaggregation of socio-economic indicators. Int. J. Data Sci.
Anal. 2018, 5, 189–211. [CrossRef]
7. Wu, S.S.; Wang, L.; Qiu, X. Incorporating GIS Building Data and Census Housing Statistics for Sub-Block-Level Population
Estimation. Prof. Geogr. 2008, 60, 121–135. [CrossRef]
8. Pajares, E.; Büttner, B.; Jehle, U.; Nichols, A.; Wulfhorst, G. Accessibility by proximity: Addressing the lack of interactive
accessibility instruments for active mobility. J. Transp. Geogr. 2021, 93, 103080. [CrossRef]
9. Jain, D.; Tiwari, G. Population disaggregation to capture short trips—Vishakhapatnam, India. Comput. Environ. Urban Syst. 2017,
62, 7–18. [CrossRef]
10. Moeckel, R.; Spiekermann, K.; Wegener, M. Creating a Synthetic Population. In Proceedings of the 8th International Conference
on Computers in Urban Planning and Urban Management (CUPUM), Sendai, Japan, 27–29 May 2003; p. 18.
11. Šimbera, J. Neighborhood features in geospatial machine learning: The case of population disaggregation. Cartogr. Geogr. Inf. Sci.
2020, 47, 79–94. [CrossRef]
12. Huang, Z.; Ottens, H.; Masser, I. A Doubly Weighted Approach to Urban Data Disaggregation in GIS: A Case Study of Wuhan,
China. Trans. GIS 2007, 11, 197–211. [CrossRef]
13. Mennis, J. Dasymetric Mapping for Estimating Population in Small Areas. Geogr. Compass 2009, 3, 727–745. [CrossRef]
14. Mennis, J. Generating Surface Models of Population Using Dasymetric Mapping. Prof. Geogr. 2003, 55, 31–42. [CrossRef]
15. Forster, B.C. An examination of some problems and solutions in monitoring urban areas from satellite platforms. Int. J. Remote
Sens. 1985, 6, 139–151. [CrossRef]ISPRS Int. J. Geo-Inf. 2021, 10, 662 20 of 21
16. Bracken, I.; Martin, D. The Generation of Spatial Population Distributions from Census Centroid Data. Environ. Plan. A Econ.
Space 1989, 21, 537–543. [CrossRef] [PubMed]
17. Openshaw, S. The modifiable areal unit problem. In Quantitative Geography: A British View; Routledge and Kegan Paul: Andover,
MA, USA, 1981; pp. 60–69.
18. Statistische Ämter des Bundes und der Länder. ZENSUS2011—Bevölkerungs- und Wohnungszählung 2011—Ergebnisse
des Zensus 2011 zum Download—Erweitert. Available online: https://www.zensus2011.de/DE/Home/Aktuelles/
DemografischeGrunddaten.html?nn=3065474 (accessed on 23 February 2021).
19. Bayerisches Landesamt für Statistik. Statistische Berichte—Einwohnerzahlen am 31. Dezember 2011; Technical Report; Bayerisches
Landesamt für Statistik, Fürth, Germany, 2015.
20. Bayerisches Landesamt für Statistik. Statistische Berichte—Einwohnerzahlen am 31. Dezember 2020; Technical Report; Bayerisches
Landesamt für Statistik, Fürth, Germany, 2021.
21. Goodchild, M.; Lam, N.S.N. Areal interpolation: A variant of the traditional spatial problem. Geo-Process. 1980, 1, 29–312.
22. Wu, S.S.; Qiu, X.; Wang, L. Population Estimation Methods in GIS and Remote Sensing: A Review. GISci. Remote Sens. 2005,
42, 80–96. [CrossRef]
23. Akiyama, Y.; Takada, H.; Shibasaki, R. Development of Micropopulation Census through Disaggregation of National Population
Census. In Proceedings of the The 13th International Conference on Computers in Urban Planning and Urban Management,
Utrecht, The Netherlands, 2–5 July 2013; p. 31.
24. Beckman, R.J.; Baggerly, K.A.; McKay, M.D. Creating synthetic baseline populations. Transp. Res. Part A Policy Pract. 1996,
30, 415–429. [CrossRef]
25. Wright, J.K. A Method of Mapping Densities of Population: With Cape Cod as an Example. Geogr. Rev. 1936, 26, 103–110.
[CrossRef]
26. Silva, F.B.e.; Gallego, J.; Lavalle, C. A high-resolution population grid map for Europe. J. Maps 2013, 9, 16–28. [CrossRef]
27. Eicher, C.L.; Brewer, C.A. Dasymetric Mapping and Areal Interpolation: Implementation and Evaluation. Cartogr. Geogr. Inf. Sci.
2001, 28, 125–138. [CrossRef]
28. Bracken, I. A Surface Model Approach to Small Area Population Estimation. Town Plan. Rev. 1991, 62, 225–237. [CrossRef]
29. Langford, M.; Unwin, D.; Maguire, D. Generating Improved Population Density Maps in an Integrated GIS. In Proceedings of the
EGIS ’90 First European Conference on Geographical Information Systems, Amsterdam, The Netherlands, 10–13 April 1990.
30. Monteiro, J.; Martins, B.; Murrieta-Flores, P.; Pires, J.M. Spatial Disaggregation of Historical Census Data Leveraging Multiple
Sources of Ancillary Information. ISPRS Int. J. Geo-Inf. 2019, 8, 327. [CrossRef]
31. Chen, H.; Wu, B.; Yu, B.; Chen, Z.; Wu, Q.; Lian, T.; Wang, C.; Li, Q.; Wu, J. A New Method for Building-Level Population
Estimation by Integrating LiDAR, Nighttime Light, and POI Data. J. Remote Sens. 2021, 2021. [CrossRef]
32. Xie, Y.; Weng, A.; Weng, Q. Population Estimation of Urban Residential Communities Using Remotely Sensed Morphologic Data.
IEEE Geosci. Remote Sens. Lett. 2015, 12, 1111–1115. [CrossRef]
33. Bast, H.; Storandt, S.; Weidner, S. Fine-grained population estimation. In Proceedings of the 23rd SIGSPATIAL International
Conference on Advances in Geographic Information Systems, SIGSPATIAL ’15, Seattle, WA, USA, 3–6 November 2015; Association
for Computing Machinery: New York, NY, USA, 2015; pp. 1–10. [CrossRef]
34. Schug, F.; Frantz, D.; Linden, S.v.d.; Hostert, P. Gridded population mapping for Germany based on building density, height
and type from Earth Observation data using census disaggregation and bottom-up estimates. PLoS ONE 2021, 16, e0249044.
[CrossRef] [PubMed]
35. University of Rostock. Availability of Official Geodata | OpenGeoEdu. Available online: https://learn.opengeoedu.de/en/
opendata/vorlesung/offene-geodaten/amtliche-geodaten (accessed on 15 July 2021).
36. GOAT-Community. GOAT Population Source Code. Available online: https://github.com/goat-community/goat/tree/
hackathon/app/database/data_preparation/SQL/population (accessed on 4 July 2021).
37. Statistische Ämter des Bundes und der Länder. Gemeindeverzeichnis | Statistikportal.de. Available online: http://www.
statistikportal.de/de/gemeindeverzeichnis (accessed on 3 July 2021).
38. European Union, Copernicus Land Monitoring Service; European Environment Agency (EEA). Urban Atlas 2018—Copernicus
Land Monitoring Service. Available online: https://land.copernicus.eu/local/urban-atlas/urban-atlas-2018 (accessed on 23
June 2021).
39. Geofabrik GmbH Karlsruhe. GeoFabrik. Available online: http://www.geofabrik.de/ (accessed on 23 June 2021).
40. Landesamt für Digitalisierung Breitband und Vermessung. Bayerische Vermessungsverwaltung—Produkte—ATKIS Basis-DLM.
Available online: https://www.ldbv.bayern.de/produkte/atkis-basis-dlm.html (accessed on 26 June 2021).
41. Landesamt für Digitalisierung Breitband und Vermessung. Bayerische Vermessungsverwaltung—Produkte—ALKIS/
Katasterauszüge—Hausumringe. Available online: https://www.ldbv.bayern.de/produkte/kataster/hausumringe.html
(accessed on 26 June 2021).
42. GOAT-Community. GOAT Repository. Available online: https://github.com/goat-community/goat (accessed on 4 July 2021).
43. Plan4Better GmbH. Technical Architecture GOAT. Available online: https://plan4better.de/docs/technicalarchitecture/
(accessed on 2 July 2021).
44. GOAT-Community. Data Preparation. Available online: https://www.open-accessibility.org/docs/data_preparation/ (accessed
on 25 August 2021).You can also read