Hotel Sustainability Benchmarking Index 2021: Carbon, Energy, and Water
←
→
Page content transcription
If your browser does not render page correctly, please read the page content below

CORNELL CENTER FOR HOSPITALITY RESEARCH
CORNELL HOSPITALITY INDICES

 Hotel Sustainability
 Benchmarking Index 2021:
 Carbon, Energy, and Water
  By Eric Ricaurte & Rehmaashini Jagarajan

T
 EXECUTIVE SUMMARY

               he annual Cornell Hotel Sustainability Benchmarking study, published for the
               eighth consecutive year, finds a general reduction in energy and water usage
               among the participating hotels over the past three years (2017 -2019). However, a
               slight increase in usage is reported among full-service resorts, a new grouping
established for this year’s reporting. A total of 21,432 hotels from 26 international hotel chains
participated by contributing information regarding their energy and water usage. Over 60% of
the total data comes from hotels in the United States. While the data permit hoteliers and
potential guests to see benchmarks for various hotel segments and locations, individual hotel
amenities are not accounted for in terms of energy or water usage. The authors encourage
additional hotels and hotel companies to participate in the study, as increased participation
allows us to build a stronger and more meaningful data set of the industry for benchmarking
and to drive improvements in energy, water, and carbon performance.

   1                                                 The Center for Hospitality Research • Cornell University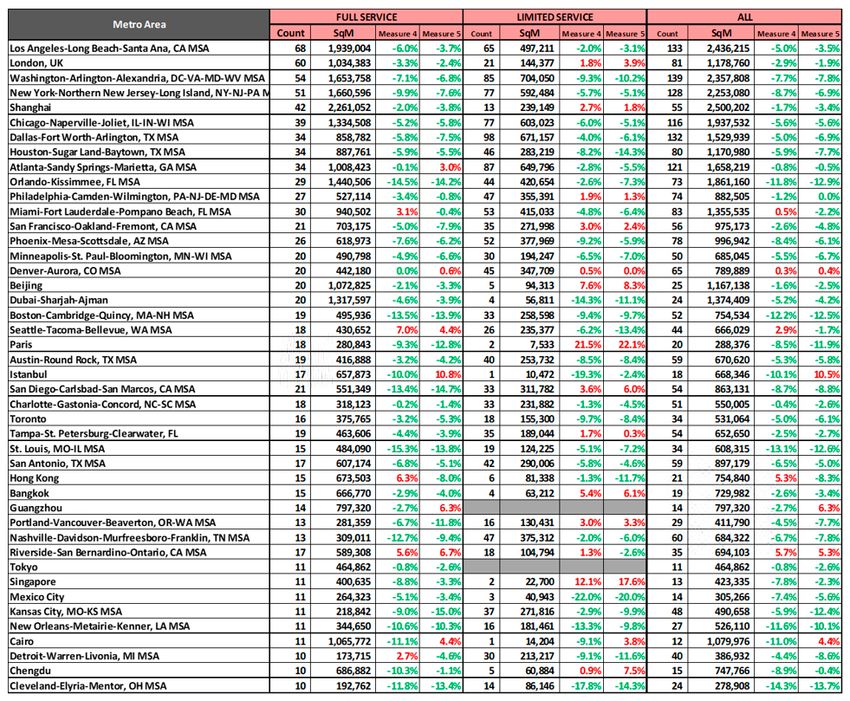
ABOUT THE AUTHORS
                                            Eric Ricaurte founded Greenview as a boutique firm specializing in the metrics, measurement, and reporting of
                                           carbon and other sustainability performance indicators within travel & tourism. He is a frequent speaker, organizer,
                                            researcher, and generally ubiquitous character in the topic of sustainability measurement.
                                            Eric began his career canoeing people through the jungle. He spent 10 years working in ecotourism across Costa
                                            Rica, Mexico and Brazil in operations and as a consultant. He started out managing eco lodges and nature park
                                           operations, and then naïvely decided to go on his own as an independent consultant. Eric built his client list to include
                                            hotels, parks, nature & cultural tour operators, receptive tour companies, and eventually destinations. During this
                                            time, he went 6 years straight without wearing a tie and his entrepreneurial ventures included co-owning a failed
                                           speedboat & outrigger canoeing tour business in Bahia, Brazil.

                                           Throughout these formative years Eric spent plenty of time in forests and parks, and became fascinated with the
concept of carbon sequestration for value it placed on nature and the opportunities it provided for conservation as well as tourism. He started researching the
topic in 2001 and won a student research award at Cornell University for his paper titled “Carbon Offsetting, Trading, and Sequestration and their Relation to
Travel & Tourism.” Fast forward 10 years later, as a research fellow at Cornell, Eric authored the study “Developing a Sustainability Measurement Framework
for Hotels: Toward an Industry-wide Reporting Structure” and was selected as the technical consultant to facilitate the development of the methodology for the
Hotel Carbon Measurement Initiative.

Throughout his career Eric has consulted globally for hotel properties; hotel companies; REITs; hospitality vendors; tourism operators, attractions and complexes;
cruise lines; the UNWTO, WTTC, and AHLA; event organizers; and tourism destination organizations. Eric earned a Bachelor of Science degree from the
Cornell University School of Hotel Administration and a Master of Science degree in Tourism & Travel Management from New York University.

Eric is a member of the UFI Committee on Sustainable Development, the International Standards Working Group of the GSTC, and on the judging panel of the
HICAP Sustainable Hotel Awards. He has held a research fellowship at the Cornell University Center for Hospitality Research and been an adjunct instructor at
the NYU University Tisch Center for Hospitality and Tourism. Eric is an active board member of the Orphaned Starfish Foundation. In his spare time, Eric still
hangs out in forests and has enjoyed playing Capoeira for over 12 years.

Rehmaashini Jagarajan, Ph.D., is a Sustainability Manager at Greenview. She manages the on-going development
of the company’s in-house data analytics and software products and their use with clients. Rehma also sets up and
manages company’s related processes and data flows, as well as team’s collaboration and productivity.

Prior to Greenview, she has served as a Property Researcher at Raine & Horne International (Malaysia) specializing
in market research and feasibility studies. She has experience conducting and preparing market research for the
purpose of determining the highest and best use of land, ascertaining appropriate development proposals, and
preparing feasibility studies relating to new development projects, subdivisions and renovation and refurbishment to
existing buildings. She has also served as a valuation executive at JS Valuers Property Consultants Group Malaysia
providing valuation services covering extensive range of properties for various different purposes. Rehma is a
member of Malaysian Association of Facility Management (MAFM), a medium for the local Facility Management (FM)
communities to interact and share knowledge or experience through activities co-organized with various parties both in public and private sectors. Rehma holds
a Doctorate Degree (PhD) in Facilities Management as well as a Bachelor’s Degree in Property Management from the University of Technology Malaysia.

     2                                                                                   The Center for Hospitality Research • Cornell University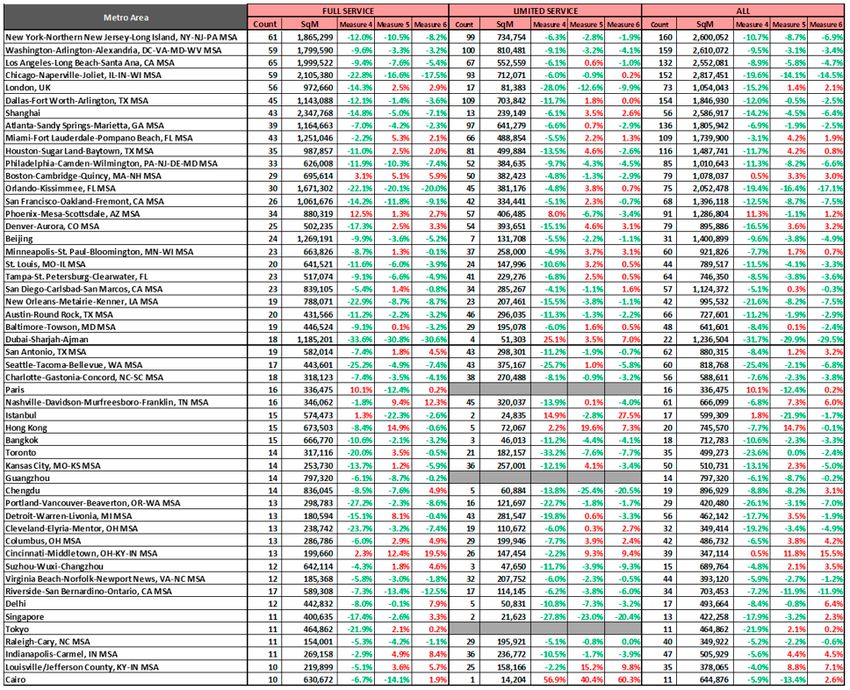
CORNELL CENTER FOR HOSPITALITY RESEARCH
CORNELL HOSPITALITY INDICES

 Hotel Sustainability
 Benchmarking Index 2021:
 Carbon, Energy, and Water
  By Eric Ricaurte & Rehmaashini Jagarajan

T
            he eighth annual report of the Cornell Hotel Sustainability Benchmarking (CHSB)
            2021 study presents the results of the analysis of 2019 calendar-year data. It is
            undertaken as a collaborative effort of Cornell University’s Center for Hospitality
            Research (CHR), hotel participants, Greenview, and an industry advisory group. This
year’s report, with three years of historical trends and year-over-year change, accompanied by
its index, is the largest and latest data set for benchmarking the industry’s energy and water
usage and greenhouse gas (GHG) emissions. The data set is freely available for download from
the CHR. This study continues to build upon last year’s framework, expand the data set’s
geographical coverage, and present historical trends across like-for-like change over the past
year, as well as three years of similar data. This year’s report saw an 8-percent increase in the
global data set, comprising 15,339 hotels worldwide. As a result of the global pandemic’s impact
on 2020 calendar-year data, data collection will not be undertaken for CHSB2022. However,
collection of 2021 calendar year data for CHSB2023 will commence in early 2022.

   3                                                 The Center for Hospitality Research • Cornell University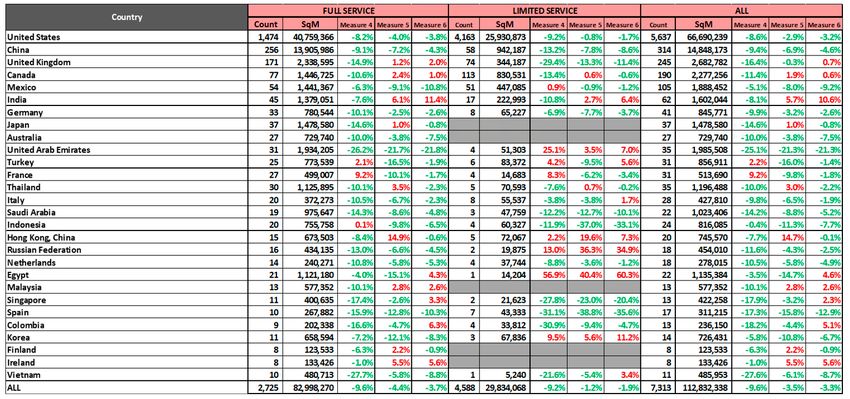
OVERVIEW                                                                based on energy and water usage per month,
    This study is presented as an index for the follow-                 for the number of months corresponding to
                                                                        each season
ing purposes:
 •       To provide credible benchmarks according             •         Reconfigured the emission factor for Pur-
         to industry-specific segmentation and met-                     chased Chilled Water in the public data set
         rics globally;                                                 and confidential hotel report for countries
                                                                        other than the United States and Canada.
 •       To provide industry data analysis with a                       The prior CHSB outputs used an emission
         confidential data set; and                                     factor of Purchased Chilled Water calcu-
                                                                        lated by multiplying the emission factor of
 •       To advance toward commonly defined,                            Purchased Electricity by a coefficient, and in
         transparent, and rigorous methods for mod-                     some prior years applied a COP to the en-
         eling energy, water, and carbon based on                       ergy values to arrive at kWh first. The up-
         hotel-specific attributes and data that are ap-                date corrects the emission factor calculation
         plicable and current.                                          which per US EIA Form 1605 Appendix N
                                                                        is expressed the coefficient in a unit of kg-
     This index presents benchmark ranges for twelve                    CO2e/ton-hour, converting to kWh, to ar-
different measures relating to energy, water, and car-                  rive at the coefficient in a unit of kgCO2e/
bon emissions, in 583 geographies, which are defined                    kWh. As a result, for the 499 hotels outside
by metro area, country, climate zone, and other geo-                    of the United States and Canada in the data
graphic or political regions. Data are segmented by var-                set with purchased chilled water figures and
                                                                        affected by this change, resulting emissions
ious hotel types, including asset class, location, type of
                                                                        will be lower than the prior year and any
hotel, and market segment, and denoted by stars.                        corresponding benchmarks in the tool will
                                                                        also be lowered.
CHSB2021 UPDATES
    This year’s process and resulting index has incor-        •         Increased number of geographies from 574
porated the following updates:                                          to 583 across metro areas, regions, countries
                                                                        and climate zones
 •       Increased granularity of segmentation in va-
         lidity testing for energy and water by adding        •         Increased number of hotels for which bench-
         additional fences for resort and integrated                    marks have been outputted to 15,339 (in-
         resort types                                                   crease of 7.9%)

 •       Increased granularity of segmentation in va-         •         Increased number of hotels participating to
         lidity testing for energy and water by add-                    21,432 (increase of 18.8%).
         ing additional fences for China and United
         States hotels

 •       Addition of the hotel type “Extended Stay”          USES OF THE CHSB INDEX
         to encompass hotels that offer self-catering             The CHSB Index and output data set are provided
         suites and long-term accommodation for              to serve multiple purposes, benefiting both the partici-
         guests                                              pants and the industry, as follows:

 •       Separation of upper upscale and upscale             Participant Benefits1
         into two different segments                           1.       Supporting portfolio data collection efforts.
                                                                        Entities with large hotel portfolios may em-
 •       Enhanced segmentation by full-service asset                    ploy the study to encourage properties to
         class into full-service resort and full-service                submit valid data in a timely manner to im-
         non resort                                                     prove corporate reporting.

 •       Segmented validity testing to cater to sea-                1   Participation is open and welcome for CHSB 2023, call-
         sonal resorts (i.e. winter/summer) that do
                                                             ing for 2021 data set. For further information, please email Eric
         not operate for all 12 months to normalize,         Ricaurte.

     4                                                            The Center for Hospitality Research • Cornell University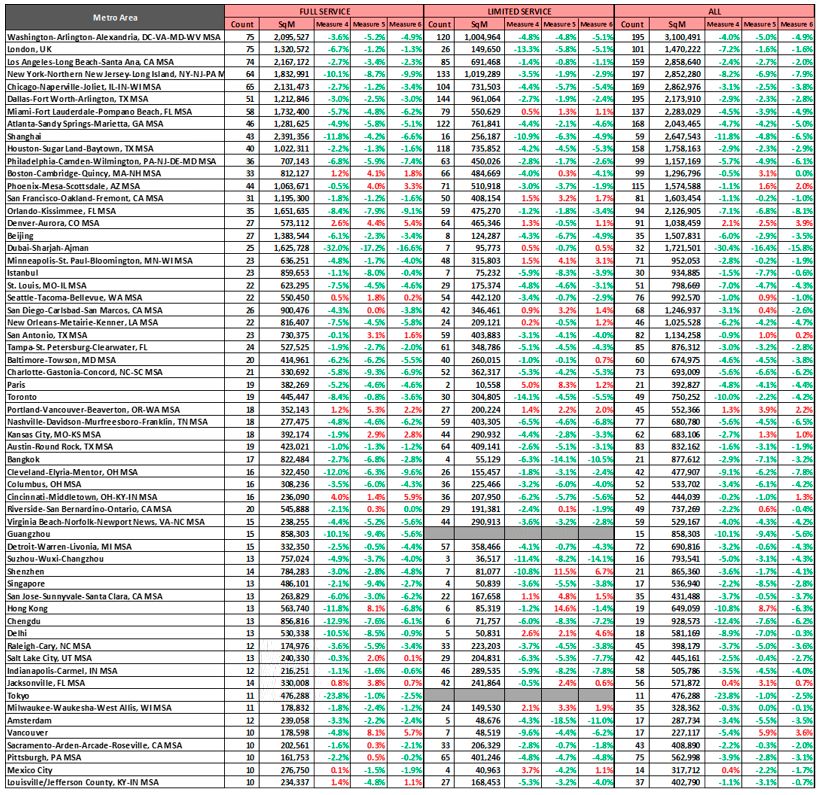
2.       Enabling internal benchmarking. Hotel            5.   Facilitating carbon footprint calculations.
           properties and companies wishing to com-              Travelers, event organizers, and other travel
           pare performance against a general competi-           buyers or intermediaries seeking to calculate
           tive set across peers may use the benchmarks          the carbon footprint of their own hotel stays
           against their own performance.                        may make a credible calculation using the
                                                                 CHSB results. Carbon offset programs can
  3.       Expediting validity testing. Validity tests           use CHSB figures to develop credible and
           are performed on the data set submitted,              transparent estimates of carbon footprint
           which the participating companies can use             values to establish standardized offset levels.
           to identify and address data-integrity issues         This will expedite the calculation, thereby
           to improve their own reporting.                       saving group customers and hoteliers time
                                                                 in transmitting property-specific data for a
 4.        Advancing internal modeling. Hotel com-               destination or global footprint.
           panies with internal benchmarking systems
           may take lessons learned, correlations, and      6.   Supporting municipal codes and regula-
           regression studies into consideration for im-         tions. Entities that wish to mandate perfor-
           proving their own internal regression mod-            mance specifications of energy, water, or
           eling.                                                GHG emissions in municipalities or regions
                                                                 will have more representative and accurate
Industry Benefits                                                data from which to base their codes or regu-
                                                                 lations.
 1.        Default data. By aggregating data globally
           that is also segmented by geographic loca-       7.   Industry trends and carbon balance. Gener-
           tion and market segment, CHSB provides a              al knowledge of hotel environmental perfor-
           publicly available, industry-based data set.          mance and industry trends can be explored
           Furthermore, in countries without any for-            in each year’s industry report. With an es-
           malized benchmarking process, this data set           tablished data set, overall performance on
           fills the gap.                                        an industry level can be analyzed and com-
                                                                 municated. With the Paris Climate Agree-
  2.       Feasibility study support. Entities perform-          ment signed in 2016, an increasing emphasis
           ing feasibility studies for hotel development,        is now placed on decarbonization aligned
           renovation, and acquisition can utilize the           with climate science, akin to a balance sheet,
           tool’s market- and location-based ranges              including “Science-based Targets.” The data
           and benchmarks to support the forecasting             set can serve as a basis for calculating the
           of energy and water usage and, in some cas-           industry-wide carbon footprint and trends
           es, carbon taxes.                                     over time along a path toward decarboniza-
                                                                 tion by 2050, while also providing insight on
  3.       Improving rating systems. Entities that rank          performance year-over-year.
           or score hotels based on environmental per-
           formance can incorporate benchmarks from         8.   Eventual normalization and use indexing.
           the tool and quantification methods to tailor         Each study adds data to the index, and a sig-
           their own methodology.                                nificant data set with property attributes will
                                                                 support further evaluation of the drivers of
 4.        Harmonized greenhouse gas emissions cal-              energy, water, and carbon emissions in hotel
           culations. The protocols for greenhouse gas           operations over time.
           emissions accounting and verification do
           not provide standardized greenhouse gas          9.   Calculating portfolio footprints. Participat-
           emission factors for converting energy into           ing companies that do not currently calculate
           carbon metrics. Different entities may select         carbon emissions or aggregate their energy
           different factors which can invalidate the            footprint will receive the energy and carbon
           comparability across properties and compa-            footprint of their portfolios in the individual
           nies. In receiving energy data and applying           reports, uniformly calculated across the en-
           a uniform set of greenhouse gas emission              tire data set in a cost-effective platform.
           factors, the index provides a single, harmo-
           nized carbon data set enabling comparabil-
           ity.

       5                                                     The Center for Hospitality Research • Cornell University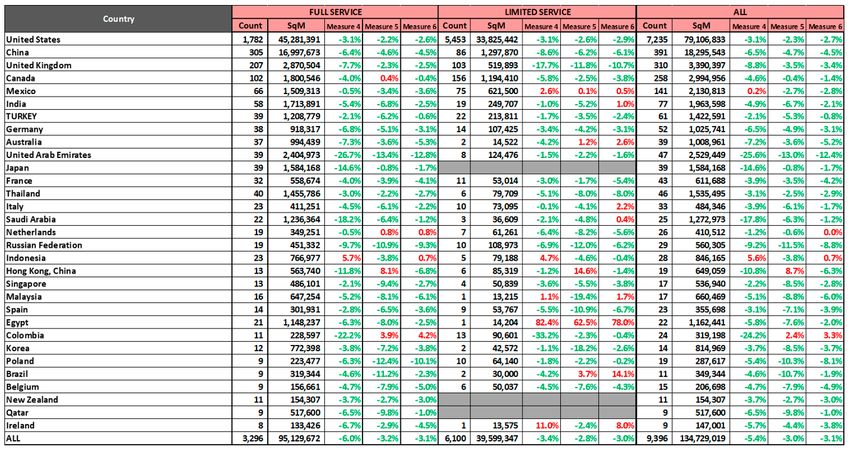
•      water in Liters (L),
 Exhibit 1
 Participating organizations                                           •      floor area in square meters (m2), and
 AINA Hospitality                    MGM Resorts International
 Centara Hotels & Resorts            Park Hotel Group                  •      greenhouse gas (GHG) emissions (also
 Chatham Lodging Trust               Park Hotels & Resorts                    termed carbon footprint) in kilograms
                                                                              of carbon dioxide equivalent (kgCO2e),
 CPG Hospitality                     Pebblebrook Hotel Trust
                                                                              converting each energy source of GHG
 DiamondRock Hospitality Company     Playa Hotels & Resorts
                                                                              emissions into kgCO2e (using only carbon
 EVENT Hospitality & Entertainment   Pro-invest Group                         dioxide, methane, and nitrous oxide).
 Hilton Worldwide                    Radisson Hotel Group
                                                                           The set of emission factors applied to each respec-
 Hong Kong & Shanghai Hotels         RLJ Lodging Trust
                                                                      tive energy type was geographically based on available
 Horwath HTL Asia Pacific            Ryman Hospitality Properties
                                                                      data (see Appendix 10 for emission factors referenced).
 Hyatt Hotels Corporation            Six Senses Hotels Resorts Spas
                                                                      When the emission factor was provided by the refer-
 InterContinental Hotels Group       Sudima Hotels
                                                                      ence source in CO2e, the source document’s value of
 Mandarin Oriental Hotel Group       Wyndham Hotels & Resorts
                                                                      global warming potential (GWP) was used. With raw
 Marriott International              Xenia Hotels & Resorts
                                                                      values of methane (CH4) and nitrous oxide (N2O)
                                                                      emissions, the following GWP was applied using the
                                                                      IPCC Fifth Assessment Report, 100 Year horizon: GWP
DATA SETS                                                             of CH4: 28; and GWP of N2O: 265. For energy gener-
                                                                      ated from renewable sources (wood or other biomass)
Input
                                                                      the biogenic CO2 was not included. However, per the
    We collected aggregated 2019 calendar-year data                   Greenhouse Gas Protocol, emissions from CH4 and
from the participating companies listed in Exhibit 1 (the             N2O were included. For other renewable sources such
most recent complete year of data). In total, the partici-            as solar, wind, geothermal, or deep-water cooling, an
pants provided data for 21,432 properties globally. As                emission factor of zero was assigned to the energy type.
part of this process, 2019 calendar-year data collected
by Horwath HTL Asia Pacific, and then, analyzed with
                                                                      2. Validity Testing
similar validity testing by Greenview, was incorporated
                                                                      Second, we performed validity tests to identify outli-
into the data set to add an additional 1,945 non-dupli-
                                                                      ers or data which may have been incorrectly submit-
cated property records. We used the data points shown
                                                                      ted. Participants received an initial output with validi-
in Exhibit 2 to generate the measures within the index.
                                                                      ty test results and were given the option to correct and
We did not, however, cross-check utility invoices nor
                                                                      update data or to override validity flags by confirming
verify the data, although most of the data set was veri-
                                                                      that the data were correct (e.g., a utility that invoices
fied by a third-party reviewer for participant corporate
                                                                      and provides data on a bimonthly basis)
reporting of GHG inventories. Other than ascertaining
                                                                           We repeated the tests with updated data, setting
the presence of onsite laundry for main linen wash for
                                                                      the thresholds to the highest or lowest values that had
Measures 1, 7, 10 and 11, no data related to additional
                                                                      been re-confirmed by participants. Exhibit 3 lists the
hotel amenities were collected.
                                                                      general cut-off values for upper and lower outliers in
Output                                                                the data set. Please refer to Appendix 1 for detailed list
    We took the following five steps to arrive at the out-            of validity tests performed and the thresholds for each
put tables for the CHSB2021 index.                                    test. When a property did not pass a specific validity
                                                                      test, we removed it from the data set for each corre-
1. Harmonization                                                      sponding measure. Exhibit 4 has the count of the data
First, all data were harmonized into the following                    set included for each measure. While it is possible for
common units of measurement:                                          a property to exceed the threshold due to expansive
                                                                      public areas or amenities, we implemented these limi-
 •       energy in kilowatt-hours (kWh),                              tations to maintain a representative data set.

     6                                                                     The Center for Hospitality Research • Cornell University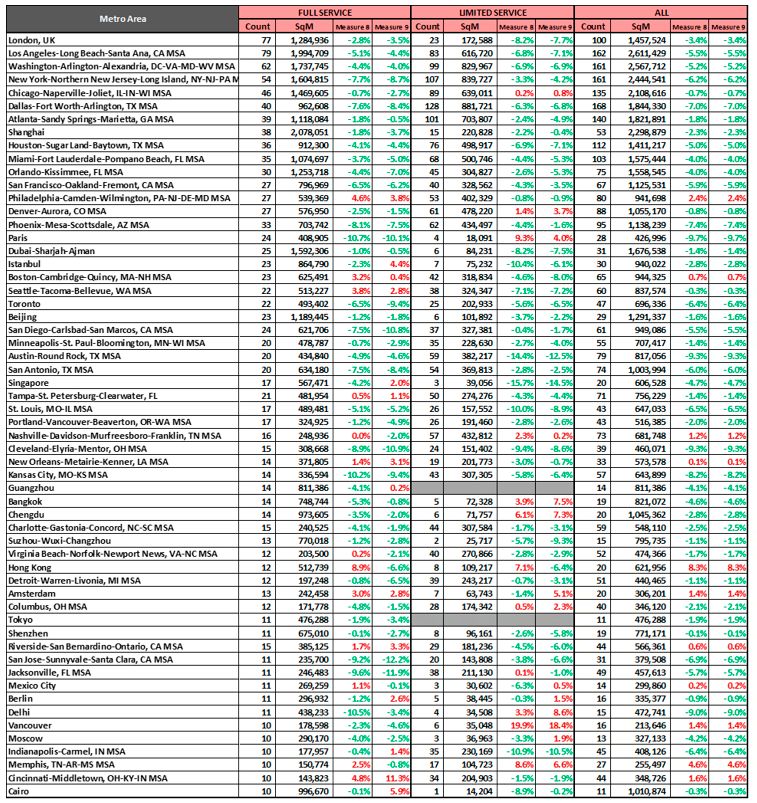
exhibit 2
Data collection points used to generate the external CHSB2021 benchmarks

 Data Point                   Description
 Internal Brand Code          Unique identifier code used by the property’s parent brand.
 Participant Code             Unique identifier code used by the participating entity, if different from the brand code. For example, an owner of a franchisee of a portfolio of hotels may use separate
                              identifiers, to avoid duplication of properties within the data set.
 Hotel Name                   Name of Hotel.
 Address                      Street address of hotel.
 City                         City where the hotel is located.
 State or Province            State or province where the hotel is located.
 Country                      Country where the hotel is located.
 Postal Code                  Postal code (i.e. zip code) where the hotel is located.
 Room Count                   The total number of guestrooms for the hotel in 2019. If a hotel’s room count changed during the year, the value most representative of the hotel’s room count for 2019 was
                              used.
 Area Unit                    Choose either "sqft" or "sqm" to indicate the units of measurement of the floor area data being entered (either square feet or square meters).
 Total Area                   Total floor area of conditioned space of the property.
                              Total Area value should equal Rooms Area + Meeting Space Area + Other Area.
 Rooms Area                   Total area of conditioned space of the rooms and corridors, per the HCMI guidance.
 Meeting Space Area           Total area of conditioned space of the meeting space and pre-function space in the hotel, per HCMI guidance.
 Other Area                   The total remaining area of conditioned space within the property not covered by rooms and meeting space.
 Location Type                The location segment of the property: urban, suburban, rural/highway, airport, convention, resort, timeshare, small metro/town, bed & breakfast, extended stay.
 Year Opened                  The year the property originally opened, regardless of whether major renovations have occurred since that year.
12-Month Operation            Confirm with a “Yes” that the hotel was in operation for all of 2019 without any shutting down or major renovation that would significantly alter the energy consumption or
                              occupancy (either rooms or meeting space) during the period.
 Laundry                      Choose either “Included” or “Not Included” to denote whether the energy consumption includes the washing of bedroom linens. For properties with partial in-house wash, the determining factor is whether bedroom
                              linens are included in that wash. For example, linen wash of restaurant linens or guest clothing only, would be considered “not included.”
 Energy Verification          Indicate whether the energy data for each property has been third-party verified per the following choices: Limited, Reasonable, Full, No, Don't know. Limited refers to a
                              company-wide third-party "limited assurance", Reasonable refers to a companywide third-party "reasonable assurance" and "full" indicates that the specific property's data
                              have been third-party verified onsite or through direct examination of billing and consumption.
 Water Verification           Indicate whether the water data has been third-party verified per the following choices: Limited, Reasonable, Full, No, Don't know. Limited refers to a company-wide third-
                              party "limited assurance", Reasonable refers to a companywide third-party "reasonable assurance" and "full" indicates that the specific property's data have been third-party
                              verified onsite or through direct examination of billing and consumption.
 Unit                         Enter the unit of measurement for the data entered.
 Occupied Rooms               The total number of occupied rooms for the hotel for each month within 2019. Rooms sold may be used as a proxy.
 Water Consumption by Type    The total water consumption for each month in 2019 as provided by the utility provider by type of water source.
 Energy Consumption by Type   The total energy usage for each month in 2019 as provided by the utility provider by type of energy source.

                                                    7                                                                                                          The Center for Hospitality Research • Cornell University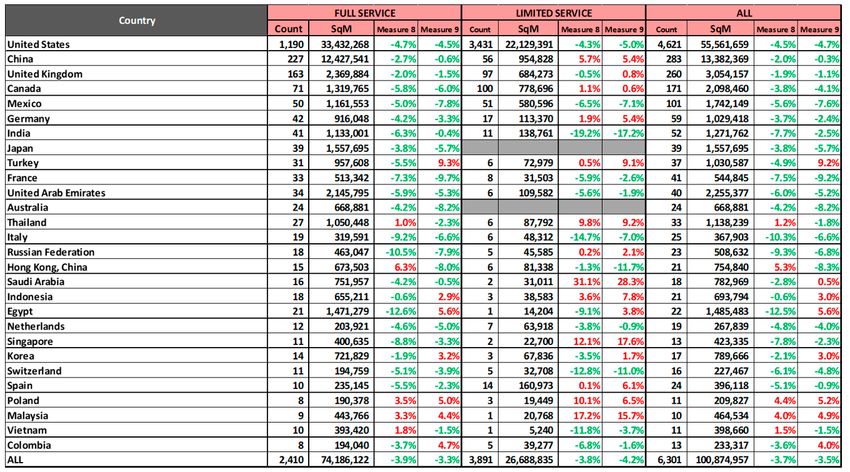
Exhibit 3

 Summary of validity tests performed on the data set
                                                                                               High             Low             Action Taken if Beyond                % Of Data
                              Validity Test Description
                                                                                             Threshold        Threshold          Threshold or Missing                Set Excluded
 Property underwent significant renovation or closed all or significant part of floor area      N/A              N/A      Excluded from Measures 1-12                    2.5%

 for a portion of the year

 Energy Per Occupied Room Outlier (kWh/ocrm)                                                   1000              10       Excluded from Measures 1,3,5,12               17.7%

 Energy Per Square Meter Outlier (kWh/m2)                                                      2000              20       Excluded from Measures 2,4,6,7,12             18.0%

 Property did not provide any purchased electricity data                                        N/A              N/A      Excluded from Measures 1,2,3,4,5,6,7,12        4.2%

 Property did not have 12 separate electricity data points                                      N/A              N/A      Excluded from Measures 1,2,3,4,5,6,7,12       19.0%

 Property did not provide any occupied rooms data                                               N/A              N/A      Excluded from Measures 1,3,5,7,8,10,11         0.3%

 Property did not have 12 separate occupancy data points                                        N/A              N/A      Excluded from Measures 1,3,5,7,8,10,11         8.3%

 Occupancy Outlier                                                                             104%              35%      Excluded from Measures 1,3,5,7,8,10,11        11.2%

 Property did not provide any water usage data                                                  N/A              N/A      Excluded from Measures 8-11                    6.2%

 Property did not have 12 separate water data points                                            N/A              N/A      Excluded from Measures 8-11                   21.8%

 Water Per Occupied Room Outlier (L/ocrm)                                                      10000             40       Excluded from Measure 8,10,11                 37.0%

 Water Per Square Meter Outlier (L/m2)                                                         12500             100      Excluded from Measures 9,11                   35.6%

 % Of Floor Area attributes to Rooms Footprint                                                 100%             40%       Excluded from Measures 1,7,10,11              52.6%

 Average SqM per guestroom of entire building outlier                                          2500              20       Excluded from Measures 2,4,6                   9.9%

 Average size of guestroom outlier                                                              750              15       Excluded from Measures 10,11                  55.7%

 Only one source of energy was indicated for calculating total energy                           N/A              N/A      Notified only, no action taken                 5.5%

 At least one energy or water source had a high variance of a ratio of 4-to-1 between           N/A              N/A      Notified only, no action taken                40.8%

 high/low months or 80% month-to-month

 Exhibit 4

 Count of data set included for each measure
                                                                                                                                           Count of Data Set        % Of Data Set
   Measure                                                                Description
                                                                                                                                                Included              Excluded
 Measure 1          HCMI1 Footprint Per Occupied Room                                                                                              7782                 63.7%

 Measure 2          Total carbon footprint of the property divided by number of rooms                                                              15339                28.4%

 Measure 3          Total carbon footprint of the property divided by number of OCCUPIED rooms                                                     15003                30.0%

 Measure 4          Total carbon footprint of the property divided by the total floor area in SQUARE METERS                                        15336                28.4%

 Measure 5          Total energy usage of the property divided by number of OCCUPIED rooms                                                         15003                30.0%

 Measure 6          Total energy usage of the property divided by floor area of the property in SQUARE METERS                                      15339                28.4%

 Measure 7          HCMI Footprint of Meeting Space Per Hour Per Square Meter of Meeting Space                                                     6519                 69.6%

 Measure 8          Total water usage of the property divided by the total number of OCCUPIED ROOMS                                                13511                37.0%

 Measure 9          Total water usage of the property divided by the floor area of the property in SQUARE METERS                                   13802                35.6%

 Measure 10         HWMI2 Footprint Per Occupied Room                                                                                              3132                 85.4%

 Measure 11         HWMI Footprint of Meeting Space Per Hour Per Square Meter of Meeting Space                                                     2722                 87.3%

 Measure 12         Percentage of property's total energy that is generated from renewable sources                                                 15338*               28.4%

                                                                                                                                               (Including 0%)

     1      HCMI (Hotel Carbon Measurement Initiative) is the industry-accepted way to measure and compare scope 1 and 2 GHG emissions
of hotels. In includes emissions related to fuels burned on site (e.g., in gas boilers and company vehicles) and electricity used on site. It also
accounts for emissions related to any outsourced laundry and refrigerants (e.g., used in air conditioning).
     2      HWMI is the industry accepted way to measure and compare water consumption. It includes metered (e.g., municipal) and un-
metered (e.g., borehole) sources of water used by a hotel and accounts for water used by any outsourced laundry providers. Hotels can use
HWMI to calculate their water footprint per occupied room (per night) and the water footprint of an area of meeting space per hour.

      8                                                                                                The Center for Hospitality Research • Cornell University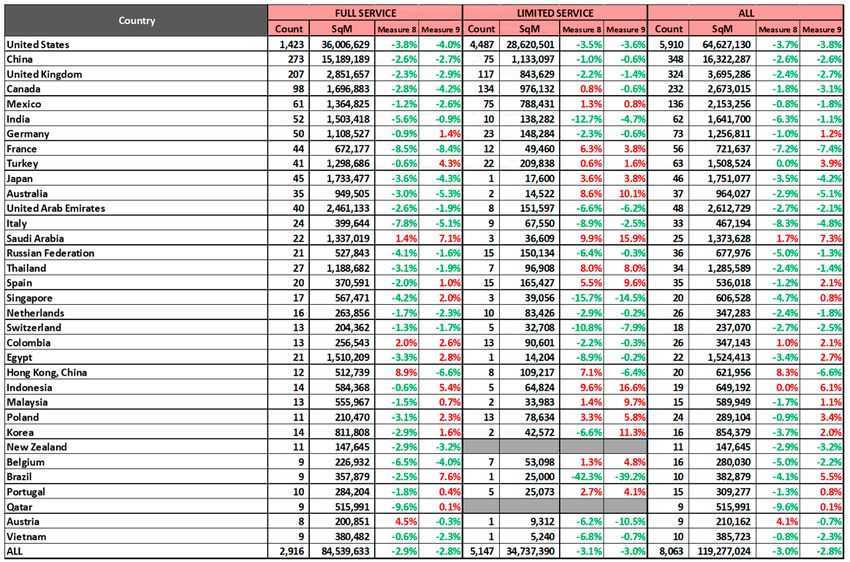
For measures 10 and 11, using the methodology of         the All-Hotels option includes those properties in the
the Hotel Water Measurement Initiative (HWMI), we             output results.
took the remaining data set after the validity testing
and excluded properties that also (1) washed laundry           Exhibit 5
off-site and (2) purchased district-chilled water as an          Segmentation categories
energy source. Though HWMI also allows for metrics              Asset Class
of per guest-night in addition to per occupied room,
                                                                Full-Service Resort
the lack of available guest-night data was addressed
                                                                Full-Service NonResort
by only providing output metrics based on occupied
                                                                Limited Service
rooms.
                                                                Number of Stars
3. Geographic and Climate Zone Segmentation
                                                                2 and 2.5 Stars
Third, data were segmented by geographic location,
first by geocoding each property and then by clustering         3 and 3.5 Stars
based on unified boundaries. We use the term geogra-            4 and 4.5 Stars
phy, which may refer to one of the following:                   5 Stars

 •       Metro Area is generally a major city and               Market Segment
         its surrounding towns or jurisdictions, as             Economy and Midscale
         defined by a metropolitan statistical area             Upper Midscale
         (MSA), national capital region (NCR), or               Upscale
         greater metropolitan area;
                                                                Upper Upscale
 •       Country;                                               Luxury
                                                                Type
 •       Region, which may be sub-national (a state             Urban
         or province, autonomous region, unincor-
                                                                Suburban
         porated territory, or national region) or
         trans-national (a major tourist or urban mar-          Small Metro/Town
         ket that crosses national borders, or a simi-          Rural/Highway
         lar regional grouping of countries). Various           Airport
         geographies are used to maximize the data
                                                                Extended Stay
         output depending on the data received, and
         to increase the ability to enable comparisons          Resort – Summer Seasonal
         and benchmarking; or                                   Resort – Winter Seasonal
                                                                Integrated Resort
 •       Climate Zone, using both the Köppen-Gei-
                                                                Convention
         ger climate classification system and Bailey’s
         Ecoregions of the World.                               Timeshare/Serviced Apartment
                                                                Bed & Breakfast
4. Property Segmentation                                        All Hotels (within a given geography)
Fourth, properties were grouped by segments, apply-
ing the revenue-based approach and property-type
segmentation used by STR Global (using 2020 global            5. Minimum Output Thresholds
chain scales), the asset class segmentation of full-ser-      Finally, we set a minimum threshold of eight proper-
vice and limited-service hotels, and a global data set of     ties for output data to populate a geography. That is,
star levels for hotels as listed by Expedia. The final data   where a specific segment within a geography contained
set was grouped into categories together with an over-        at least eight properties, the results were populated in
all grouping that combines all segments within that ge-       the tool. Consequently, data for cities, regions, climate
ography, as shown in Exhibit 5.                               zones, or countries with fewer than eight properties
     We did not receive sufficient data to include sepa-      were excluded from the final outputs. After we ap-
rate categories for economy and midscale segments             plied the validity tests and removed geographies with
or hotels below 2 stars, as the data for those segments       fewer than eight properties, the final output tables in
generally did not meet minimum thresholds in each             CHSB2021 encompass 15,339 properties across 583 ge-
geography to produce a meaningful output. However,

     9                                                          The Center for Hospitality Research • Cornell University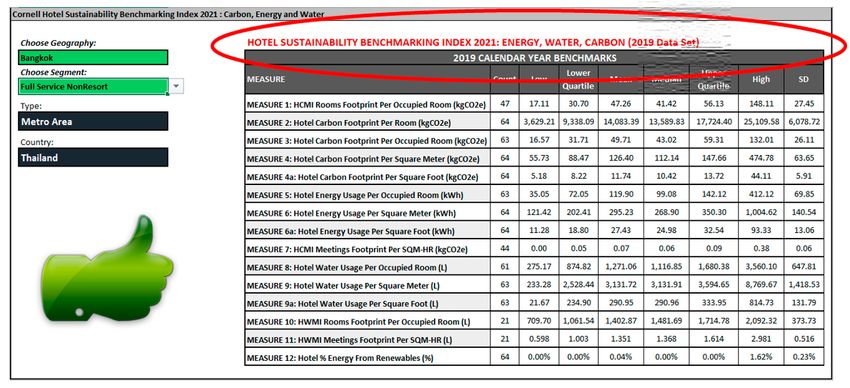
ographies. This represents an increase from the prior       Energy Usage Has Reduced Since 2017
year’s data set (i.e., 2018 calendar-year data for CHSB         The energy intensity of the like-for-like data set
2020), with 8% more properties added in the 2019 data       has reduced 3.30% overall on average since 2017, with
set. The increase in data helped generate the minimum       0.41% of overall reduction recorded from 2017 to 2018
threshold required to add new geographies, either           and 3.09% of overall reduction from 2018 to 2019. The
new metro areas (including non-metropolitan areas) or       decrease is largely driven by limited-service hotels,
countries.                                                  which account for a larger portion of the data set and
                                                            footprint. Among limited-service hotels, energy usage
FINDINGS                                                    increased slightly in 2018 by 0.93% overall on average
    The exercise of aggregating inputs and producing        yet reduced significantly in 2019 by 3.02% overall on
the outputs, as well as the resulting data set, demon-      average. In contrast, energy usage per square meter
strates several findings for consideration.                 among all full-service hotels has reduced since 2017 by
                                                            3.69% overall on overage.
Historical and Year-Over-Year Trends
     Having gained publication longevity, the CHSB          Water Usage Intensity Has Reduced Consistently
index is able to provide insight into historical trends.    Since 2017
A total of 7,313 and 6,301 hotels in the data set have          The water intensity of the like-for-like data set has
produced valid benchmarks for energy and water mea-         reduced consistently since 2017. The overall average
sures respectively to enable a like-for-like comparison     of water usage per occupied room has reduced 3.73%
among the 2017 to 2019 calendar years data. The ap-         since 2017. Water usage per occupied room of full-ser-
proach of comparing the change over time depends on         vice hotels has reduced by 3.91% overall, and limited-
the intended view and use of the information, whether       service hotels recorded an overall average reduction of
at a geography level or individual-property level. Ex-      3.79% since 2017. Both limited-service and full-service
hibit 6 presents the change from 2017 to 2019 in three      hotels also recorded a reduction in weighted average
measures using three types of average change. Appen-        and average of averages in 2019, although a slight in-
dix 2 to 5 present the overall average change since 2017    crease was recorded in 2018.
for select countries and metro areas for energy and wa-
                                                            Full-Service Non-Resort Recorded Consistent
ter, including the hotel count and total gross floor area
to provide an overview on the origin of the data. Most      Reduction in Energy Usage Since 2017
of the historical trend data set (average of 75%) is from        For this year’s report, further breakdown of full-ser-
the United States, as the initial CHSB studies focused      vice hotels was done to separate out resorts. The break-
heavily on North America. That limitation will dimin-       down of full-service hotels into full-service resort and
ish over time as the data set continue to expand with       full-service non-resort revealed a continuous reduction
additional global data each year.                           in energy usage among full-service non-resort proper-
     In addition, we have analyzed a year-over-year         ties since 2017, with an overall average decreased by
output of all properties that have been part of the data    4.38%. Full-service non-resorts reduced energy usage
set for the past two years and passed all validity tests.   per square meter by 3.50% overall on average in 2019.
The resulting year-over-year data set includes a total of   Limited-service recorded a reduction of 3.02% overall
9,396 and 8,063 properties for energy and water mea-        on average. This study also revealed that the reduction
sures respectively, of which 65% are limited-service op-    in energy usage per square meter among full-service
erations. Overall observations, as presented in Exhibit     non-resorts is higher than that of limited-service hotels.
7, revealed that limited-service and full-service, non-     Indeed, while full-service non-resorts recorded contin-
resort properties have reduced their energy and water       uous reduction in energy usage per square meter since
intensity over time in most of the countries, including     2017, limited-service recorded an increase in overall av-
the United States. Appendix 6 to 9 present the overall      erage of 0.93% in 2018. Yet, both full-service non-resort
average year-over-year change among select countries        and limited-service recorded an increase in average of
and metro areas for energy and water. Seventy-five per-     averages since 2017 by 1.20% and 0.33% respectively
cent of the properties are in the United States, of which   for energy usage per square meter.
around 70% are limited-service hotels.

    10                                                        The Center for Hospitality Research • Cornell University
Exhibit 6
Three-year average change by measure and service type
* The resulting three-year average data set included a total of 7,313 hotels for energy and GHG measures
** The resulting three-year average data set included a total of 6,301 hotels for water measures
Exhibit 7
Year-over-year average change by measure and service type
* The resulting year over year average data set included a total of 9,396 hotels for energy and GHG measures
** The resulting year over year average data set included a total of 8,063 hotels for water measures
Weighted Average Change = average change of the hotel multiplied by the percentage of that hotel’s floor area to the total floor area of the like-for-like data set;
Overall Average Change = average change in the total usage or emissions of the entire data set divided by the total floor area of the like-for-like data set; and
Average of Averages Change = mean of the average change of all hotels in the like-for-like data set.
Water Usage Intensity Improved Among Full-Service The “Efficiency Gap” in Each Market
Resorts This year’s study includes a review of the ranges
While full-service non-resorts and limited-service of performance within a selected geography and seg-
recorded a continuous reduction in overall average of ment, adding the specification of laundry to the bound-
water per occupied room since 2017, full-service resorts ary (comparing hotels with onsite laundry among
have recorded an increase in water usage per occupied themselves, and those without among themselves). As
room by 1.54% overall on average in 2018 compared to shown in Exhibit 8, the ratio of upper quartile of perfor-
2017. However, in 2019, full-service resorts recorded re- mance to lower quartile of performance (upper quartile
duced water usage compared to 2018, with an overall intensity divided by lower quartile intensity) is over 1.5
average decreased by 3.52%, subsequently resulting in for both energy per square meter and water per occu-
a reduction of 1.64% overall on average since 2017. pied room. This indicates a greater dispersion in energy
11 The Center for Hospitality Research • Cornell UniversityExhibit 8
Ratio of upper quartile to lower quartile among full-service non-resort and limited service
and water usage intensity among the data set, of which more limited-service hotels, properties still
the best-performing hotels are doing over 1.5 times bet- within the range, beginning with upper mid-
ter than their peers. This year’s results were tabulated scale or 3-stars. While this does not affect
for full-service non-resort and limited-service hotels the benchmarking within other segments,
overall, the benchmarks for a metro area or
and disclosed a marginal efficiency gap in energy per country likely skew higher than the actual
square meter and water per occupied room. Full-ser- hotel supply of the same geography, given
vice hotels with onsite laundry recorded lower per- that economy hotels (with smaller public
formance ratios of 1.76 and 1.63 for energy per square areas, fewer amenities, and less spacious
meter and water per occupied room. Likewise, limited- guestrooms) consume less energy and wa-
service hotels, although deemed to perform better than ter. Economy and midscale, or 1- and 2-star
full-service resorts, have similar performance ratios of properties, will be sought for future studies.
1.76 and 1.68 for energy per square meter and water per
2. The results are skewed toward branded
occupied room, which is on par with full-service non- chains. Similarly, given that the vast major-
resorts with laundry. Performance ratios for full-service ity of the hotels in this study are represented
resorts were not tabulated due to an insufficient num- by branded flags, the results may not repre-
ber of properties in the selected geographies. These em- sent those of the full hotel supply. It is pos-
pirical data, demonstrating the wide ratio between the sible that branded hotels are more efficient
upper quartile and the lower quartile across most of the than independent hotels, given the avail-
markets, highlight opportunities for hotels within the ability of capital that would allow brands
to renovate and retrofit the building equip-
upper quartile to reduce their utility use.
ment and FF&E (furniture, fixtures, and
equipment) - an avenue not always available
LIMITATIONS to independent hotels. The CHSB index still
Several limitations are present in this study given needs to include more independent hotels
the data set and representation of participating compa- to balance out the range and be representa-
tive of the actual hotel supply in any given
nies:
geography.
1. The results remain skewed toward the
higher end of segment tiers. CHSB2021 3. The results are skewed towards the United
relies heavily on aggregate data sets from States. Although the data set covers 57 coun-
large hotel owners and operators who also tries, two more than last year, the majority of
manage, instead of franchise, their proper- the data still comes from the United States.
ties. This year’s brand data set included Sixty-four percent of the data set was within
12 The Center for Hospitality Research • Cornell Universitythe US geographies, a decrease of only 0.1% will not be published in 2022. The collection of 2021 cal-
from the previous data set. As such, the ra- endar year data for CHSB2023 will begin in 2022 and
tio of the hotels in the data set to potential will aim to provide an updated index with more data
hotels in the country is lower outside of the and increased segmentation and granularity for partici-
US. We have continued to grow the data set
both within and outside of the US, and, in
pant benchmarking. We will especially continue to seek
the future, we will continue to seek data additional data from independents, smaller chains, and
from outside the US to achieve a more equal smaller properties that are currently underrepresented
global representation. in the global data set.
Hotels are welcome to participate in CHSB2023 by
4. The data have not been verified. Despite contributing 2021 calendar year data. For further infor-
our validity tests, unless all data have been mation about how to get involved, please email Eric
verified using a third-party provider, it can- Ricaurte.
not be concluded that the data set are 100
percent accurate. Over 70 percent of the data
set, however, has undergone external third- HOW TO USE THE INDEX
party verification as part of participants’ The index consists of two outputs: full data tables
own corporate reporting, which serves as a and a search tool for accessing the index. Twelve full
primary validation method.
data tables are provided, each a separate worksheet
As CHSB evolves to understand the drivers of en- containing the benchmarks for a single measure.
ergy, water, and carbon within hotels, we will seek to Each data table contains the list of geographies and
enhance comparisons by incorporating additional hotel the benchmarks per segment. The data tables can be ac-
amenities that might contribute to high energy or water cessed for research and calculation purposes for mul-
usage. tiple properties and regions.
OUTLOOK FOR CHSB2023 Geographies
As we have outlined throughout this report, the Benchmarks are provided for cities, regions, countries,
CHSB study is an evolving index and process. Because or climate zones. See the Geographies tab in the tool for
2020 data were impacted by the global pandemic, CHSB a complete listing.
Exhibit 9
Measures used in the CHSB Index (2019 calendar year data)
Measure 1 Carbon footprint of 1 room-night stay, per the Hotel Carbon Measurement Initiative (HCMI) methodology
Measure 2 Total carbon footprint of a property for the calendar year, divided by its number of rooms
Measure 3 Total carbon footprint of a property for the calendar year, divided by its number of OCCUPIED rooms within the same calendar year period
Measure 4 Total carbon footprint of a property for the calendar year, divided by its total floor area in SQUARE METERS
Measure 4a Total carbon footprint of a property divided by its total floor area in SQUARE FEET
Measure 5 Total energy usage of a property for the calendar year, divided by its number of OCCUPIED rooms within the same calendar year period
Measure 6 Total energy usage of a property for the calendar year, divided by its floor area in SQUARE METERS
Measure 6a Total energy usage of a property for the calendar year, divided by its floor area in SQUARE FEET
Measure 7 Carbon footprint of 1 square meter of meeting space occupied for 1 hour, per the Hotel Carbon Measurement Initiative (HCMI) methodology
Measure 8 Total water usage of a property for the calendar year, divided by its total number of OCCUPIED ROOMS within the same calendar year period
Measure 9 Total water usage of a property for the calendar year, divided by its floor area in SQUARE METERS
Measure 9a Total water usage of a property for the calendar year, divided by its floor area in SQUARE FEET
Measure 10 Water usage of 1 room night stay, per the Hotel Water Measurement Initiative (HWMI) methodology
Measure 11 Water usage of 1 square meter of meeting space occupied for 1 hour, per the Hotel Water Measurement Initiative (HWMI) methodology
Measure 12 Percentage of a property’s total energy usage within the calendar year that was generated onsite from renewable sources
13 The Center for Hospitality Research • Cornell UniversityMeasure Values 5. Median – the middle value found within the
For each measure, values are broken down as follows: geography and segment grouping;
1. Count – the number of properties included 6. Upper Quartile – the 75-percent marker
within this geography and segment group- within the data set. Seventy-five percent of
ing; the properties within the geography and seg-
ment were at or below this figure;
2. Low – the lowest value found within the ge-
ography segment grouping (this is the best 7. High – the highest value found within the
performer of the group); geography segment grouping (this is the
worst performer of the group); and
3. Lower Quartile – the 25-percent marker
within the data set. Twenty-five percent of 8. SD – the standard deviation across the data
the properties within the geography and set of properties within the geography and
segment were at or below this figure; segment.
4. Mean – the “average” or total output for the
corresponding measure for the properties The Tool tab contains a searchable index per geography,
within the geography and segment, divided segment, and measure. Steps to use the tool are outlined
by the number of corresponding properties; below.
STEP 1: click on the Tool tab.
14 The Center for Hospitality Research • Cornell UniversitySTEP 2: Select the Geography to be used, choosing from the dropdown list.
For further description of each geography, refer to the Geographies tab. Upon selecting the Geography, the Geography
Type and Country will populate automatically in the dark gray-blue boxes.
STEP 3: Select the segment to be filtered from the dropdown list.
15 The Center for Hospitality Research • Cornell UniversitySTEP 4: View the corresponding results in the gray table at the top “2019 Calendar Year Benchmarks.”
The example below is for a user that has selected to view the data set corresponding to properties within the full-
service non-resort market segments in the MSA of Bangkok:
In this example: • For all measures the quartiles, mean, and
median fall within the Low and High range
• A possible 64 full-service non-resort proper-
ties within the Bangkok metro area of Thai-
land comprise the benchmarks, though for
each, there may be less if some hotels did Interpreting and Using the Results
not have complete data that passed all valid- Some examples of how these figures can be used:
ity tests. For example, Measure 10 and 11 are
the lowest count, with 21 hotels in the data • An owner, operator, or potential buyer of a
set for those specific measures. single hotel in the Bangkok metro area can
find where the hotel falls along the energy
range.
• MEASURE 1: The mean (average) HCMI
rooms footprint (guest footprint of a night
stay) is 47.26 kgCO2e/OCRM • If the hotel is in the Upper Quartile,
it can analyze internally what driv-
ers are causing it to be in the high
• MEASURE 2: The upper quartile carbon
quartile. Some may be controllable,
footprint per room in a calendar year is
others may not be.
17,724.40 kgCO2e/OCRM (meaning that of
the 64 properties counted in the benchmark
for this measure, 75% fell below 17,724.40 • For additional analysis, the user
and 25% fell at or above 17,724.40) may wish to choose a different seg-
ment or hotel type (e.g., full-service
resort, full-service non-resort, or
• MEASURE 6a: The lowest energy usage per
stars) that relates to the metro area,
square foot is 11.28 kWh/Sqft
country, or a specific climate zone.
• MEASURE 8: The highest water usage per
• A feasibility study for developing a hotel in
occupied room is 3,560.10 L/OCRM
the Bangkok metro area can choose where
16 The Center for Hospitality Research • Cornell Universityalong this range to use the benchmark to es- In addition, CHSB data feeds the Greenview Hotel
timate energy usage per occupied room, and Footprinting Tool1, which allows users to find an esti-
conversely, by changing to Measure 6, can mation of the carbon footprint of hotel stays or meet-
perform further analysis based on floor area. ings around the world. This is a useful tool for those
who are wishing to determine the carbon footprint
• An event planner organizing a citywide
event in Bangkok which will require ac- of hotel bookings for the purpose of calculating their
commodations in dozens of hotels can use Scope 3 business travel emissions as part of net-zero
Measure 1, the HCMI rooms footprint (for calculations as well as for offsetting.
example, choosing a higher range bench- The UK Government Greenhouse Gas2 guidance
mark), and multiply that figure by the total for company reporting uses the conversion factors and
number of rooms to calculate the total car- data from CHSB and the Greenview Hotel Footprint-
bon footprint of the room block. The event ing Tool.
planner can also use Measure 7 to calculate
the footprint of the meeting space utilized
during the event. Other instances where CHSB data has been used to
support carbon calculation initiatives include:
• If the event planner wanted to offer • Euromonitor Sustainable Travel Index3
its attendees an option to offset the – CHSB provided source data for hotel
carbon footprint of their stay, they carbon emissions
could incorporate the same figure
as the base calculation for the at- • Greenprint Performance Report4 –
tendee’s carbon footprint. Integration of CHSB data with global
building benchmarking
• Researchers or policymakers from a munici-
pality, region, or country seeking to under- • Hotel Global Decarbonisation Report5 -
stand the impact of water usage from hotels CHSB used as the basis for estimating
in their geography can obtain the current the total carbon, energy, and water
hotel supply and pipeline and run scenarios footprint of the hotel industry
based on the statistics provided (e.g., high,
low, mean).
• Destination Water Risk Index6 – CHSB
used as the basis for weighting the risk
• The travel and tourism industry can calcu- based on water intensity by market g
late the carbon footprint of hotel stays across
multiple destinations to report on scope 3
business travel and calculate amounts for 1 Greenview Hotel Footprinting Tool
carbon offsetting. 2 UK Government Greenhouse Gas
3 Euromonitor Sustainable Travel Index
Other Uses of CHSB 4 Greenprint Performance Report
CHSB data can be used by individual hotels, hotel 5 Hotel Global Decarbonisation Report
companies or other interested parties, such as corpo- 6 Destination Water Risk Index
rate customers or travel managers, to benchmark hotel
energy, carbon, and water performance. By comparing
actual data from a property with the values for a simi-
lar property in a similar location, one can determine
how a property is performing compared to its peers.
17 The Center for Hospitality Research • Cornell UniversityAPPENDIX 1: List of validity tests performed on the data set
High Low Action Taken if Beyond % Of Data Set
Country Validity Test Description
Threshold Threshold Threshold or Missing Excluded
All Countries Property underwent significant renovation or closed all or significant part of floor area N/A N/A Excluded from Measures 1-12 2.5%
for a portion of the year
All Countries Energy Per Occupied Room Outlier (kWh/ocrm) for full-service luxury hotels 700 25 Excluded from Measures 1,3,5,12 10.8%
All Countries Energy Per Occupied Room Outlier (kWh/ocrm) for full-service Upper Upscale hotels 700 45 Excluded from Measures 1,3,5,12 18.8%
All Countries Energy Per Occupied Room Outlier (kWh/ocrm) for full-service Upscale hotels 600 40 Excluded from Measures 1,3,5,12 20.8%
All Countries Energy Per Occupied Room Outlier (kWh/ocrm) for full-service Upper Midscale 600 35 Excluded from Measures 1,3,5,12 25.2%
hotels
All Countries Energy Per Occupied Room Outlier (kWh/ocrm) for full-service Midscale hotels 500 30 Excluded from Measures 1,3,5,12 40.4%
All Countries Energy Per Occupied Room Outlier (kWh/ocrm) for full-service Economy hotels 400 25 Excluded from Measures 1,3,5,12 76.9%
All Countries Energy Per Occupied Room Outlier (kWh/ocrm) for limited-service Upscale hotels 200 20 Excluded from Measures 1,3,5,12 12.9%
All Countries Energy Per Occupied Room Outlier (kWh/ocrm) for limited-service Upper Midscale 150 17 Excluded from Measures 1,3,5,12 15.4%
hotels
All Countries Energy Per Occupied Room Outlier (kWh/ocrm) for limited-service Midscale hotels 100 13 Excluded from Measures 1,3,5,12 20.1%
All Countries Energy Per Occupied Room Outlier (kWh/ocrm) for limited-service Economy hotels 75 10 Excluded from Measures 1,3,5,12 34.6%
All Countries Energy Per Occupied Room outlier (kWh/ocrm) for resort with onsite laundry 1000 40 Excluded from Measures 1,3,5,12 14.5%
All Countries Energy Per Occupied Room outlier (kWh/ocrm) for resort without onsite laundry 800 30 Excluded from Measures 1,3,5,12 19.6%
All Countries Energy Per Occupied Room outlier (kWh/ocrm) for resort without laundry data 700 40 Excluded from Measures 1,3,5,12 16.5%
All Countries Energy Per Occupied Room outlier (kWh/ocrm) for integrated resort with onsite 1000 40 Excluded from Measures 1,3,5,12 0.0%
laundry
All Countries Energy Per Occupied Room outlier (kWh/ocrm) for integrated resort without onsite 1000 40 Excluded from Measures 1,3,5,12 0.0%
laundry
All Countries Energy Per Square Meter outlier (kWh/m2) for full-service hotels 1300 80 Excluded from Measures 2,4,6,7,12 17.0%
All Countries Energy Per Square Meter outlier (kWh/m2) for limited-service hotels 700 65 Excluded from Measures 2,4,6,7,12 18.4%
18 The Center for Hospitality Research • Cornell UniversityHigh Low Action Taken if Beyond % Of Data Set
Country Validity Test Description
Threshold Threshold Threshold or Missing Excluded
All Countries Energy Per Square Meter outlier (kWh/m2) for resort with onsite laundry 2000 40 Excluded from Measures 2,4,6,7,12 10.8%
All Countries Energy Per Square Meter outlier (kWh/m2) for resort without onsite laundry 1500 20 Excluded from Measures 2,4,6,7,12 16.4%
All Countries Energy Per Square Meter outlier (kWh/m2) for resort without laundry data 2000 40 Excluded from Measures 2,4,6,7,12 17.4%
All Countries Energy Per Square Meter outlier (kWh/m2) for integrated resort with onsite laundry 2000 40 Excluded from Measures 2,4,6,7,12 0.0%
All Countries Energy Per Square Meter outlier (kWh/m2) for integrated resort without onsite 2000 40 Excluded from Measures 2,4,6,7,12 0.0%
laundry
All Countries Property did not provide any purchased electricity data N/A N/A Excluded from Measures 1-7,12 4.2%
All Countries Data did not have 12 separate electricity data points N/A N/A Excluded from Measures 1-7,12 19.0%
All Countries Property did not provide any occupied rooms data N/A N/A Excluded from Measures 1,3,5,8 0.3%
All Countries Data did not have 12 separate occupancy data points N/A N/A Excluded from Measures 1,3,5,8 8.3%
All Countries Occupancy outlier 104% 35% Excluded from Measures 1,3,5,8,10,11 11.2%
All Countries Property did not provide any water usage data N/A N/A Excluded from Measures 8-11 6.2%
All Countries Data did not have 12 separate water data points N/A N/A Excluded from Measures 8-11 21.8%
All Countries Water Per Occupied Room outlier (L/ocrm) for full-service hotels without onsite 5000 275 Excluded from Measure 8,10,11 17.5%
laundry
All Countries Water Per Occupied Room outlier (L/ocrm) for full-service hotels without onsite 4500 200 Excluded from Measure 8,10,11 20.8%
laundry
All Countries Water Per Occupied Room outlier (L/ocrm) for full-service hotels without laundry data 5000 275 Excluded from Measure 8,10,11 44.2%
All Countries Water Per Occupied Room outlier (L/ocrm) for limited-service hotels without onsite 1700 50 Excluded from Measure 8,10,11 10.7%
laundry
All Countries Water Per Occupied Room outlier (L/ocrm) for limited-service hotels without onsite 1500 40 Excluded from Measure 8,10,11 18.9%
laundry
All Countries Water Per Occupied Room outlier (L/ocrm) for limited-service hotels without laundry 1500 40 Excluded from Measure 8,10,11 36.6%
data
19 The Center for Hospitality Research • Cornell UniversityHigh Low Action Taken if Beyond % Of Data Set
Country Validity Test Description
Threshold Threshold Threshold or Missing Excluded
All Countries Water Per Occupied Room outlier (L/ocrm) for resort with onsite laundry 7500 300 Excluded from Measures 9,11 22.4%
All Countries Water Per Occupied Room outlier (L/ocrm) for resort without onsite laundry 6500 200 Excluded from Measures 9,11 29.8%
All Countries Water Per Occupied Room outlier (L/ocrm) for resort without laundry data 7500 300 Excluded from Measures 9,11 32.8%
All Countries Water Per Occupied Room outlier (L/ocrm) for integrated resort with onsite laundry 7500 400 Excluded from Measures 9,11 0.0%
All Countries Water Per Occupied Room outlier (L/ocrm) for integrated resort without onsite 7500 400 Excluded from Measures 9,11 0.0%
laundry
United States Only Water Per Occupied Room outlier (L/ocrm) for full-service hotels without onsite 1400 300 Excluded from Measure 8,10,11 24.9%
laundry in United States
United States Only Water Per Occupied Room outlier (L/ocrm) for full-service hotels without onsite 1500 300 Excluded from Measure 8,10,11 30.4%
laundry in United States
United States Only Water Per Occupied Room outlier (L/ocrm) for full-service hotels without laundry data 1400 300 Excluded from Measure 8,10,11 40.5%
in United States
United States Only Water Per Occupied Room outlier (L/ocrm) for limited-service hotels with onsite 1000 50 Excluded from Measure 8,10,11 16.8%
laundry in United States
United States Only Water Per Occupied Room outlier (L/ocrm) for limited-service hotels without onsite 1200 40 Excluded from Measure 8,10,11 30.3%
laundry in United States
United States Only Water Per Occupied Room outlier (L/ocrm) for limited-service hotels without laundry 1200 40 Excluded from Measure 8,10,11 19.8%
data in United States
United States Only Water Per Occupied Room outlier (L/ocrm) for resort with onsite laundry in United 5000 330 Excluded from Measures 9,11 35.1%
States
United States Only Water Per Occupied Room outlier (L/ocrm) for resort without onsite laundry in United 1900 600 Excluded from Measures 9,11 46.3%
States
United States Only Water Per Occupied Room outlier (L/ocrm) for resort without laundry data in United 5000 330 Excluded from Measures 9,11 19.3%
States
United States Only Water Per Occupied Room outlier (L/ocrm) for integrated resort with onsite laundry 7500 400 Excluded from Measures 9,11 0.0%
in United States
United States Only Water Per Occupied Room outlier (L/ocrm) for integrated resort without onsite 7500 400 Excluded from Measures 9,11 0.0%
laundry in United States
China Only Water Per Occupied Room outlier (L/ocrm) for full-service hotels without onsite 5000 700 Excluded from Measure 8,10,11 25.2%
laundry in China
China Only Water Per Occupied Room outlier (L/ocrm) for full-service hotels without onsite 4000 350 Excluded from Measure 8,10,11 33.1%
laundry in China
20 The Center for Hospitality Research • Cornell UniversityYou can also read