Effects of rice straw biochar on methanogenic bacteria and metabolic function in anaerobic digestion
←
→
Page content transcription
If your browser does not render page correctly, please read the page content below
www.nature.com/scientificreports
OPEN Effects of rice straw biochar
on methanogenic bacteria
and metabolic function
in anaerobic digestion
Su Wang1,3, Fengmei Shi1,3, Pengfei Li1, Fengshan Yang2, Zhanjiang Pei1,3, Qiuyue Yu3,
Xin Zuo3 & Jie Liu1,3*
Anaerobic digestion technology mitigates agricultural organic waste pollution, thereby alleviating
the energy crisis. Biochar materials increase the utilisation rate of biomass resources and promote the
enrichment and growth of microorganisms. Biochar is an effective exogenous additive that stabilises
the anaerobic digestion, improves anaerobic digestion efficiency and gas production. Herein, biochar
materials were prepared from rice straw utilising the sequencing batch anaerobic digestion process.
The biochar microstructure was characterised by scanning electron microscopy (SEM) and Brunauer–
Emmett–Teller (BET) analysis, and microbial succession and metabolic pathways were analysed using
16S rRNA sequencing to reveal the molecular mechanisms. Rice straw biochar addition increased
gas production during anaerobic fermentation. SEM revealed that numerous cocci and microbacteria
became agglomerated and attached to the surface and pores of biochar, which was revealed by BET
analysis to be a good habitat for microorganisms. After anaerobic digestion, the specific surface
area and total pore volume of biochar decreased. 16S rRNA gene sequencing showed that biochar
affected the abundance of certain bacteria and archaea. Biochar had no obvious effect on the function
of bacterial flora but inhibited carbohydrate metabolism by bacteria and glycan biosynthesis and
metabolism by archaea in the anaerobic fermentation system while promoting lipid metabolism by
archaea. Biochar addition inhibited acetic acid production in the anaerobic fermentation system and
promoted methane production based on hydrogen and carbon dioxide levels.
Biochar is a carbonaceous solid residue produced by thermochemical treatments, such as gasification and pyroly-
sis of biomass materials under anoxic c onditions1, and has the characteristics of low solubility, high specific
surface area, complex pore structure, abundant surface-active groups and strong electrical c onductivity2. Biochar
has been widely studied and applied in the field of soil remediation and water treatment. It can significantly
improve the symbiotic relationship of soil microbial communities and increase the activity of m icroorganisms3–5.
It is rich in environmentally persistent free radicals, which can activate hydrogen peroxide and induce dissolved
oxygen to generate reactive oxygen species6, thereby effectively removing or degrading heavy metals and organic
pollutants in soil fertilisers and s ewage7,8. Anaerobic digestion is an effective method to treat livestock m anure9
and is an important zero-carbon technology that combats global warming and drives the global biogeochemical
cycle. Several researchers have found that biochar addition accelerates sludge hydrolysis, aids inhibitor adsorp-
tion, enhances microorganism growth and metabolism and promotes interspecific electron transfer, thereby
increasing the methane output of anaerobic d igestion10,11. Pan et al.12 studied the effects of different addition
ratios of biochar on anaerobic fermentation of chicken manure and found that biochar effectively increased
methane production. The highest cumulative methane production induced by biochar from fruit trees obtained
at 550 °C was 294 mL/g volatile solid content (VS), which was 69% higher than that of the control. Xu et al.13
studied the effect of adding wheat straw biochar on biogas production using pig manure at a moderate tempera-
ture (37 ± 1 °C) and found that compared with pure pig manure treatment, biochar addition could shorten the
delay period of anaerobic fermentation, which was evidenced by the biogas and methane production increasing
by 77.1–96.1% and 78.1–101.8%, respectively.
1
Heilongjiang Academy of Black Soil Conservation and Utilization, Harbin 150086, China. 2School of Life Sciences,
Heilongjiang University, Harbin 150080, China. 3Key Laboratory of Energy Utilization of Main Crop Stalk Resources,
Harbin 150086, China. *email: liujie16777@163.com
Scientific Reports | (2022) 12:6971 | https://doi.org/10.1038/s41598-022-10682-2 1
Vol.:(0123456789)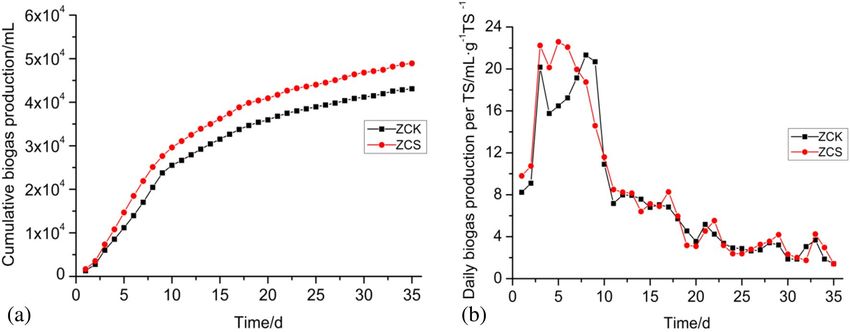
www.nature.com/scientificreports/
Material Dry matter content (TS, %) Volatile solid content (VS, %) pH
Cow dung 24.5 96.1 7.7
Inoculate biogas slurry 3.6 1.4 8.4
Rice straw biochar 94.4 83.6 8.2
Table 1. Basic properties of raw materials.
Biochar addition into the anaerobic digestion system is considered to provide a stable carrier for microor-
ganisms, which is beneficial for the attachment of microorganisms, as it promotes cell fixation and enrichment,
aids growth and reproduction and further improves microorganism diversity in terms of number and popula-
tion structure14,15. Cimon et al.16 believe that biochar provides a growth location for anaerobic bacteria, which
is beneficial to the formation of biofilm and protects acetic-acid–producing bacteria and methanogenic archaea
from toxic pollutants. Y ang17 and Lu18 stated that the biochar surface can effectively enrich a large number of
methanogenic bacteria, such as Methanobacteria and Methanococcus, increase the conversion rate of propionate
to acetate, help methanogenic bacteria to bear higher volatile fatty acids (VFAs) and further enhance the activity
of bacteria during the methanogenic stage. Lee et al.19 found that Gordonia, Thauera and Geobacter are the main
genera attached to the surface of biochar, which are actinomycetes, β Proteus and Proteus deltoid, respectively.
Further, biochar materials can improve the metabolic function of microorganisms in the anaerobic digestion
system, promote cell growth and cell activity, accelerate microbial metabolism and promote the anaerobic diges-
tion process by providing nutrient elements. Ma et al.20 noted that biochar can effectively destroy the structure of
insoluble substances in the anaerobic digestion system; increase the contents of total carbon, dissolved organic
carbon and inorganic carbon; and accelerate the hydrolysis reaction rate. Duan et al.21 found that the hydrolysis
efficiencies of proteins, polysaccharides and fats in a reaction system with biochar were 1.4, 1.2 and 1.4 times
those in a reaction system without biochar, respectively. Li et al.22 found that when biochar is added to the anaero-
bic digestion system of kitchen waste, the hydrogen-nutrient methanogenic process is the main mechanism of
methane production from VFAs at a high temperature, which can promote the material and energy exchange
process between mutually operating oxidising bacteria and methanogenic bacteria.
At present, there are numerous related studies on the influence of biochar materials prepared from algae,
livestock manure, fruit trees, rice husks, wheat or corn stalks on the anaerobic digestion s ystem23,24. Despite
the abundant studies on the types and diversity of microbial flora and microbial distribution, the mechanisms
underlying the relationship between microorganisms and metabolic functions need to be explored f urther23.
Northeast China is an important agricultural area, with a wide rice planting area and well-developed animal
husbandry. Animal manure has been well treated by anaerobic digestion, whereas several rice straw resources
require an effective, harmless and resource-based treatment to solve the problems of regional ecological environ-
ment and resource utilisation. Herein, rice straw was used to prepare biochar material, and its influence on the
anaerobic digestion process of livestock and poultry manure was studied. Through characterisation, observation
and analysis of microbial flora, the influence of biochar on flora and metabolic function in the anaerobic digestion
system was expounded to reveal the mechanism by which rice straw biochar (ZCS) enhances anaerobic diges-
tion and provide a theoretical basis for improving the anaerobic digestion technology of livestock and poultry
manure and the practical application of biochar.
Methods
Experimental materials. Cow dung was collected from the dairy farm of Miteli Agricultural Development
Co., Ltd., Shuangcheng District, Harbin, Heilongjiang Province, China. It was sealed in a transparent polyeth-
ylene bag and stored at 4 °C for later use. Inoculated biogas slurry was obtained from the biogas fermenter of a
dairy farm. Before the experiment, the inoculated biogas slurry was placed on a shaking table at 35 °C for 2 h
and shaken for 24 h to reduce the influence of endogenous biogas on the results. Biochar was prepared from rice
straw obtained from the National Agricultural Demonstration Park of Heilongjiang Academy of Agricultural
Sciences, Harbin, Heilongjiang Province, China. The rice straw was smashed and sieved through a 40-mesh
sieve, then put in a biomass tube furnace(QSK3-9–12, China) at 600 °C for 20 min and subsequently transferred
to the air outlet of the carbonisation furnace for 5 min to prevent the high-temperature carbonised products
from undergoing spontaneous c ombustion10. After the biochar was cooled to room temperature, it was ground
and screened, washed with deionised water to remove ash and dried in an oven at 100 °C for later use. Physical
and chemical properties of the test materials are presented in Table 1.
Test methods. Based on previous research, we prepared biochar materials from rice straw, corn straw and
rice husk. Through single-factor experimental analysis and response surface experimental design, the optimal
technological conditions for the anaerobic digestion of cow dung by biochar addition were compared and deter-
mined. The anaerobic fermentation temperature was 41 °C, the total solid content (TS) of cow dung was 8.9%
and the amount of rice straw charcoal was 7.1 g/L25. Two experimental groups were set up: one in which ZCS
was added and a blank control group (ZCK) without the addition of biochar. Three replicates of each group were
maintained, and anaerobic fermentation was carried out for 35 days.
An experimental batch anaerobic digestion reactor was used, and the reaction device was a 2000 mL jar. After
adding the materials, 500 mL of biogas slurry was inoculated, and the reaction system volume was brought to
1600 mL with distilled water. During inoculation, an anaerobic bottle was filled with 500 mL/min nitrogen gas
Scientific Reports | (2022) 12:6971 | https://doi.org/10.1038/s41598-022-10682-2 2
Vol:.(1234567890)
www.nature.com/scientificreports/
and maintained for more than 6 min so that the reaction system was maintained in a strict anaerobic environ-
ment. The fermentation bottle, gas collection bottle and metering bottle were connected by a latex tube, and the
sealing port of the device was sealed with paraffin wax. Before use, air leakage was assessed to ensure tightness
of the device.
Analysis method. Determination of physical and chemical indices. To determine physical and chemical
indices, sampling should be performed once every 5 days. The pH value was measured using a pH meter (PHS-
3G, China). Biochar pH value detection: biochar and ultrapure water were mixed in a mass volume ratio of
1:10 and shaken in an oscillator for 4 h, following which the pH of the supernatant was measured using a pH
meter12; methane output was measured by draining saturated saline solution25; TS was determined by the drying
method13; VS was determined by the burning method13; and ammonia–nitrogen concentration was determined
using a multi-wavelength ultraviolet–visible spectrophotometer (760CRT Shanghai, China). Chemical oxygen
demand (COD) was measured using a COD analyser (Thermo Orion, USA). VFA concentration was measured
using a gas chromatograph (Agilent 7860A, USA).
Energy input–output calculation. Energy input–output calculation. The energy consumed by preparing biochar
raw materials with unit mass of rice straw and the increase of biogas production efficiency of anaerobic digestion
system by adding biochar with rice straw were calculated by calorific value conversion. The energy output ratio
was calculated. Among it, the calorific value of methane was calculated according to 34,000 kJ/m3. The energy
input for biochar preparation was calculated according to formula (1):
P × (t1 + t2 ) × 3600kJ
Q= (1)
M
where, Q is the calorific value consumed by biochar preparation, kJ/g; P is the rated power of biochar preparation
reaction device, kW; t1 is the time when the reaction device is heated to the biochar preparation temperature, h; t2
is the carbonization time after the reaction device reaches the biochar preparation temperature, h; 3600 kJ is the
coefficient of 1kWh converted calorific value; M is the drying quality in the biochar preparation reaction device, g.
Structure characterisation and surface adsorption determination of biochar. The prepared ZCS was dried and
stored in a bottle container with a sealed cover at 4 °C and was set as CS. After anaerobic fermentation, biochar
samples from the ZCS experimental group were extracted, mixed evenly, dried and set as ZCS.
After gold plating the biochar, the surface structure of biochar was observed using ZEISS MERLIN Compact
(Carl Zeiss AG, Jena, Germany). The specific surface area and pore size distribution of biochar were determined
using a physical adsorption analyser (ASAP 2460 Accelerated Surface Area and Porosimetry System, Micromerit-
ics Instrument Corporation, Norcross, GA, USA) for nitrogen adsorption. The temperature of the analysis tank
was 77.3 K, the sample density was 1 g/cm3, the equilibrium interval was 20 s, the free space of environment was
27.9015 cm3, the free space of analysis was 83.2155 m 3 and the low-pressure dose was 15 m/g STP.
Microbial succession and metabolic pathway determination. Before and after anaerobic fermentation, DNA
was extracted in each treatment, and the DNA extracted in each repeated treatment was mixed evenly after
the concentration was measured. The sample of feed liquid before anaerobic fermentation was set as ZC; the
sample of feed liquid after anaerobic fermentation in the experimental group with ZCS was set as ZCS and the
blank control group without biochar was set as ZCK. Using paired-end sequencing, a library of small fragments
was constructed for sequencing. Through splicing, filtering, clustering or denoising of reads, species annota-
tion and abundance analyses were conducted. The 16S rDNA amplification selection region was V3-V4. Bacte-
rial sequencing primers were 341F (Sequence F: CCTACGGGNGGCWGCAG) and 805R (Sequence R: GAC
TACHVGGGTATCTAATCC), and archaea sequencing primers were 304F (Sequence F: CCCTAYGGGGYG
CASCAG) and 1000R (Sequence R: GGCCATGCACYWCYTCTC).
Data analysis. Data were statistically analyzed and plotted using EXCEL 2013, SPSS 23.0 and Origin 8.0.
Results
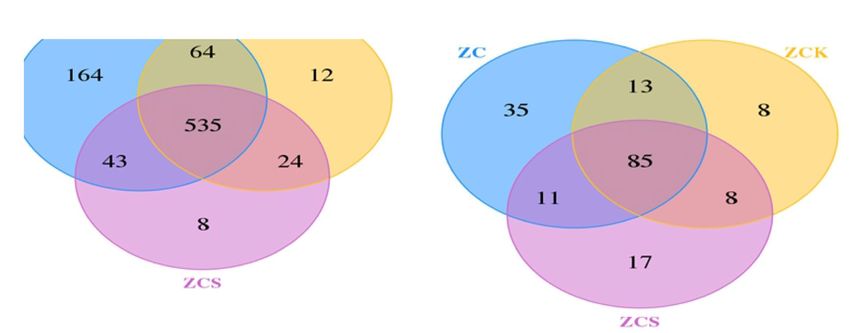
Effects of rice biochar on anaerobic fermentation. Effects of rice biochar on biogas yield. As shown
in Fig. 1a, there was a significant difference between ZCK and ZCS biogas production. On the 35th day after the
start of the experiment, the cumulative biogas production of ZCK was 43,077 ± 712 mL, whereas that of ZCS
was 48,925 ± 1361 mL, demonstrating a mean increase of 13.58%. As shown in Fig. 1b, the daily biogas yield
curve of ZCS showed a rapid upward trend after the start of the experiment, with the biogas yield reaching
22.24 ± 0.65 mL/g·TS−1 on the 3rd day and the highest biogas yield reaching 22.59 ± 0.58 mL/g·TS−1 on the 5th
day. Subsequently, the biogas yield began to gradually decline and reached > 20 mL/g·TS − 1 at the peak of gas pro-
duction. After 10 days, the gas production rate dropped to < 20 mL/g·TS−1, gradually stabilised at 8–5 mL/g·TS−1
and entered the final stage of biogas production on the 22nd day. The daily biogas curve of ZCK treatment was
similar to that of ZCS treatment, showing a trend of increasing at first and then gradually decreasing. On the 3rd
day, the biogas yield reached 20.17 ± 0.31 mL/g·TS−1. On the 4th day, the gas production rate obviously decreased
and then began to increase. The gas production peak appeared on the 8th day, and the gas production rate was
21.33 ± 0.36 mL/g·TS−1. After the 10th day, the daily gas production rate dropped to 4–7 mL/g·TS−1. From the
gas production conditions of the two experimental groups, it can be seen that the biogas production and daily
gas production efficiencies in the ZCS treatment group were significantly higher than those in the ZCK treat-
Scientific Reports | (2022) 12:6971 | https://doi.org/10.1038/s41598-022-10682-2 3
Vol.:(0123456789)
www.nature.com/scientificreports/
Figure 1. (a) Cumulative biogas production; (b) Change of biogas production per day.
ment group. The significant analysis was carried out on the changes of ZCK and ZCS daily biogas production,
the standard deviation was 366.3188, the t value was −2.698, P = 0.011, indicating that the addition of biochar
had a significant effect on the gas production efficiency of the anaerobic digestion system at the level of < 0.05.
Thus, biochar addition can effectively improve the buffering characteristics of the anaerobic digestion s ystem15.
After the 3rd day of starting the experiment, the biogas production rate of ZCK decreased obviously, which may
have been due to the increase of organic acid or ammonia–nitrogen concentration in the reaction system, which
caused a certain degree of inhibition.
The rated power of the reaction device is 6 kW in this study. The heating and straw carbonization time is
0.009 h. The amount of biochar prepared from 1 kg of rice straw is 320 g. The calorific value consumed in biochar
preparation thought to be an energy input is about 0.6 kJ/g. In terms of energy output, the anaerobic digestion
reactor is 1600mLwith the rice straw biochar dosage of 11.36 g. The biogas output was increased by 5818 mL,
with methane content of about 55%. According to the calorific value conversion, the productivity improvement
after biochar addition is about 9.58 kJ/g, and the input–output ratio is about 1:16.
Effects of rice biochar on physical and chemical indices of biogas slurry. The change trends of physical and chemi-
cal index curves of the ZCK and ZCS experimental groups were similar, but there was one major difference. As
can be seen in Fig. 2a and b, during anaerobic fermentation, the pH value changed from the initial 8. After the
start of the experiment, the pH value quickly decreased to 6.5 ± 0.3 and 6.9 ± 0.2, which may have been caused
by the transformation and degradation of numerous organic substances into small molecular organic acids. The
organic acid content increased from the initial 2410 mg/L to 2985 ± 108 mg/L and 3402 ± 194 mg/L, respectively.
However, as methanogenesis progressed, organic acid accumulation gradually decreased. After the 20th day of
anaerobic fermentation, the average organic acid content dropped to < 2000 mg/L and gradually stabilised at
around 1300 mg/L, whereas the average pH value increased from 7.5 and 7.9 on the 10th day to 9.16 and 9.33
on the 25th day, respectively. The higher pH value may have had a certain inhibitory effect on gas production.
Biochar is rich in alkaline-earth metal elements and mostly exists in the form of oxides, which may be the main
reason for the increase in the pH value of the anaerobic digestion solution26.
As shown in Fig. 2c, the initial COD concentrations of ZCK and ZCS were 8.65 ± 0.36 × 10⁴ mg/L and
8.55 ± 0.32 × 10⁴ mg/L, respectively. After anaerobic digestion began, the organic matter decomposed and the
COD concentration dropped rapidly. After the 5th day of anaerobic digestion, a small amount of molecu-
lar organic matter gradually accumulated, and the COD concentration gradually increased. On the 10th day,
the COD concentration reached the highest level of 9.43 ± 0.33 × 10⁴ mg/L in ZCS. Subsequently, the COD
concentrations in ZCK and ZCS began to gradually decrease, but the COD concentration in ZCS was sig-
nificantly higher than that in ZCK. The COD concentrations in ZCK and ZCS were 3.09 ± 0.42 × 10⁴ mg/L and
5.32 ± 0.49 × 10⁴ mg/L, respectively. As shown in Fig. 2d, with the start of the anaerobic digestion experiment,
the ammonia–nitrogen concentrations in ZCK and ZCS rapidly increased from approximately 1700 mg/L to
2361 ± 172 mg/L and 2146 ± 189 mg/L, respectively, on the 5th day and then began to show a gradual downward
trend. During the anaerobic digestion process, there was no obvious ammonia–nitrogen inhibition or toxic effect
on the methanogenic process27. After the 25th day, ammonia–nitrogen concentration in each experimental group
was basically stable between 1000 and 1250 mg/L, but the ammonia–nitrogen concentration in ZCS was slightly
higher than that in ZCK. On one hand, it may be due to the degradation of more small molecules of organic
matter, which released more ammonia–nitrogen; on the other hand, biochar may have adsorbed and degraded
ammonia–nitrogen, thereby showing an obvious effect, corroborating the findings of Shi et al.10.
Characterization of rice straw biochar. Electron microscopic observation and analysis before and after
anaerobic digestion. The structure of biochar particles before and after anaerobic digestion was observed using
scanning electron microscopy (SEM) under the magnification of 5000 times, 10,000 times and 20,000 times.
As can be seen in Fig. 3a–c, rice straw biochar had a porous structure, and the surface of microtubules became
Scientific Reports | (2022) 12:6971 | https://doi.org/10.1038/s41598-022-10682-2 4
Vol:.(1234567890)www.nature.com/scientificreports/
Figure 2. Changes in related physical and chemical indices of the anaerobic digestion system. (a) pH; (b)
organic acid concentration; (c) COD concentration; (d) ammonia–nitrogen concentration.
gradually rougher, which may be because cellulose, hemicellulose and lignin in the straw were decomposed and
carbonised. With the support destroyed, the tube wall began to decompose, which caused the biological struc-
ture of the biochar to c ollapse28, thereby forming numerous micropores. The pore diameters of some micropores
gradually became larger. At the same time, some fine particles accumulated on the surface of biochar, forming
rich groups. As shown in Fig. 3d–f, after anaerobic digestion, the porosity and roughness of the biochar mate-
rial obviously reduced and numerous cocci and microorganisms became attached to and agglomerated around
its surface and pores. With its porosity and large specific surface area, biochar can provide a better habitat for
microbial growth29,30.
Brunauer–Emmett–Teller analysis before and after anaerobic digestion. The specific surface area, average pore
diameter and total pore volume of ZCS before anaerobic digestion were 57.7016 m2/g, 2.7479 nm and 0.0396
cm3/g, respectively (Table 2). After adding to the anaerobic fermentation system, the specific surface area and
total pore volume decreased to 10.6685 m2/g and 0.0187 cm3/g, respectively, but the average pore diameter
increased to 7.0057 nm. The increase in average pore diameter, specific surface area and total pore volume may
be caused by the blockage of the pores of biochar by adsorbed materials. These include microorganisms as well as
small particles or colloids in the anaerobic fermentation system. Therefore, it can be seen that biochar anaerobic
digestion has good adsorption performance and that the pores of biochar are very likely to become shelter places
for microorganisms, which affects the abundance of microorganisms in the anaerobic digestion s ystem31,32, con-
sequently affecting the anaerobic efficiency.
Microbial study of biogas slurry. Analysis of alpha diversity. Venn diagrams of microorganisms. Alpha
diversity is the analysis of species diversity of a single sample, including the observed species, Chao1, Ace, Shan-
non, Simpson and coverage indices33–35. As shown in Fig. 4a and b, when the number of sample sequences was
greater than 10,000, the dilution curve index of bacteria and archaea tended to flatten and all the coverage rates
were higher than 0.999, which indicates that all biological populations in the sample were detected and that the
detection results truly reflected the actual situation of the biological populations in the sample.
According to Fig. 4c and d, 635 and 610 bacterial operational taxonomic units (OTUs) were detected in the
anaerobic fermentation systems without rice straw biochar (ZCK) and with rice straw biochar (ZCS), respec-
tively. There were 559 common OTUs, accounting for 88.03 and 91.64% of total OTUs in the system, respectively.
Therefore, although the flora of the two systems were different, the difference was not particularly significant.
Among them, 114 and 121 archaea OTUs were detected in the anaerobic fermentation systems without rice
Scientific Reports | (2022) 12:6971 | https://doi.org/10.1038/s41598-022-10682-2 5
Vol.:(0123456789)www.nature.com/scientificreports/
Figure 3. (a–c) Images of rice straw biochar magnified by 5,000 times, 10,000 times and 20,000 times under
a scanning electron microscope, respectively; (d–f) Images of rice straw biochar after anaerobic digestion
magnified by 5000 times, 10,000 times and 20,000 times under a scanning electron microscope, respectively.
Surface area/(m2/g) Adsorption average pore diameter (nm) Single-point adsorption total pore volume (cm3/g)
CS 57.7016 2.7479 0.0396
ZCS 10.6685 7.0057 0.0187
Table 2. Brunauer–Emmett–Teller analysis of biochar before and after anaerobic digestion.
straw biochar (ZCK) and with rice straw biochar (ZCS), respectively. There were 93 OTUs in total, accounting
for 81.58 and 76.86% of the system, respectively. Therefore, there were no substantial differences between the
bacterial flora of the two systems, but there was a significant difference between the archaea.
The Chao1, Shannon and Ace indices of the ZCK bacterial community were higher than those of the ZCS
bacterial community (Table 3). According to the changes in the Chao1, Ace and Shannon indices, the ZC sam-
ple had the richest bacterial community; that is, the diversity of the bacterial community was the highest in
ZC, followed by ZCK (without rice straw biochar). The bacterial diversity in ZCS was the lowest. For archaea,
the order of the Chao1, Shannon and Ace indices was ZC > ZCS > ZCK. Accordingly, archaeal species were the
most abundant in ZC, followed by ZCS. Archaeal diversity was the lowest in ZCK. That is, archaeal diversity in
the anaerobic fermentation inoculum was the highest, which decreased following inoculation in the anaerobic
system. The Simpson index of archaea and bacteria in ZCS was the lowest, indicating that biochar addition can
increase the relative abundance of dominant flora in the system. The addition of biochar mainly affects the suc-
cession of archaea.
After the addition of biochar into the anaerobic system, the pores of biochar can provide a shelter for organ-
isms. At the same time, active sites, such as OH and –COOH, can participate in buffering the pH of the system,
affect the amount of ammonia–nitrogen in the system and continuously provide small molecular organic acids
for microbial metabolism in the system. For example, the values of pH, COD, ammonia–nitrogen and small
molecular organic acids in the system without biochar after 25 days and 35 days of fermentation were 9.16,
4.57 × 10⁴, 1.11 × 10³ and 1.18 × 10³ and 8.83, 3.09 × 10⁴, 1.10 × 10³ and 1.29 × 10⁴ mg/kg, respectively. Except for
ammonia–nitrogen, the concentrations of other organic acids, as evidenced by the values of pH, COD and small
molecular organic acids, changed the living environment of the flora, and the anaerobic system gradually pro-
vided less organic matter, thereby affecting the abundance of the ancient flora. However, after biochar addition,
Scientific Reports | (2022) 12:6971 | https://doi.org/10.1038/s41598-022-10682-2 6
Vol:.(1234567890)www.nature.com/scientificreports/
160
800
140
120
600 100
80 ZC
value
value
ZC ZCK
400 ZCK 60 ZCS
ZCS
40
200 20
0
0 -20
-10000 0 10000 20000 30000 40000 50000 60000 70000 80000 -10000 0 10000 20000 30000 40000 50000 60000 70000 80000
numsampled numsampled
(a) (b)
(c) (d)
Figure 4. (a) Bacterial dilution curve; (b) Archaea dilution curve; (c) Venn diagram of bacteria; (d) Venn
diagram of archaea.
Sample ID Feature ACE Chao1 Simpson Shannon Coverage
ZC 806 877.8809 895.7581 0.9704 6.7738 0.9985
Bacteria ZCK 635 691.4345 722.7778 0.9756 6.7703 0.9989
ZCS 610 652.5486 659.1333 0.9622 6.3684 0.9991
ZC 144 149.1929 155.25 0.8897 4.0262 0.9999
Archaea ZCK 114 120.0228 121.3333 0.8805 3.6611 0.9998
ZCS 121 126.695 132 0.8678 3.6915 0.9999
Table 3. Changes in biodiversity indices.
the values of pH, COD, ammonia–nitrogen and small molecular organic acids at the peak of gas production
and end of anaerobic process were 9.33, 5.84 × 10⁴, 1.07 × 10³ and 1.34 × 10³ and 9.36, 5.32 × 10⁴, 1.24 × 10³ and
1.33 × 10⁴ mg/kg, respectively. Except for the large change in the ammonia–nitrogen concentration, the values of
pH, COD and small molecular organic acids remained relatively stable, which could affect the ammonia–nitro-
gen concentration in the anaerobic system, forming a good and stable living environment for ancient flora and
consequently affecting its abundance.
Flora species analysis. As shown in Fig. 5a, in the anaerobic fermentation system of the experimental group
without biochar (ZCK), there were eight dominant phyla (relative abundance ≥ 1%), namely Firmicutes (56.64%),
Bacteroidetes (23.37%), Tenericutes (4.60%), Synergistetes (2.67%), Spirochaetes (2.341%), Chloroflexi (2.95%),
Proteobacteria (1.533%) and Acidobacteria (1.16%). In the anaerobic fermentation system with rice straw bio-
Scientific Reports | (2022) 12:6971 | https://doi.org/10.1038/s41598-022-10682-2 7
Vol.:(0123456789)www.nature.com/scientificreports/
1.0
1.0
0.9
Unassigned
0.8 Others Unassigned
0.8 Others
Fibrobacteres
Relative abundance
Relative abundance
0.7 Cloacimonetes Fastidiosipila
Acidobacteria uncultured_bacterium_f_ST-12K33
0.6 Proteobacteria 0.6 uncultured_bacterium_o_Izimaplasmatales
Chloroflexi Ruminiclostridium_1
0.5 Spirochaetes Sedimentibacter
Synergistetes Caldicoprobacter
0.4 0.4 uncultured_bacterium_f_Ruminococcaceae
Tenericutes
Bacteroidetes uncultured_bacterium_f_Bacteroidales_UCG-001
0.3 DMER64
Firmicutes
uncultured_bacterium_o_MBA03
0.2 0.2
0.1
0.0 0.0
ZC ZCK ZCS ZC ZCK ZCS
(a) Sample (b) Samples
1.0 1.0
Unassigned
0.8 Others 0.8 Unassigned
Relative abundance
Relative abundance
Kiritimatiellaeota Others
Acidobacteria RumEn_M2
Patescibacteria Methanospirillum
0.6 0.6
Firmicutes Candidatus_Methanofastidiosum
Planctomycetes Methanomassiliicoccus
Lentisphaerae Methanocorpusculum
0.4 Cloacimonetes 0.4 Methanosaeta
Verrucomicrobia Methanoculleus
Crenarchaeota Candidatus_Cloacimonas
0.2 Euryarchaeota bacterium_enrichment_culture_clone_R4-41B
0.2
uncultured_bacterium_c_Bathyarchaeia
0.0
ZC ZCK ZCS 0.0
ZC ZCK ZCS
(c) Samples (d)
Samples
Figure 5. Flora species analysis (a) Phyla analysis of bacterial flora species; (b) Genera analysis of bacterial flora
species; (c) Phyla analysis of archaea flora species; (d) Genera analysis of archaea flora species.
char (ZCS), there were six dominant phyla (relative abundance ≥ 1%), namely Firmicutes (60.72%), Bacteroidetes
(24.97%), Tenericutes (4.64%), Synergistetes (3.03%), Chloroflexi (1.39%) and Proteobacteria (1.57%). Acidobacte-
ria (0.18%) and Spirochaetes (0.74%) lost their dominant phylum. Therefore, the addition of biochar can increase
the relative abundance of Firmicutes, Bacteroidetes, Tenericutes, Synergistetes and Proteobacteria. Studies have
shown that Firmicutes, Bacteroidetes, Synergistetes and Proteobacteria are related to the degradation and utilisa-
tion of polymeric organic matter, such as lignocellulose, protein and f at36–38.
As shown in Fig. 5b, at the bacterial genus level, the relative abundances of uncultured_bacterium_o_MBA0,
DMER64, Sedimentibacter, Ruminiclostridium_1, uncultured_bacterium_f_Ruminococcaceae, uncultured_
bacterium_o_Izimaplasmatales, Caldicoprobacter, uncultured_bacterium_f_Bacteroidales_UCG-001, uncul-
tured_bacterium_f_ST-12K33 and Fastidiosipila were among the top 10 in the 2 treatment systems. In ZCS,
only the relative abundances of uncultured_bacterium_o_Izimaplasmatales and Caldicoprobacter decreased by
42.9 and 54.8%, respectively, compared with that of ZCK. The relative abundances of other bacteria increased
to varying degrees, and Sedimentibacter showed the largest increase, reaching 85.6%, followed by unguarded_
bacteria_f_ST-12k33, with an increase of 45.1%, and unguarded_bacteria_o_mba03, with an increase of 44.2%.
Ruminiclostridium_1 showed the smallest increase (0.26%).
As shown in Fig. 5c, at the level of archaeophyta, Euryarchaeota, Crenarchaeota, Verrucomicrobia and Cloaci-
monetes were the dominant phyla in both ZCK and ZCS (relative abundance ≥ 1%). After biochar addition, the
relative abundances of Euryarchaeota and Cloacimonetes decreased from 40.33 and 13.31% to 34.78 and 7.46%,
respectively, whereas those of Crenarchaeota and Verrucomicrobia increased from 23.37 and 8.18% to 41.45 and
13.38%, respectively.
Scientific Reports | (2022) 12:6971 | https://doi.org/10.1038/s41598-022-10682-2 8
Vol:.(1234567890)www.nature.com/scientificreports/
As shown in Fig. 5d, at the level of archaea, the top 10 archaea in terms of relative abundance were uncul-
tured_bacterium_c_Bathyarchaeia (12.94–41.45%), bacterium_enrichment_culture_clone_R4-41B (7.96–23.35%),
Candidatus_Cloacimonas (7.05–15.16%), Methanoculleus39 (8.76–13.98%), Methanosaeta40,41 (4.84–16.91%),
Methanocorpusculum42 (0.26–5.44%), Methanomassiliicoccus43 (1.68–2.95%), Candidatus_Methanofastidiosum
(1.46–2.63%), Methanospirillum 41 (1.87–2.58%) and RumEn_M2 (1.26–2.11%). They were all related to the
process of methane production. Among them, the relative abundances of the archaea Candidatus_Cloacimonas,
Methanosaeta and Methanocorpusculum in ZCS were 43.87, 71.39 and 19.85% lower than that in ZCK, respec-
tively. The abundance of other archaeal genera in ZCS increased, among which that of Methanomassiliicoccus
increased the most (71.81%), followed by Bacillus_enrichment_culture_clone_R4-41b (62.17%), Methanoculleus
(59.6%) and Methanospirillum (8.13%). Therefore, biochar addition can inhibit the metabolic pathway of acetic
acid production.
Biochar material has rich specific surface area and hydrophobicity and can be used as an electronic pipeline
to provide better electronic conductivity, which can enhance the ability of electronic transmission among micro-
organisms. According to the change of microbial flora in anaerobic digestion system, the relative abundance of
Methanomassiliicocus and Methanoculleus in ZCS increased by 71.81 and 59.6% than that in ZCK respectively.
It is proclaimed that Methanomassiliicocus and Methanoculleus can secrete hyphae or cytochrome Omcs44,45, so
that carbon dioxide can be reduced to methane by electron through DIET. In addition, the relative abundance of
Methanospirillum in ZCS had a relatively small increase of 8.13% than in ZCK. Methanospirillum is a hydrogen-
trophic methanogenic bacterium. According to some s tudies46, Methanospirillum can secrete conductive hyphae
and form a symbiotic microorganism with Syntrophomonas as an electron donor to form DIET(direct inter-
species electron transfer), then promoting anaerobic digestion efficiency. Methanosaeta is a typical acetotrophic
methanogen and can metabolize acetic acid or ethanol through interspecific electron transfer. However, the rela-
tive abundance of methanogens in ZCS decreased greatly by 71.39% than in ZCK. It indicates the methanogenic
pathway of acetic acid was severely blocked in ZCS anaerobic digestion system. Therefore, adding rice straw
biochar material can effectively improve the abundance of hydrogen-producing trophic methanogenic bacteria
in anaerobic digestion system and promote direct inter-species electron transfer.
Notes on microbial functions. Kyoto Encyclopedia of Genes and Genomes (KEGG) data can be used to explore
the functions of the bacterial community and main functional p roteins47,48. As shown in Fig. 6a and b, approxi-
mately 78.44–78.50% functions belonged to 12 metabolic pathways in the metabolism group and 5.54–5.64%
belonged to 3 metabolic pathways in environmental information processing: membrane transport, signal trans-
duction and signalling molecules and interaction. Further, 1.98–2.03% functional proteins belonged to 11 meta-
bolic pathways in human diseases, 8.92–8.96% were related to 4 metabolic pathways in genetic information pro-
cessing, 3.56–3.52% of the functions were related to 3 metabolic pathways in cellular processes and 1.25–1.26%
of functional proteins belonged to 6 metabolic pathways in organismal systems. Therefore, the effect of rice straw
biochar on the function of bacterial flora was not obvious. The relative abundance of carbohydrate metabolism
in the metabolic group was the highest in ZCK and ZCS, accounting for 24.9% and 24.6% of the metabolism
group, respectively. Therefore, biochar can be said to inhibit carbohydrate metabolism in ZCS.
As shown in Fig. 6c, in ZCK and ZCS, bacterial communities with allelopathy were the most abundant, with
relative abundances of 42.89 and 47.08%, respectively, followed by the bacteria involved in anaerobic fermen-
tation, with relative abundances of 28.97 and 25.04%, respectively; 6.19 and 8.84% of bacterial communities
required oxidative heterotrophy, and 8.8 and 14.32% of the bacterial community participated in the degradation
of aromatic compounds, respectively. As rice biochar contains aromatic compounds, the addition of biochar
increases the relative abundance of bacterial communities that degrade and utilize aromatic compounds and
their intermediates, such as aromatic compound-degrading flora and chemoheterotrophic bacterial communities.
However, the addition of biochar inhibits the metabolic activities of bacteria involved in anaerobic fermentation.
The difference in nitrogen-fixing functional bacteria was the most significant among the differences between
the two anaerobic systems.
KEGG data can be used to explore the functions of the archaeal community and main functional proteins. As
shown in Fig. 7a and b, approximately 79.79–80.03% of the functions were related to 12 metabolic pathways in the
metabolism group and 3.80–3.87% were related to 3 metabolic pathways in environmental information process-
ing: membrane transport, signal transduction and signalling molecules and interaction. Notably, 2.19–2.29% of
functional proteins belonged to 12 metabolic pathways in human diseases, 1.44–11.68% belonged to 4 metabolic
pathways in genetic information processing, 1.44–1.45% of the functions were related to 4 metabolic pathways
in cellular processes and 1.03–11.03% of the functional proteins were involved in 9 kinds of metabolism in the
organismal systems group (KEGG diagram at level 1). The relative abundance of carbohydrate metabolism was
highest in the metabolic group in ZCK and ZCS, accounting for 11.2 and 11.4% of the metabolism group, respec-
tively. The relative abundance of genes involved in amino acid metabolism was 7.08 and 6.98%, respectively. After
biochar addition, the largest change was in the relative abundance of bacteria involved in glycan biosynthesis
and the metabolism pathway, with a decrease of 4.71%, followed by lipid metabolism, which increased by 4.26%
compared with the system without biochar addition. Therefore, biochar addition can inhibit glycine biosynthesis
and metabolism while promoting lipid metabolism (KEGG diagram at level 2).
As shown in Fig. 7c, in ZCK and ZCS, unlike bacteria, allelopathic archaeal communities were not the most
abundant. In ZCK, those with the top five relative abundances were hydrogenatophic_methanogenesis (29.06%),
chemohetrophy (17.5%), hydrogenatophic_methanogenesis (15.98%), methanogenesis_by_CO2_reduction_with_H2
(13.39%) and acetocratic_methodology (13.01%). In ZCS, those with the top five relative abundances were metha-
nogenesis (27.44%), hydrogenotrophic_methanogenesis (23.11%), methanogenesis_by_CO2_reduction_with_H2
(18.84%), chemoheterotrophy (10.66%) and methodology_by_reduction_of_methyl_compounds_with_H2 (4.27%).
Scientific Reports | (2022) 12:6971 | https://doi.org/10.1038/s41598-022-10682-2 9
Vol.:(0123456789)www.nature.com/scientificreports/
100
90
80 Environmental Information Processing
Genetic Information Processing
Relative abundance (%)
70
Cellular Processes
60 Human Diseases
Metabolism
50
Organismal Systems
40
30
20
10
0
ZCK ZCS
(a) Sample
Cancers: Overview
Infectious diseases: Viral
Infectious diseases: Parasitic
Infectious diseases: Bacterial
Substance dependence ZCS
Neurodegenerative diseases
Digestive system ZCK
Excretory system
Endocrine and metabolic diseases
Nervous system
Environmental adaptation
Circulatory system
Aging
Transport and catabolism
Cell growth and death
Signaling molecules and interaction
Endocrine system
Replication and repair
Function
Transcription
Folding, sorting and degradation
Cell motility
Cellular community - prokaryotes
Signal transduction
Membrane transport
Drug resistance: Antineoplastic
Drug resistance: Antimicrobial
Global and overview maps
Translation
Glycan biosynthesis and metabolism
Metabolism of other amino acids
Xenobiotics biodegradation and metabolism
Metabolism of terpenoids and polyketides
Biosynthesis of other secondary metabolites
Nucleotide metabolism
Amino acid metabolism
Energy metabolism
Metabolism of cofactors and vitamins
Lipid metabolism
Carbohydrate metabolism
(b) Relative abundance (%)
chemoheterotrophy
ureolysis
phototrophy
photoautotrophy
oxygenic_photoautotrophy
cyanobacteria
nitrogen_respiration
nitrate_reduction
nitrate_respiration
hydrocarbon_degradation
aromatic_compound_degradation
animal_parasites_or_symbionts
human_pathogens_all
human_pathogens_pneumonia
aerobic_chemoheterotrophy
Function
fermentation
manganese_oxidation
dark_oxidation_of_sulfur_compounds
dark_thiosulfate_oxidation
cellulolysis
nitrite_respiration
nitrogen_fixation
dark_hydrogen_oxidation
denitrification ZCS
nitrous_oxide_denitrification
nitrite_denitrification
ZCK
nitrate_denitrification
respiration_of_sulfur_compounds
sulfite_respiration
sulfate_respiration
methylotrophy
methanol_oxidation
0 10 20 30 40 50
(c) Relative abundance (%)
Figure 6. (a) Functional notes of bacteria KEGG at level 1; (b) Functional notes of bacteria KEGG at level 2; (c)
Fapotax diagram of bacteria.
Scientific Reports | (2022) 12:6971 | https://doi.org/10.1038/s41598-022-10682-2 10
Vol:.(1234567890)www.nature.com/scientificreports/
110
100
90 Organismal Systems
Cellular Processes
80 Environmental Information Processing
Relative abundance (%)
Human Diseases
70
Genetic Information Processing
60 Metabolism
50
40
30
20
10
0
ZCK ZCS
(a) Sample
Cardiovascular diseases
Immune diseases
Cancers: Specific types
Cancers: Overview
Infectious diseases: Viral
Infectious diseases: Parasitic
Infectious diseases: Bacterial
Substance dependence ZCS
Neurodegenerative diseases ZCK
Digestive system
Excretory system
Endocrine and metabolic diseases
Nervous system
Environmental adaptation
Immune system
Circulatory system
Aging
Transport and catabolism
Cell growth and death
Signaling molecules and interaction
Function
Endocrine system
Replication and repair
Transcription
Folding, sorting and degradation
Cell motility
Cellular community - prokaryotes
Signal transduction
Membrane transport
Drug resistance: Antineoplastic
Drug resistance: Antimicrobial
Global and overview maps
Translation
Glycan biosynthesis and metabolism
Metabolism of other amino acids
Xenobiotics biodegradation and metabolism
Metabolism of terpenoids and polyketides
Biosynthesis of other secondary metabolites
Nucleotide metabolism
Amino acid metabolism
Energy metabolism
Metabolism of cofactors and vitamins
Lipid metabolism
Carbohydrate metabolism
0 10 20 30 40
(b) Relative abundance (%)
chemoheterotrophy
intracellular_parasites
nitrogen_respiration
ZCS
nitrate_reduction
ZCK
animal_parasites_or_symbionts
mammal_gut
human_gut
aerobic_chemoheterotrophy
fermentation
nitrite_respiration
nitrogen_fixation
dark_hydrogen_oxidation
Function
anammox
nitrification
aerobic_nitrite_oxidation
aerobic_ammonia_oxidation
methylotrophy
methanogenesis
hydrogenotrophic_methanogenesis
methanogenesis_by_reduction_of_methyl_compounds_with_H2
methanogenesis_by_CO2_reduction_with_H2
methanogenesis_using_formate
methanogenesis_by_disproportionation_of_methyl_groups
acetoclastic_methanogenesis
0 5 10 15 20 25 30
(c) Relative abundance (%)
Figure 7. (a) Functional notes of archaea KEGG at level 1; (b) Functional notes of archaea KEGG at level 2; (c)
Fapotax diagram of archaea.
Scientific Reports | (2022) 12:6971 | https://doi.org/10.1038/s41598-022-10682-2 11
Vol.:(0123456789)www.nature.com/scientificreports/
In ZCS, the relative abundances of acetoclastic_methanogenesis, methylotrophy, methanogenesis_by_reduction_
of_methyl_compounds_with_H2, chemoheterotrophy, methanogenesis_by_CO2_reduction_with_H2, hydrogeno-
trophic_methanogenesis and methanogenesis changed by − 67.93, 64.94, 65.27, − 39.10, 40.62, 44.61 and − 5.57%,
respectively, compared with those of similar bacteria in ZCK. Therefore, biochar addition can reduce the relative
abundance of bacteria producing methane using acetic acid and increase the abundance of bacteria producing
methane using hydrogen, carbon dioxide and methanol as substrates. That is, biochar addition can change the
mechanism of methane production in the anaerobic system.
Discussion
According to research, the addition of rice straw biochar could impact the gas production significiently at 0.05
level (P = 0.011). The cumulative gas production of the group with rice straw biochar meanly increased by 13.58%
compared with the control group, and the maximum daily gas yield reached 22.59 ± 0.58 mL/g·TS−1. In addi-
tion, when rice biochar was added into the anaerobic digestion system, the start-up time was not significantly
shortened. However, biochar’s developed pore structure and rich alkaline-earth metal elements can improve the
pH value of anaerobic digestion solution to a certain extent, and have a good effect on the adsorption and deg-
radation of ammonia nitrogen, thus effectively improving the buffering capacity of anaerobic digestion system.
According to SEM and BET analysis, a large number of micropores formed on the surface of rice straw bio-
char provide a good habitat and shelter for microorganisms, which affected the abundance of microorganisms
in anaerobic digestion system. 16S rRNA gene sequencing analysis revealed that the addition of biochar could
affect the relative abundance of bacteria and archaea, particularly archaea. Additional enrichment and growth
of flora enhance the degradation of organic acids and ammonia–nitrogen in the anaerobic digestion system. The
addition of rice straw biochar could increase the relative abundances of Firmicutes, Bacteroidetes, Tenericutes,
Synergistetes and Proteobacteria, which are related to organic degradation. The relative abundance of Sedimen-
tibacter greatly increased, reaching 85.6%. Euryarchaeota, Crenarchaeota, Verrucomicrobia and Cloacimonetes
were the dominant archaea in ZCK and ZCS anaerobic fermentation systems. The relative abundances of the
ancient bacteria Candidatus_Cloacimonas, Methanosaeta and Methanocorpusculum decreased to varied degrees
in ZCS compared with ZCK.
Although the addition of rice straw biochar had no obvious effect on the function of bacterial flora, biochar
material, which has rich specific surface area and hydrophobicity, can be used as an electronic pipeline to provide
better electronic conductivity, thus enhancing the ability of electronic transmission among microorganisms. After
adding rice straw biochar, the aceticlastic methanogenesis in anaerobic digestion system was inhibited, and the
relative abundance of acetotrophic methanogen such as Methanosaeta decreased greatly. On the contrary, the
abundance of hydrotrophic methanogen such as Methanomassiliicocus and Methanoculleus increased signifi-
cantly, which effectively enhanced the direct inter-species electron transfer. Moerover, the rice straw biochar
could inhibit carbohydrate metabolism by bacteria and glycan biosynthesis and metabolism by archaea in the
anaerobic fermentation system, promote lipid metabolism by archaea and affect ammonia–nitrogen concentra-
tion in the system. Therefore, biochar addition could inhibit acetic acid production in the anaerobic fermentation
system and promote methane production based on hydrogen and carbon dioxide levels.
At present, the application of exogenous additives in the anaerobic digestion system has been widely studied.
Bentonite, zeolite, magnetite, nano and other materials can promote the attachment of m icroorganisms49,50, the
growth and enrichment of microorganisms. The metal elements and mineral salts contained in the materials can
also improve the stability of the anaerobic digestion system and the ability of electron conversion51. In addition,
adsorption materials can be used as carriers to load microbial agents or metal i ons52, which can further greatly
improve the anaerobic performance. In this study, straw biochar was used as an exogenous additive material.
Firstly, the raw material of straw biochar is cheap and easy access. Considering the impact on regional ecological
environment, most of the biogas residues and biogas slurry wastes produced by biogas production are returned
to the field for treatment. Biochar materials have good environmental protection properties, and can be returned
to the field with the biogas residues and biogas slurry, without increasing the risk of secondary pollution to the
regional environment. Thus, it has a broader application prospect.
The winter is long and cold in northern China, and straw biomass raw materials have been widely used to
provide energy for domestic heating in rural areas through technologies such as solidification molding and bun-
dling-based direct combustion. As a result, more biochar can be produced. On the one hand, the recent research
at home and abroad indicates that the use of biochar can increase exogenous soil organic carbon, enhance soil
carbon fixation capacity and reduce soil bulk density53. On the other hand, through this study, the utilization of
biochar is further expanded to improve the efficiency of gas production and the energy output benefit of straw
biomass utilization. Furthermore, the orderly returning of biogas residue and biogas slurry to the field can not
only improve the soil fertility, but also improve soil carbon sink to a certain extent, thus effectively promoting
the industrial chain of regional circular low-carbon agriculture development.
In view of the assumption of practical application in biogas engineering, under the situation of continuous
feeding and discharging and a large amount of feeding, it can be applied to the anaerobic digestion system with
high solid concentration in consideration of ensuring the mass transfer effect and avoiding the precipitation of
biochar. It is recommended to adopt commonly used anaerobic reactor such as CSTR and UASB. However, the
input of biochar material may increase the material viscosity of slurry in the reactor, and then cause negative
influences on slurry flow and stirring intensity in the reaction device. So it is necessary to further explore the
engineering process parameters. The biochar is attached to the reaction material, and will also be discharged
because of continuous discharge. To better ensure the density of dominant flora in the system, part of biochar
can be peeled off from biogas residue on the basis of technological methods exploration and then filled back into
the reactor in proportion to ensure the stable and efficient operation of biogas project.
Scientific Reports | (2022) 12:6971 | https://doi.org/10.1038/s41598-022-10682-2 12
Vol:.(1234567890)www.nature.com/scientificreports/
Received: 10 January 2022; Accepted: 11 April 2022
References
1. Tan, X. F. et al. Biochar as potential sustainable precursors for activated carbon production: Multiple applications in environmental
protection and energy storage. Bioresour. Technol. 227, 359–372. https://doi.org/10.1016/j.biortech.2016.12.083 (2017).
2. Shen, Y., Linville, J. L., Leon, I. D., Schoene, R. P. & Urgun-Demirtas, M. Towards a sustainable paradigm of waste-to-energy
process: Enhanced anaerobic digestion of sludge with woody biochar. J. Clean. Prod. 135, 1054–1064. https://doi.org/10.1016/j.
jclepro.2016.06.144 (2016).
3. Lehmann, L. et al. Biochar effects on soil biota - A review. Soil Biol. Biochem. 43(9), 1812–1836. https://doi.org/10.1016/j.soilbio.
2011.04.022 (2011).
4. Ahmad, M. et al. Biochar as a sorbent for contaminant management in soil and water: A review. Chemosphere 99, 19–33. https://
doi.org/10.1016/j.chemosphere.2013.10.071 (2014).
5. Liu, L. & Fan, S. Removal of cadmium in aqueous solution using wheat straw biochar: Effect of minerals and mechanism. Environ.
Sci. Pollut. Res. 25, 8688–8700. https://doi.org/10.1007/s11356-017-1189-2 (2018).
6. Yang, J., Pignatello, J. J., Pan, B. & Xing, B. Degradation of p-nitrophenol by lignin and cellulose chars: H2O2-mediated reaction
and direct reaction with the char. Environ. Sci. Technol. 51(16), 8972–8980. https://doi.org/10.1021/acs.est.7b01087 (2017).
7. Xu, X., Huang, H., Zhang, Y., Xu, Z. & Cao, X. Biochar as both electron donor and electron shuttle for the reduction transformation
of Cr (VI) during its sorption. Environ. Pollut. 244, 423–430. https://doi.org/10.1016/j.envpol.2018.10.068 (2019).
8. Ho, S. H. et al. High-efficiency removal of lead from wastewater by biochar derived from anaerobic digestion sludge. Bioresour.
Technol. 246, 142–149. https://doi.org/10.1016/j.biortech.2017.08.025 (2017).
9. Lu, J., Zhu, L., Hu, G. & Wu, J. Integrating animal manure-based bioenergy production with invasive species control: A case study
at Tongren Pig Farm in China. Biomass Bioenergy 34(6), 821–827. https://doi.org/10.1016/j.biombioe.2010.01.026 (2010).
10. Shi, X. Y., Wang, N., Chen, Q. D., Wu, H. N. & Xu, Q. Y. Mechanisms for enhancement of biogas generation from food waste
anaerobic digestion with biochar supplement. Chin. J. Environ. Eng. 12(11), 3204–3212 (2018).
11. Luo, C., Fan, L., Shao, L. & He, P. Application of eco-compatible biochar in anaerobic digestion to relieve acid stress and promote
the selective colonization of functional microbes. Water Res. 68, 710–718. https://doi.org/10.1016/j.watres.2014.10.052 (2015).
12. Pan, J. T. et al. Effects of different types of biochar on the anaerobic digestion of chicken manure. Bioresour. Technol. 275, 258–265.
https://doi.org/10.1016/j.boirtech.2018.12.068 (2019).
13. Xu, C. Y. et al. Effect of biochar pyrolyzed from wheat straws at different temperatures on biogas production characteristics of pig
manure during mesophilic digestion. J. Agro-Environ. Sci. 35(6), 1167–1172 (2016).
14. Zhao, H. Q. et al. Biochar enhanced biological nitrobenzene reduction with a mixed culture in anaerobic systems: Short-term and
long-term assessments. Chem. Eng. J. 351, 912–921. https://doi.org/10.1016/j.cej.2018.06.154 (2018).
15. Li, Q. et al. Biochar assisted thermophilic co-digestion of food waste and waste activated sludge under high feedstock to seed sludge
ratio in batch experiment. Bioresour. Technol. 249, 1009–1016. https://doi.org/10.1016/j.biortech.2017.11.002 (2017).
16. Cimon, C., Kadota, P. & Eskicioglu, C. Effect of biochar and wood ash amendment on biochemical methane production of waste-
water sludge from a temperature phase anaerobic digestion process. Bioresour. Technol. 297, 122440. https://doi.org/10.1016/j.
biortech.2019.122440 (2020).
17. Yang, Y., Zhang, Y., Li, Z., Quan, X. & Zhao, Z. Adding granular activated carbon into anaerobic sludge digestion to promote
methane production and sludge decomposition. J. Clean. Prod. 149, 1101–1108. https://doi.org/10.1016/j.jclepro.2017.02.156
(2017).
18. Lu, F., Luo, C. H., Shao, L. M. & He, P. J. Biochar alleviates combined stress of ammonium and acids by firstly enriching Metha-
nosaeta and then Methanosarcina. Water Res. 90, 34–43. https://doi.org/10.1016/j.waters.2015.12.029 (2016).
19. Lee, J. Y., Lee, S. H. & Park, H. D. Enrichment of specific electro-active microorganisms and enhancement of methane production
by adding granular activated carbon in anaerobic reactors. Bioresour. Technol. 205, 205–212. https://doi.org/10.1016/j.biortech.
2016.01.054 (2016).
20. Ma, J. Y. et al. Improving anaerobic digestion of chicken manure under optimized biochar supplementation strategies. Bioresour.
Technol. 325, 124697. https://doi.org/10.1016/j.biortech.2021.124697 (2021).
21. Duan, X. et al. New method for algae comprehensive utilization: algae-derived biochar enhances algae anaerobic fermentation for
short-chain fatty acids production. Bioresour. Technol. 289, 121637. https://doi.org/10.1016/j.biortech.2019.121637 (2019).
22. Li, Q. et al. Biochar and GAC intensify anaerobic phenol degradation via distinctive adsorption and conductive properties. J.
Hazard. Mater. 405, 124183. https://doi.org/10.1016/j.jhazmat.2020.124183 (2021).
23. Pan, J. T. et al. Achievements of biochar application for enhanced anaerobic digestion: A review. Bioresour. Technol. 292, 122058.
https://doi.org/10.1016/j.biortech.2019.122058 (2019).
24. Luo, J. Y. et al. Research progress on effects of carbonaceous materials on anaerobic digestion of organic wastes and underlying
mechanisms. J. Tongji Univ. (Natural Science) 49(12), 1701–1709 (2021).
25. Wang, S. et al. Optimizing the mixed anaerobic fermentation of biocarbon and cow dung using response surface methodology.
China Biogas 38(1), 19–24. https://doi.org/10.3969/j.issn.1000-1166.2020.01.004 (2020).
26. Wang, D. et al. Improving anaerobic digestion of easy-acidification substrates by promotiong buffering capacity using biochar
derived from vermicompost. Bioresour. Technol. 227, 286–296. https://doi.org/10.1016/j.biortech.2016.12.060 (2017).
27. Nielsen, H. B. & Angelidaki, I. Strategies for optimizing recovery of the biogas process following ammonia inhibition. Bioresour.
Technol. 99, 7995–8001. https://doi.org/10.1016/j.biortech.2008.03.049 (2008).
28. Essandoh, M., Wolgemuth, D., Pittman, C. U., Mohan, D. & Mlsna, T. Adsorption of metribuzin from aqueous solution using
magnetic and nonmagnetic sustainable low-cost biochar adsorbents. Environ. Sci. Pollut. Res. 24(5), 4577–4590. https://doi.org/
10.1007/s11356-016-8188-6 (2017).
29. Fagbohungbe, M. O. et al. Impact of biochar on the anaerobic digestion of citrus peel waste. Bioresour. Technol. 216, 142–149.
https://doi.org/10.1016/j.biortech.2016.04.106 (2016).
30. Nielsen, S. et al. Comparative analysis of the microbial communities in agricultural soil amended with enhanced biochars or
traditional fertilizers. Agric. Ecosyst. Environ. 191, 73–82. https://doi.org/10.1016/j.agee.2014.04.006 (2014).
31. Zhang, A. L., Li, X., Xing, J. & Xu, G. R. Adsorption of potentially toxic elements in water by modified biochar: A review. J. Environ.
Chem. Eng. 8(4), 104196. https://doi.org/10.1016/j.jece.2020.104196 (2020).
32. Khalid, Z. B., Siddique, M. N. I., Nayeem, A., Adyel, T. M. & Ibrahim, M. Z. Biochar application as sustainable precursors for
enhanced anaerobic digestion: A systematic Review. J. Environ. Chem. Eng. 9(15), 105489. https://doi.org/10.1016/j.jece.2021.
105489 (2021).
33. Sánchez, O. J., Loaiza, D. A. O. & Montoya, S. Compost supplementation with nutrients and microorganism in composting process.
Water Manag. 69, 136–153. https://doi.org/10.1016/j.wasman.2017.08.012 (2017).
34. Li, S. Q. & Xu, X. H. Effects of exogenous microbial inoculum on actinobacterial community structure during composting process.
Journal of Agricultural Biotechnology 23(5), 652–660. https://doi.org/10.3969/j.issn.1674-7968.2015.05.011 (2015).
35. Ding, J. L. et al. Succession of the bacterial community structure and functional prediction in two composting systems viewed
through metatranscriptomics. Bioresour. Technol. 313, 123688. https://doi.org/10.1016/j.biortech.2020.123688 (2020).
Scientific Reports | (2022) 12:6971 | https://doi.org/10.1038/s41598-022-10682-2 13
Vol.:(0123456789)You can also read