Insights of the Movements of the Jaguar in the Tropical Forests of Southern Mexico
←
→
Page content transcription
If your browser does not render page correctly, please read the page content below
Chapter 13
Insights of the Movements of the Jaguar
in the Tropical Forests of Southern Mexico

J. Antonio de la Torre and Marina Rivero

13.1     Introduction

Movement is a critical animal behavior which reflects the animal response to its
current biological needs and to its environment. Movement can maximize probabil-
ity of survival in animals, because it can ensure access to resources such as food and
water, the evasion of predators and competitors, and to find mates in reproduction
(Morales et al. 2010). Understanding how and why animals use the available space
and the underlying drivers of animal movements is essential to the management and
conservation for both the species and the ecosystems where they inhabit (Allen and
Singh 2016). The disruption of the natural patterns of animal movement can have
important implications for ecosystem dynamics and function, including distur-
bances to trophic chains and nutrients cycling process (Ning et al. 2016; Tucker
et al. 2018). Studies about movement ecology have grown in recent years with the
improvement of tracking devices and the analytical tools, and these had provided
unprecedented insights to understand where, when, and why the species move
across the landscapes (Cagnacci et al. 2010a, b; Tomkiewicz et al. 2010).
    Most apex predators in terrestrial ecosystems are facing dramatic population
declines and range reduction (Ripple et al. 2014, 2016; Treves and Bruskotter 2014).
Understanding the details of how these species move and use the space is essential
to develop and implement effective conservation plans to ensure their long-term

J. A. de la Torre ( )
Instituto de Ecología, UNAM, Laboratorio de Ecología y Conservación de Vertebrados
Terrestres, Ciudad de México, Mexico
Bioconciencia A.C., Ciudad de México, Mexico
e-mail: adelatorre@iecologia.unam.mx
M. Rivero
Bioconciencia A.C., Ciudad de México, Mexico
El Colegio de la Frontera Sur, Campeche, Campeche, Mexico

© Springer Nature Switzerland AG 2019                                                217
R. Reyna-Hurtado, C. A. Chapman (eds.), Movement Ecology of Neotropical
Forest Mammals, https://doi.org/10.1007/978-3-030-03463-4_13

                              adelatorre@iecologia.unam.mx
218                                                          J. A. de la Torre and M. Rivero

conservation (Chetkiewicz et al. 2006; Lehmann et al. 2008; Marker et al. 2008; de
la Torre et al. 2017a; Tucker et al. 2018). The jaguar (Panthera onca) is the largest
felid in the Neotropics and probably the least studied species of the Panthera genus
(de la Torre and Medellín 2011). Historically, jaguars ranged from southwestern
United States to central Argentina (Seymour 1989; Sanderson et al. 2002). However,
this species has been extirpated from more than half of its original range over the
last 100 years, and recent conservation assessments have concluded that jaguars are
declining in much of its remaining range (Swank and Teer 1989; Rabinowitz and
Zeller 2010; Medellín et al. 2016; de la Torre et al. 2018). Though the jaguar is not
endangered as the same level of the other species of large felids such as lions, tigers,
and snow leopards, the most current evaluations of the conservation status of this
species have shown that most of its populations are threatened (de la Torre et al.
2018). The jaguar currently is listed as Near Threatened by the IUCN Red List
(Quigley et al. 2017). However, fragmentation, habitat conversion, and poaching in
retaliation to cattle predation are severe threats for the species in most of its distribu-
tion range (Nowell and Jackson 1996; Sanderson et al. 2002; Haag et al. 2010;
Medellín et al. 2016; Quigley et al. 2017).
    Diverse factors determine the patterns of movement and space utilization of soli-
tary large felids such as the jaguar. For instance, home range sizes and patterns of
space use in these animals are usually determined by their body size (Gittleman and
Harvey 1982; Jetz et al. 2004; Carbone et al. 2005, 2007; Macdonald et al. 2010),
prey availability across the space and time (Herfindal et al. 2005; Odden and Wegge
2005; Marker et al. 2008; Schmidt 2008), habitat suitability (Spong 2002; Broomhall
et al. 2003; Conde et al. 2010), and sociality (Logan and Sweanor 2001; Azevedo and
Murray 2007; Cavalcanti and Gese 2009; Goodrich et al. 2010). Furthermore, other
factors such as interactions with other large carnivores can influence patterns of
space use in large felids (Scognamillo et al. 2003; Harmsen et al. 2009; Odden et al.
2010; Bhattarai and Kindlmann 2012; Noss et al. 2012; Foster et al. 2013). Landscape
configuration and connectivity are critical aspects that determine the space use in
large felids, as well (Colchero et al. 2009; Conde et al. 2010; de la Torre et al. 2017a).
    Due to its natural history and secretive behavior, studying the movements of
large felids is expensive and logistically challenging, especially in the tropical for-
ests. Only a few studies aimed at large felids in tropical forests have been able to
capture and monitor several individuals to give relevant conclusions (Rabinowitz
and Nottingham 1986; Jenny 1996; Karanth and Sunquist 2000; Ceballos et al.
2002; Odden and Wegge 2005; Nuñez 2006; Figueroa 2013; de la Torre et al.
2017b). Most of the former studies focused on evaluating jaguar spatial ecology
have tried to describe the home range areas and spatial organization (Schaller and
Crawshaw 1980; Rabinowitz and Nottingham Jr. 1986; Crawshaw and Quigley
1991; Ceballos et al. 2002; Cavalcanti and Gese 2009; Chávez 2009; Morato et al.
2016; de la Torre et al. 2017b) and jaguar habitat use (Conde et al. 2010; Cullen
et al. 2013; de la Torre et al. 2017a). Other aspects of jaguar movement ecology that
have been previously addressed are the assessment of their movement rates with
respect to different variables such as time of day, moon phases, sex, etc. (Cavalcanti
and Gese 2009; de la Torre et al. 2017b), as well as understanding the movement

                              adelatorre@iecologia.unam.mx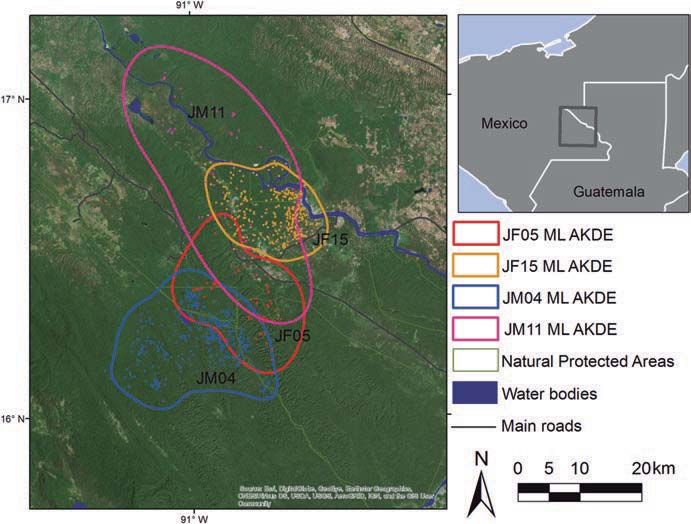
13 Insights of the Movements of the Jaguar in the Tropical Forests of Southern Mexico   219

decisions of jaguars in order to predict the most appropriate areas to maintain the
connectivity between populations or patches of suitable habitat (Colchero et al.
2011; de la Torre et al. 2017).
    With the aim to contribute in the knowledge of the spatial ecology of the jaguar
in the tropical forests, in this chapter we summarize all information that has been
obtained about the movements of this species for the Greater Lacandona Ecosystem,
Southern Mexico. This jaguar population is one of the most studied in Mexico (de
la Torre and Medellín 2011; de la Torre and Rivero 2017; de la Torre et al. 2017a, b;
Towns et al. 2017). Formerly, we published in different sources some information
related to movements of these jaguars tracked in this region. We analyzed these data
comparing the spatial ecology of jaguars and pumas in our study area with the aim
to compare the spatial requirements of these species in the tropical forest of Southern
Mexico (de la Torre et al. 2017b). Additionally, we identified the suitable habitat
and the functional corridors for jaguars to design a strategy to maintain connectivity
in the Southern Mayan Forest, which spans the border of Mexico and Guatemala (de
la Torre et al. 2017a). With this analysis we gave recommendations to decision-
makers in Mexico and Guatemala to invest in specific sites for conservation, man-
agement programs, and habitat restoration to ensure the long-term viability of the
jaguar population of the Mayan Forest (de la Torre et al. 2017a).
    In order to explore other aspects of the movement ecology of jaguars in tropical
forests, this chapter had the following objectives: (1) to evaluate jaguar home range
sizes and movement rates in the tropical rainforests of Southern Mexico using new
methods; (2) to evaluate the periodicity of jaguar movement, analyzing the fre-
quency and the intensity with which they visit certain sites within their home range;
and (3) to evaluate movement decisions of jaguars across different landscape fea-
tures. The questions that we intended to answer are: (1) How do the jaguars use the
space within their home range area in the Southern Mexico? and (2) Does the land-
scape configuration influence the behavior and movement patterns of jaguars? We
expect that this analysis help to improve the understanding of the movement ecol-
ogy of jaguars in tropical forests and increase the knowledge of this species to
advance in its conservation throughout the tropical forest of Central America.

13.2     Methods

13.2.1     Study Area

Our study area was located in the Greater Lacandona Ecosystem in southeastern
Mexico. This region contains the largest remaining portion of tropical humid rain-
forest in Mexico and is considered one of the most biodiverse regions of the country.
The Greater Lacandona Ecosystem is part of what is called the “Mayan Forest,” a
trinational forest shared by Mexico, Guatemala, and Belize that holds important
cultural and natural associations (Medellín 1994; de la Torre and Medellín 2011).
The Mayan Forest is crucial for the conservation of different species of large

                              adelatorre@iecologia.unam.mx
220 J. A. de la Torre and M. Rivero
wildlife, because it is one of the few landscapes in Mesoamerica that is large enough
to maintain viable populations of large mammals such as jaguars, white-lipped pec-
caries (Tayassu pecari), and Baird’s tapirs (Tapirus bairdii) (March 1993; Medellín
1994; Matola et al. 1997; Sanderson et al. 2002; Naranjo et al. 2015; Reyna-Hurtado
et al. 2017). Despite its importance for the conservation of numerous species, the
Greater Lacandona Ecosystem continues to be subjected to anthropogenic destruc-
tion. Of its original 1,500,000 ha of rainforest, 2/3 has been lost due to human
impact in the past 40 years (Mendoza and Dirzo 1999; Jong et al. 2000). The main
threats for this ecosystem are the rapid growth of human populations, deforestation,
unregulated extraction of flora and fauna, and the illegal use and extraction of natu-
ral resources from nature reserves (Medellín 1994; Davis et al. 1997; Mendoza and
Dirzo 1999).
There are seven natural protected areas within the Greater Lacandona Ecosystem.
These cover the largest forested areas of this region: Montes Azules (3312 km2),
Lacantún (619 km2), Bonampak (48 km2), Yaxchilán (26 km2), Chan-kin (122 km2),
Naha (38 km2), and Metzabok (33 km2). Our study area was located in the north of
Greater Lacandona Ecosystem and covered approximately 2500 km2, including
Yaxchilán (Usumacinta River as the border with Guatemala on the north),
Bonampak, Lacantún, and Montes Azules Natural Protected Areas (Fig. 13.1). The
study area also encompassed the Sierra la Cojolita, a tract of natural habitat in the
Fig. 13.1 Location of our study area and home ranges of jaguars in Southern Mexico using the
autocorrelated kernel density estimation
adelatorre@iecologia.unam.mx13 Insights of the Movements of the Jaguar in the Tropical Forests of Southern Mexico 221
north of Greater Lacandona Ecosystem that is protected by local communities.
Three indigenous communities inhabit the Mexican part of our study area: Lacanja
Chansayab (~1000 people), Nueva Palestina (~20,000), and Frontera Corozal
(~15,000). The main economic activities in this region include ranching, farming,
and ecological and archeological tourism. Thus, the landscape outside the protected
areas is composed of a matrix of primary forest surrounded by secondary forest,
agricultural fields, and managed grasslands for livestock. The climate is hot (mean
of 25 °C), and the mean rainfall per year is 2800 mm, with the greatest concentra-
tion in June–September and the lowest in March–April (reviewed by O’Brien 1998).
Among the species that potentially are important prey for jaguars in the area are
collared peccary (Pecari tajacu), white-lipped peccary, the brocket deer (Mazama
temama), white-tailed deer (Odocoileus virginianus), agouti (Cuniculus paca), paca
(Dasyprocta punctata), and the nine-banded armadillo (Dasypus novemcinctus).
Our field base camps to implement this study were located in the community of
Lacanja Chansayab and in the CONANP (National Commission of Natural Protected
Areas) field station at Yaxchilán Natural Protected Area.
13.2.2 Data Collection
We captured jaguars using foot snares (Frank et al. 2003). To respond immediately
to any animal capture, we also placed a VHF radio transmitter at the site of each
snare trap to monitor if traps were triggered (Halstead et al. 1995). We checked the
traps 4 h throughout the night and, depending on weather conditions, several times
during the day. We conducted three trapping seasons, one in Bonampak (November
2011 to January 2012) and two in Yaxchilán (July to September 2012 and February
to April 2013). In Bonampak, we covered an area of approximately 60 km2 with foot
snares, and in Yaxchilán we covered an area of 25 km2. We used 8–15 foot snares
during each trapping day. All capture and handling protocols followed the
Institutional Animal Care and Use Committees guidelines approved by the American
Society of Mammalogists (Sikes et al. 2011).
Upon capture, we immobilized jaguars using medetomidine (0.08 mg/kg) com-
bined with ketamine (5 mg/kg) using a dart fired from a CO2 pistol or rifle. While
immobilized, we examined individual body condition and determined sex. We esti-
mated age based on coat color, tooth wear (Stander 1997), and gum-line recession
(Laundré et al. 2000). Body mass and linear measurements were recorded (de la
Torre and Rivero 2017). Weight was recorded using a portable scale.
Captured jaguars were fitted with a satellite GPS collar (Telonics®, GEN IV,
model TGW-4580). This model included a component for sending information
through the ARGOS satellite system. We programmed the global positioning sys-
tem collars to acquire a location every 4.8 h (four locations/day) and to send data
packets through the ARGOS system every 4 days. All collars included a program-
mable release mechanism (model CR-2a, Telonics®), and we scheduled the release
of the collars 12–14 months after jaguars were captured. The collars were recov-
adelatorre@iecologia.unam.mx222 J. A. de la Torre and M. Rivero
ered, when possible, using the locations obtained after their release through the
ARGOS system and searching the VHF pulses using a receiver (model TR4,
Telonics®) and antennas of two and three elements (models RA23K and RA3,
Telonics®). For all analyses, we used only the 3D GPS fixes that we obtained from
collared animals that were calculated from four or more GPS satellites that provided
a location estimate with a typical accuracy of 2–10 m.
Our trapping capture rate of jaguars was 2.5 captures per 1000 trap night (total
trapping effort = 1,934 trap nights). We captured three females and two males. The
female jaguars weighted in average 34.3 ± 1.5 kg and the males 52.5 ± 3.5 kg (de la
Torre and Rivero 2017). We successfully deployed satellite global positioning sys-
tem collars on these five jaguars. A total of 1134 3D GPS fixes were obtained from
the collared animals and mean horizontal error was 5.01 ± 4.61 m. However, the fix
success of the GPS collars was very low for most of the jaguars probably due to the
closed forest canopy, since other studies (Gitzen et al. 2013; Camp et al. 2016) have
shown that the performance of the GPS radio collars devices diminishes in tropical
forests with multiple canopy layers or in areas with steep terrain. Furthermore, we
only recovered three of the collars deployed (JF12, JF15, and JM04), and we could
not recover one collar (JF05), because after the release mechanisms were activated,
we did not obtain fixes through the ARGOS satellite system to search for this collar.
We also never found it using the VHF signal in the field to search for this collar after
the release mechanism was activated. Additionally, we lost the signal of jaguar male
JM11 after 5 months of tracking through the ARGOS satellite system. Thus, data
shown for animals JF05 and JM11 corresponded only to data recovered through the
ARGOS satellite system (Table 13.1). We obtained a very few data of the female
jaguar JF12, because she was shot 20 days after the capture (Table 13.1).
Table 13.1 Movement parameters and home range sizes for the jaguars tracked in the Greater
Lacandona Ecosystem, southern Mexico
Home
range Average AKDE
Number crossing Velocity distance 95% (km2)
Animal Age days/ time autocorrelation traveled KDE (95%
ID Sex class Weight fixes (day) time scale (h) (km/day) (km2)CI)
JF05 ♀ Adult 34 331/88 9.9 1.65 (0.31–8.5) 7.2 211.6297.2
(3.6– (5.1–9.3) (163.4–
27.2) 470.4)
JF15 ♀ Adult 33 350/395 4.6 2.7(2.0–3.6) 6.9 198.8 203.4
(3.1–6.7) (6.3–7.5) (151.0–
263.4)
JM04 ♂ Adult 50 367/578 4.4 4.2 (3.4–5.1) 8.1 322.8 375.7
(3.2–5.9) (7.6–8.5) (294.8–
466.4)
JM11 ♂ Adult 55 133/72 4.7 5.2 (2.9–9.2) 9.6 581.9 714.1
(1.8– (8.2– (412.3–
12.2) 11.0) 1097.4)
Home ranges were estimated using 95% kernel density estimator (KDE) and autocorrelated kernel
density estimator (AKDE)
adelatorre@iecologia.unam.mx13 Insights of the Movements of the Jaguar in the Tropical Forests of Southern Mexico 223
13.3 Analysis
13.3.1 Home Range Sizes and Movement Rates of Jaguars
in Southern Mexico
One of the basic issues in the study of movement patterns of the wild animals is
to define the area used by individuals in its normal activities for food acquisition,
mating, and rearing progeny. This area is known as “home range” and generally
is estimated aggregating the telemetry locations to evaluate the total use of the
space by an animal (Powell and Mitchell 2012). To estimate home range sizes of
jaguars in the Greater Lacandona Ecosystem, we used continuous-time stochastic
movement models and the autocorrelated kernel density estimation (AKDE),
which allows more accurate home range estimation, even if the data are strongly
correlated. We calculated variograms, movement models, and estimated home
range sizes using the ctmm package of the statistical software R (R Core Team
2016). Using the command variogram, we plotted the estimated semi-variance
function for each animal to visually inspect the autocorrelation structure. We also
evaluate the residence of the individuals tracked using the variograms. We
expected that resident individuals reached an asymptote on timescale that roughly
corresponds to the home range crossing time, and individuals whose plotted semi-
variance did not reach an asymptote were not assumed to be home range residents
(Morato et al. 2016).
The ctmm package allows to fit several movement models and select the best that
describe the movement patterns of the individual studied. The ctmm package
includes four basic movement models: (1) Brown motion (BM), which is based on
the regular diffusion, where the velocities are uncorrelated and the space use is not
limited. This model is used for data where the time between locations is very broad
so it cannot reveal the autocorrelation velocity and too brief to show the residency
areas. (2) Ornstein-Uhlenbeck (OU) movement model is a combination between the
BM, but in this case the movement tends to remain in a certain area. The OU model
fit to data that has no evidence of directional persistence; nevertheless the use of
space is restricted. (3) Integrated OU (IOU) model is similar to BM in that it is a
process that diffuses continuously, but it has autocorrelated velocities in short time
scales. This model is better for data that show directional persistence, but the time
is not enough to show a range residency. Finally, the Ornstein-Uhlenbeck Foraging
(OUF) model is a combination between the OU and the IOU; this means that the
movement tends to have correlated velocities and restricted use of space. This model
is appropriated for data that has a very detail information to show velocity autocor-
relation and long enough to show range residency (Calabrese et al. 2016).
OU models are described by two parameters, which are home range crossing
time (days) and variance (km2), and it allows to estimate the home range and home
range crossing time, while the OUF models are described by three parameters which
are home range crossing time, velocity autocorrelation (hours), and variance (km2)
and allow to estimate home range, home range crossing time, velocity autocorrela-
adelatorre@iecologia.unam.mx224 J. A. de la Torre and M. Rivero
tion time scale, and average distance traveled for each individual. We fitted the
models using the function ctmm.fit, which use maximum likelihood, and we ranked
the models based on AICc using the function ctmm.select. We estimated the home
range based on the best fitted model for each individual using the function akde.
For comparative proposes, we estimated home ranges using conventional kernel
density estimators at 95% for each animal (Worton 1989). For this we also fit in the
ctmm the independent identically distributed (IID) model, which by definition
ignores autocorrelation in the data, and then we adjusted the fitted model to the akde
function. We compared our jaguar home range estimations with those obtained in
other studies. To compare the movement rates between female and male jaguars, we
used the distance average traveled by each individual estimated using the OUF
models (Morato et al. 2016).
13.4 Frequency and Intensity of Visits of Jaguars to Certain
Sites Within Home Ranges
Traditionally, the space use has been studied through classical kernel methods for
estimating the utilization distribution within an animal home range (Worton 1989).
These methods consider locations as static and independent points rather than a
movement process. However, the use of GPS radio tracking devices on wild animals
provides information of sequential and correlated localizations that can be used to
have a more dynamic approach to describe the space use and habitat selection. The
movement-based kernel approach incorporates movement information and consid-
ers the time spent between successive relocations to analyze the trajectories of the
individuals. This approach seeks to describe the intensity in which the individual
actively uses the habitat patches within its home range, rather than the simple area
occupied (Benhamou 2011; Benhamou and Riotte-Lambert 2012). Therefore, the
movement-based kernel approach is focused in estimating the utilization distribu-
tion (UD) and additionally considers that the intensity of the space use is propor-
tional to the activity time spent by unit area (Benhamou and Cornélis 2010).
The movement-based kernel approach can be analyzed under the biased random
bridge (BRB) model. This BRB method is based on the biased random walk model, and
its main characteristic is that it not only considers the diffusive movement but also
includes the advection component; this means that the model considers the drift between
successive relocations in the trajectory analysis (Benhamou 2011). Additionally, the
BRB model decomposes the use of space in two components, since it identifies the
areas that the animal might visit only once but stays for a long time, the intensity distri-
bution (ID), and the areas that the animal visits repeatedly, the recursion distribution
(RD), inside their home range. These components can be very helpful to understand
how the animals select and make use of space within their home range areas (Benhamou
and Cornélis 2010; Benhamou 2011; Benhamou and Riotte-Lambert 2012).
Using the BRB approach, we estimated the space use of two individuals of jag-
uar (JF15 and JM04) for our study area. We only used these individuals because
adelatorre@iecologia.unam.mx13 Insights of the Movements of the Jaguar in the Tropical Forests of Southern Mexico 225
they were the ones which we obtained a larger number of fixes. The analysis was
conducted using adehabitatHR (Calenge 2013a) of the statistical software R (R
Core Team 2016). To calculate the UD, ID, and RD, we first estimated the diffusion
coefficient (D) (Benhamou 2011). The D determines the smallest distance below
which we consider that the animal is not moving; for our data we used a maximum
time (Tmax) = 24 h and a minimum distance (Lmin) = 200 m to calculate D. The mini-
mum smoothing parameter hmin was set to 100 m, and the radius of circle (radius) of
the resident time and the number of visit used for the model was set to 1000 m (for
more description regarding the model, see Calenge 2013a). We defined up to 95%
cumulative frequency isopleths for UD, because it is better for analyzing the global
home range area use, and 30% of isopleth for the ID and RD, because we were
interested in identifying the highest density values for these distributions (inten-
sively exploited/repeatedly visited; Benhamou and Riotte-Lambert 2012).
13.5 Movement Decisions of Jaguars Across Different
Landscape Features
To understand how the landscape structure of our study area affects jaguar move-
ments, we analyzed the sequential locations obtained from the jaguars tracked in
our study using step selection functions (Fortin et al. 2005; Thurfjell et al. 2014;
Zióákowska et al. 2016). Step selection functions are relative new useful models for
studying resource selection by animals moving through the landscape, and these
compare environmental attributes of observed steps (the linear segment of two con-
secutives fixes) with alternative random steps taken from the same starting point.
This approach has been used to study habitat selection, human wildlife interactions,
movement corridors, and dispersal behaviors in carnivore and ungulate species
(Thurfjell et al. 2014). With the aim to evaluate how the landscape configuration of
the Greater Lacandona Ecosystem affects the movement decision of jaguars, we
compiled a geospatial dataset using a suite of environmental and anthropogenic
variables for our study area (Table 13.2). Then, for each observed step, we calcu-
lated its length (d) and turning angle (α) using the package “adehabitatLT” (Calenge
2013b) from R 3.1.1 (R Core Team 2016). Steps were divided into “active” and
“passive,” based on step length (Zióákowska et al. 2016), with all steps ≥500 m
constituting active steps. We only used the active steps for implementing the step
selection function analysis.
Each active step was paired with 100 control steps that shared the same starting
point but differed either in length, direction, or both. The length and turning angles
of control steps of a given individual jaguar were sampled from those observed of
the other individuals to avoid problems of circularity (Fortin et al. 2005). We used
the command “movement.ssfsamples” of the “Geospatial Modelling Environment”
package to generate the control steps (Beyer 2012). For each observed and control
adelatorre@iecologia.unam.mxTable 13.2 Landscape variables used to evaluate the potential habitat for jaguars in the Greater Lacandona Ecosystem through resource selection probability
226
functions
Type Variable name Abbreviation Description Units Justification
Forest cover Forest cover FCov-30 Percentage of forest % Jaguars in tropical forest are restricted mostly to areas of primary
30 m coverage around the forest where they find their natural prey and refuge (Rabinowitz and
pixel Nottingham 1986; Conde et al. 2010; Cullen et al. 2013). To appraise
Forest cover FCov-240 Percentage of forest % habitat quality, we used the high-resolution global forest map (Hansen
240 m coverage 240 m around et al. 2013). This dataset includes the extent of global tree cover
the pixel density, which is defined as vegetation higher than 5 m and is
Forest cover FCov-240 Percentage of forest % expressed as a percentage (Hansen et al. 2013). Given that habitat use
510 m coverage 510 m around and movement by jaguars might be limited by the amount of
the pixel surrounding forest, as it is by other large predator species (Beier 1995;
Dickson et al. 2005), we estimated forest cover in a neighborhood of
240 m (FCov-240) and 510 m (FCov-510) around each raster pixel
Terrain Topographic TPI Classification of – Jaguar habitat use and movement are affected by different terrain
position index landscape according to conditions. Jaguar mobility would be facilitated in areas of high
the slope position within topographic complexity, especially if the flat areas of suitable habitat
a different radius. This have been cleared (Dickson et al. 2005; Morato et al. 2014). However,
index incorporated jaguars are frequently associated with lowland areas, and jaguar
richness and evenness occupancy and movements would be hampered by the mountain
into a single measure ranges at higher altitudes (Rabinowitz and Nottingham 1986;
adelatorre@iecologia.unam.mx
Elevation ELE Elevation m.a.s.l. Rabinowitz and Zeller 2010; Zeller et al. 2011). Topographic position
Shannon SHAN Differences of ranges of – index was used to characterize the slope’s position in the terrain and
topographic elevation values within a landform. This index incorporated richness and evenness into a single
index different radius measure. Using a 30 m digital elevation model, we obtained elevation
ranges. Shannon index was used to evaluate differences in
heterogeneity for ruggedness. In general, higher values reflected more
diversity and a better balance among unique landform values (Riley
et al. 1999)
J. A. de la Torre and M. RiveroType Variable name Abbreviation Description Units Justification
Water runoffs Distance to DistW The minimum distance km Jaguars are known to use riparian habitats to move through landscapes
water courses to the nearest water and use sites with permanent water more frequently (Schaller and
runoff Vasconcelos 1978; Rabinowitz and Nottingham 1986; Emmons 1987;
Nuñez 2006). We constructed this raster using a layer of the
hydrological drainage system of the entire study area (Tapia and
Nuñez 2008)
Human Distance to DistT The minimum distance km Human activity affects habitat use by jaguars negatively due to
towns to the nearest town disturbance and persecution (Conde et al. 2010; Colchero et al. 2011;
Distance to DistR The minimum distance km Espinosa et al. 2018). Information of towns and roads was obtained
paved roads to the nearest paved from INEGI (Instituto Nacional de Estadistica e Informatica) for
roads Mexico and IGN-SEGLAPAN (Instituto Geográfico-Secretaria de
Distance to DistD The nearest distance to km Planificación y Programación de la Presidencia) for Guatemala. To
deforestation the deforested patch evaluate the distances that jaguars use from the boundaries that
edge >1 km2 separated the forest from open modified areas, we used a raster layer
with the minimum distance to the nearest deforested patches228 J. A. de la Torre and M. Rivero step, we calculated the exact values of the predictors covariables at the endpoint of steps (Thurfjell et al. 2014). We constructed step selection function models with the package “ResourceSelection” (Lele et al. 2014) from R 3.1.1 (R Core Team 2016) using a conditional regression with log link, which is adequate to construct this kind of models (Thurfjell et al. 2014). The step selection functions were fit using the observed steps matched to their respective control steps (Lele and Keim 2006; Northrup et al. 2013). We tested 54 step selection function models with different combinations of explanatory variables (Table 13.5). Then, we used the Akaike information criterion (AIC) to identify the best step selection function models (Burnham and Anderson 2002). We considered models comparable if ΔAIC was
13 Insights of the Movements of the Jaguar in the Tropical Forests of Southern Mexico      229

Table 13.3 Jaguar home range estimates (in km2) obtained from different studies using VHF and
GPS tracking techniques and the autocorrelated kernel density estimation (AKDE), kernel density
estimator (KDE), and minimum convex polygon (MCP). Also are included the countries, regions,
and habitat types
                         Habitat      Tracking Estimation
Study area   Country     type         technique method    Males      Females ♂/♀ References
Mexican      Mexico      Tropical     VHF       MCP        92.7      38.0 (4) 2.4 Nuñez
Pacific                  dry forest             100%      (2)                     (2006)
Calakmul     Mexico      Tropical     VHF       MCP        36.9      45.5 (2) 0.8 Ceballos
                         rainforest             100%      (2)                     et al. (2002)
Calakmul     Mexico      Tropical     GPS       Kernel    624.95     155.42 4.0 Chávez
                         rainforest             95%       (3)        (7)          (2009)
Lacandona    Mexico      Tropical     GPS       AKDE        544      250 (2) 2.3 This study
                         rainforest                       (2)
Center of Belize         Tropical     GPS       Kernel    264.3      169.3
                                                                        1.5 Figueroa
Belize                   rainforest             95%       (6)        (1)    (2016)
Cockscomb Belize         Tropical     VHF       MCP        34.4      10 (2)
                                                                        3.4 Rabinowitz
                         rainforest                       (4)               and
                                                                            Nottingham
                                                                            (1986)
Los Llanos Venezuela Tropical VHF               MCP       130  49 (2)   2.6 Scognamillo
                     savannas                           (1)                 et al. (2003)
Dry Chaco Paraguay Tropical GPS                 AKDE    727(5) 255 (2) 2.8 McBride
                     dry forest                                             and
                                                                            Thompson
                                                                            (2018)
Humid        Paraguay    Tropical     GPS       AKDE    818(4) 237 (8) 3.4 McBride
Chaco                    savannas                                           and
                                                                            Thompson
                                                                            (2018)
Amazon       Brazil      Tropical     GPS       AKDE      211  68 (6)   3.1 Morato
                         rainforest                     (4)                 et al. (2016)
Cerrado      Brazil      Tropical     GPS       AKDE    1268     –       – Morato
                         savannas                                           et al. (2016)
Cerrado      Brazil      Tropical     VHF       MCP 80% 265    228 (1) 1.1 Silveira
                         savannas                       (1)                 (2004)
Atlantic     Brazil      Tropical     GPS       AKDE      462  268 (5) 1.7 Morato
Forest                   rainforest                     (5)                 et al. (2016)
Pantanal     Brazil      Tropical     GPS       AKDE      144  52 (10) 2.7 Morato
                         savannas                       (6)                 et al. (2016)
Pantanal     Brazil      Tropical     GPS       Kernel    154  62.5 (4) 2.4 Cavalcanti
                         savannas               95%     (6)                 and Gese
                                                                            (2009)
Pantanal     Brazil      Tropical     VHF       Kernel   67.3  38.2 (5) 1.7 Azevedo
                         savannas               95%     (3)                 and Murray
                                                                            (2007)
Pantanal     Brazil      Tropical     VHF       MCP     152.4 139.5     1.1 Crawshaw
                         savannas               100%    (1)    (4)          and Quigley
                                                                            (1991)
Pantanal     Brazil      Tropical     VHF       MCP     80 (1) 31.5 (2) 2.5 Schaller and
                         savannas               100%                        Crawshaw
                                                                            (1980)

                               adelatorre@iecologia.unam.mx
230 J. A. de la Torre and M. Rivero
can spend several days feeding of a carcass of a large prey and they can stay around
killing sites from 1 to 21 days (Cavalcanti and Gese 2010). In Figs. 13.2 and 13.3 is
shown the intensity distribution of both animals using an isopleth of 30%. This
intensity distribution at 30% of isopleth covered 23 km2 for the female jaguar JF15
and 40 km2 in the male jaguar JM04.
On the other hand, areas frequently visited might be associated with refuge areas
or areas used frequently as foraging sites. Contrasting the recursion utilization at
30% of isopleth with the core areas estimated through 50% fixed kernel (utilization
distribution), we observed that these areas were very similar in both individuals.
Fig. 13.2 Home range polygons obtained using the biased random bridge model for the jaguar
female JH15. (a) Locations and trajectories obtained from the individual followed by the GPS col-
lar. (b) Utilization distribution using an isopleth of 95%. (c) Intensity distribution using an isopleth
of 30%. (d) Recursion distribution using an isopleth of 30%
adelatorre@iecologia.unam.mx13 Insights of the Movements of the Jaguar in the Tropical Forests of Southern Mexico 231
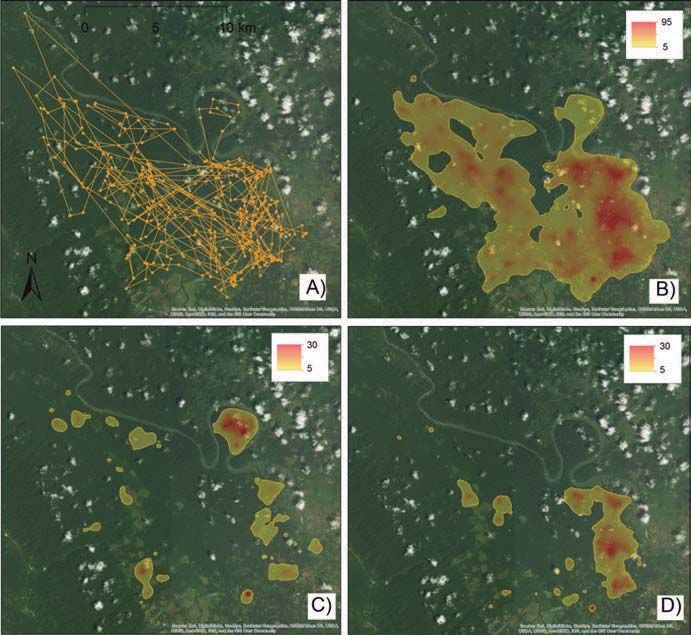
Fig. 13.3 Home range polygons obtained using the biased random bridge model for the jaguar
male JM04. (a) Locations and trajectories obtained from the individual followed by the GPS collar.
(b) Utilization distribution using an isopleth of 95%. (c) Intensity distribution using an isopleth of
30%. (d) Recursion distribution using an isopleth of 30%
13.6.3 Movement Decisions of Jaguars Across Different
Landscape Features
We analyzed a total of 452 movement steps, of which 43.5% were classified as
active. Our best step selection function model included the forest cover in a neigh-
borhood of 240 m (FCov-240), the TPI, and elevation (ELEV) as the variables asso-
ciated most strongly with movement probability by jaguars in the Greater Lacandona
Ecosystem landscape (Table 13.4). For this model all the variables were informa-
tive, and the 95% CI did not overlap 0 (Table 13.4). However, this model only had
a ΔAIC value of 0.54 for the second best ranked model (Table 13.5). This second
ranked model included the same variables than the first ranked one but as well
including the nearest distance to deforested patches that were >1 km2 (DistD)
adelatorre@iecologia.unam.mx232 J. A. de la Torre and M. Rivero Table 13.4 Estimated coefficients (β), standard errors (SE), 95% confidence intervals (95% CI), z values (z), and P values (P) for the best step selection functions for movements of jaguars in the Southern Mayan Forest Covariate β SE 95% CI z P FCov-240 0.0335 0.0079 0.0199 to 0.0527 4.241
13 Insights of the Movements of the Jaguar in the Tropical Forests of Southern Mexico   233

in this ecosystem type. On the other hand, it appears that in other kinds of ecosys-
tems such as tropical savannas, such as in the Pantanal, Brazil, jaguars use smaller
home ranges than in the tropical rainforests (Table 13.3).
    Contrasting the home range sizes between sexes, male jaguars had 2.1 times
larger home range than those of female jaguars. Jaguars, as most of the felid species,
are solitary except for periods of mating and breeding. Usually, females have smaller
home ranges than males, and the home ranges of males include and overlap with the
home ranges of several females (Schaller and Crawshaw 1980; Rabinowitz and
Nottingham Jr. 1986; Cavalcanti and Gese 2009). Home ranges of females are
shaped by the abundance and distribution of prey, which is critical to meet the ener-
getic requirements that raising cubs demands (Eisenberg 1986; Sandell 1989; Logan
and Sweanor 2001). Another factor that determines space use in solitary female
felids is the availability of safe refuges for offspring (Nuñez 2006; Steyn and
Funston 2009). Larger home ranges of males are determined by the spatial distribu-
tion of females and have to be large enough to cover several females to increase
mating opportunities. Other factor that determines the space in males is defending
their territory from other males, which would compete for the mates or would kill
their cubs (Eisenberg 1986; Cavalcanti and Gese 2009; Ferguson et al. 2009;
Goodrich et al. 2010).
    Movement rates also varied between male and female jaguars. Male movement
paths, represented by velocity autocorrelation time scale and distance traveled by
day, were larger compared with female jaguars (Table 13.1). However, home range
crossing time was variable between individuals. These results are similar to previ-
ous studies of jaguar movements which have reported that female jaguar movement
paths are proportionally more erratic or tortuous with smaller distances traveled per
day (Cavalcanti and Gese 2009; Morato et al. 2016).

13.7.2     Frequency and Intensity of Visits of Jaguars to Certain
           Sites Within Home Ranges

The results obtained from the analysis suggest that jaguars exhibited a selective
behavior in certain areas within their home ranges, and probably these provide sig-
nificant habitat component for their survival or reproduction (Samuel et al. 1985;
Bingham and Noon 1997; Plowman et al. 1998). For instance, areas frequently used
by female jaguar JF15 were associated with rugged terrain across a small mountain
range covered with forest, but that has been deforested around it in the flat areas. In
the case of female jaguars, rugged terrain would provide den and refuge when they
are rearing cubs (Steyn and Funston 2009; White et al. 2015) and could provide
protection because these areas maintain more forest cover in contrast with flat areas
which are more susceptible to deforestation and other human activities.
    Frequently visited areas also might be associated with areas of exclusive use.
Other studies have shown that jaguars have little spatial overlap in core areas
(Azevedo and Murray 2007; de la Torre et al. 2017b). This spatial segregation

                              adelatorre@iecologia.unam.mx
234 J. A. de la Torre and M. Rivero
observed in jaguars and other large felids implies territorial behavior because core
areas have been frequently associated with regions of resource concentration
(Samuel et al. 1985; Plowman et al. 1998; Nuñez 2006; Azevedo and Murray 2007).
Spatial segregation of frequently visited areas or core areas could facilitate the coex-
istence between individuals through resource partitioning (Scognamillo et al. 2003;
Azevedo and Murray 2007). Communication between individuals through scent
marking using scats, scrapes, or spray urine may provide spatial and temporal infor-
mation to reduce confrontation and may help to maintain the exclusive territories
(Harmsen et al. 2010; Towns et al. 2017).
13.7.3 Movement Decisions of Jaguars Across Different
Landscape Features
The step selection function analysis indicates that the probability of movement of
jaguars in the Greater Lacandona Ecosystem is positively associated with a high
percentage of forest cover in a neighborhood of 240 m. This result suggest that
despite the landscape configuration, jaguars prefer to move across forested areas in
the tropical forest of south of Mexico. Additionally our model indicates that prob-
ability of movement for jaguars was associated with positive values of TPI, which
indicated that jaguar movements were facilitated by sites with medium to moderate
slopes and flat valleys (Dickson et al. 2005). This is especially plausible if the flat
areas had been cleared for cattle pastures or crops, which is a common situation in
our study area (Morato et al. 2014). Our best model also indicates that jaguars
avoided moving through the ridge tops of mountain ranges, since the probability of
movement by jaguars decreased with elevation. Other studies also have suggested
that movements of jaguars would be hampered by mountain ranges at higher alti-
tudes (Rabinowitz and Zeller 2010; Zeller et al. 2011); however, it is necessary to
track some individuals in forested areas located at higher altitudes to have conclu-
sive results and to improve the knowledge of jaguar movement behavior in areas of
higher altitudes and rugged terrain.
13.8 Conclusions
In this study we illustrate that the extensive area requirements of jaguars have cru-
cial implications for the conservation of the species at the landscape scale in the
tropical rainforests of Central America; therefore, forest transformation and frag-
mentation would have severe effects for the species. Although jaguars do not neces-
sarily use areas which are covered completely with forest, several studies have
shown that they preferred primary forest in contrast to modified environments asso-
ciated with human activities (Conde et al. 2010; Foster et al. 2010; Colchero et al.
2011; Cullen et al. 2013; de la Torre et al. 2017a).
adelatorre@iecologia.unam.mx13 Insights of the Movements of the Jaguar in the Tropical Forests of Southern Mexico 235
Our study demonstrates that to ensure the long-term conservation of jaguars in
the tropical rainforest of Central America, large extensions of primary forest should
be preserved, for instance, our estimations of jaguar home ranges indicate that it is
necessary to conserve connected parches of tropical forest of at least 200 km2 to
guarantee the annual spatial requirements of a single female jaguar in the south of
Mexico. This estimation gives an idea of the scale and the magnitude of conserva-
tion actions required to preserve jaguar populations in tropical forest areas. Large
tropical forest areas provide to jaguars prey availability, dense foliage for stalking
prey, and refuge for rearing cubs (Rabinowitz and Nottingham 1986; Crawshaw and
Quigley 1991; Conde et al. 2010; Foster et al. 2010; Cullen et al. 2013).
The movement probability model also demonstrates the importance to conserve
areas with primary forest to allow the movement of the jaguars across fragmented
landscapes, because the probability of movement of jaguars was greater in areas
with a forest cover in a neighborhood of 240 m. This outcome has important impli-
cations for the design of corridors focused on maintaining the connectivity between
suitable habitat patches for the species, because our results suggest that the minimal
width at which corridors could be functional for jaguars is 240 m. This result is
similar to studies using other species of large felids such as pumas, which indicates
that corridors >400 m wide covered with forest or other coverage were functional
for dispersal (Beier 1993, 1995).
Our results also showed that BRB model is a new alternative to the traditional
home range estimators to study the space use of large carnivores in tropical for-
ests. This model allowed us to decompose the home range of the jaguars into two
components, intensity of use and frequency of visit. The results obtained from the
estimation of the intensity distribution (ID), which are the areas where the jaguars
spend prolonged periods of time, but only visited once, are probably associated
with hunting sites. On the other hand, the estimation of the recursion distribution
(RD) indicated areas that are frequently visited by jaguars so it can be probably
associated with resting or refuge sites. Together, both distributions could repre-
sent an approximation of the areas identified by the estimation of the fixed kernel
at 50%, considered as the core areas; however, this new approach generated from
the BRB model allows us to make a more detailed description of the use of space
within the home range by jaguars. Future studies could incorporate this approach
combined with an intensive ground tracking of animals to give clearer insights
regarding the utilization of certain areas within their home range by jaguars in
tropical forests.
We recognize that a caveat in our analyses is that the GPS records used to fit all
the models come only from two to five animals tracked, and this sample size prob-
ably is not representative of the jaguar population of our study area. Other limita-
tion is that these five animals were tracked in a relatively small area which is
mainly represented by lowland areas. However, this effort is the first step to under-
stating jaguar movement in the humid tropical rainforest of Southern Mexico and
has opened a window to develop sound conservation actions that ensure the con-
nectivity of this jaguar population across the Greater Lacandona Ecosystem land-
scape (de la Torre et al. 2017a).
adelatorre@iecologia.unam.mx236 J. A. de la Torre and M. Rivero
The movement ecology is a discipline that in recent times, with the development
of new technologies and analytical tools, has allowed making more precise infer-
ences regarding the space use and movement of wildlife animals. We hope that the
growing of this discipline allows in the future a better understanding of the ecology
and behavior of the species that inhabit the tropical rainforest to generate the infor-
mation necessary to implement policy conservation actions that ensure the long-
term persistence of the wildlife and these ecosystems.
Acknowledgments This work was supported by The Conservation, Food & Health Foundation,
Conservation Leadership Programme, Cleveland Metroparks Zoo and Cleveland Zoological
Society, Commission of Natural Protected Areas of the Mexican Federal Government (CONANP),
the Mesoamerican Biological Corridor-Mexico, and the National Council of Science and
Technology of Mexico (CONACyT). J. A. de la Torre acknowledges the scholarship and financial
support provided by the National Council of Science and Technology (CONACyT) and UNAM
during the implementation of this research. We thank Dr. Rodrigo Medellín for his invaluable sup-
port to develop the research. We appreciate the assistance of our field assistants from Lacanja
Chansayab (Luisito, Gregorio, Paco, and Rodrigo) and Frontera Corozal (Silvano, Chano,
Celestino, Bernabe, Wicho, Arnoldo, and Florencio) communities for their helpful and hard work.
We are very grateful to the Commission of Natural Protected Areas of the Mexican Federal
Government (CONANP), especially with S. Nañez and V. Silvano for supporting this research. We
appreciate the invaluable support of Wildlife Service and their team of veterinarians, especially
Ivonne Cassaigne, Susana Ilescas, Octavio Lopez, Dane Hawk, and Dave Kenny. We also thank
Cuauhtémoc Chávez, Heliot Zarza, José Gonzalez Maya, Rurik List, Rodrigo Sierra, Eduardo
Ponce, Gerardo Ceballos, Enrique Martinez-Meyer, David Valenzuela, Jorge Servin, Jaime Zuñiga,
Omar Figueroa, Brian Jansen, Ron Thomson, and Valeria Towns for their helpful suggestions in
the development of this study. We thank Ana Ibarra, Alma Moreno, and Luis Viquez for technical
support. We would also like to thank to Cecilia Vargas, Aseneth Ureña, and Nora Torres for their
helpful assistance during field work. Throughout the analysis, we had the assistance of the Centro
de Investigación en Geografía y Geomática “Ing. Jorge L. Tamayo” A.C. We thank the logistical
support of Bioconciencia A.C. and Natura Mexicana A.C. Permission to conduct the field captures
was granted by the General Office of Wildlife-SEMARNAT Mexico and facilitated by Fernando
Sánchez.
References
Allen AM, Singh NJ (2016) Linking movement ecology with wildlife management and conserva-
tion. Front Ecol Evol 3:1–13
Azevedo FCC, Murray LD (2007) Spatial organization and food habits of jaguars (Panthera onca)
in a floodplain forest. Biol Conserv 137:391–402
Beier P (1993) Determining minimum habitat areas and habitat corridors for cougars. Conserv
Biol 7:94–108
Beier P (1995) Dispersal of juvenile cougars in fragmented habitat. J Wildl Manag 59:228–237
Benhamou S (2011) Dynamic approach to space and habitat use based on biased random bridges.
PLoS One 6:e14592
Benhamou S, Cornélis D (2010) Incorporating movement behavior and barriers to improve kernel
home range space use estimates. J Wildl Manag 74:1353–1360
Benhamou S, Riotte-Lambert L (2012) Beyond the utilization distribution: identifying home
range areas that are intensively exploited or repeatedly visited. Ecol Model 227:112–116
Elsevier B.V.
adelatorre@iecologia.unam.mx13 Insights of the Movements of the Jaguar in the Tropical Forests of Southern Mexico 237
Beyer HL (2012) Geospatial modelling environment. Geospatial Model Environ 2010:1–140
Bhattarai BP, Kindlmann P (2012) Interactions between Bengal tiger (Panthera tigris) and leopard
(Panthera pardus): implications for their conservation. Biodivers Conserv 21:2075–2094
Bingham BB, Noon BR (1997) Mitigation of habitat “Take”: application to habitat conservation
planning. Conserv Biol 11:127–139
Broomhall LS, Mills MGL, du Toit JT (2003) Home range and habitat use by cheetahs (Acinonyx
jubatus) in the Kruger National Park. J Zool 261:119–128
Burnham KP, Anderson DR (2002) Model selection and multimodel inference: a practical
information-theoretic approach, 2nd edn. Springer-Verlag, New York
Cagnacci F, Boitani L, Powell RA, Boyce MS (2010a) Challenges and opportunities of using
GPS-based location data in animal ecology. Philos Trans R Soc Lond Ser B Biol Sci 365:2155
Cagnacci F, Boitani L, Powell RA, Boyce MS (2010b) Animal ecology meets GPS-based radiote-
lemetry: a perfect storm of opportunities and challenges. Philos Trans R Soc Lond Ser B Biol
Sci 365:2157–2162
Calabrese JM, Fleming CH, Gurarie E (2016) Ctmm: an R package for analyzing animal relocation
data as a continuous-time stochastic process. Methods Ecol Evol 7:1124–1132
Calenge AC [online] (2013a) Package ‘adehabitatHR’.
Calenge C [online] (2013b) “Package adehabitatLT” analysis of animal movements. CRAN.
Camp MJ, Rachlow JL, Cisneros R, Roon D, Camp RJ (2016) Evaluation of global positioning sys-
tem telemetry collar performance in the tropical Andes of southern Ecuador. Nat Conservacao
14:128–131 Associação Brasileira de Ciência Ecológica e Conservação
Carbone C, Cowlishaw G, Isaac NJB, Rowcliffe JM (2005) How far do animals go? Determinants
of day range in mammals. Am Nat 165:290–297
Carbone C, Teacher A, Rowcliffe JM (2007) The costs of carnivory. PLoS Biol 5:e22
Cavalcanti SMC, Gese EM (2009) Spatial ecology and social interactions of jaguars (Panthera
onca) in the southern Pantanal, Brazil. J Mammal 90:935–945
Cavalcanti SMC, Gese EM (2010) Kill rates and predation patterns of jaguars (Panthera onca) in
the southern Pantanal, Brazil. J Mammal 91:722–736
Ceballos G, Chávez C, Rivera A, Manterola C (2002) Tamaño poblacional y conservación del jag-
uar en la Reserva de la Biosfera de Calakmul, Campeche, México. In: Medellín RA, Equihua
C, Chetkiewicz CLB, Crawshaw PG Jr, Rabinowitz A, Redford KH et al (eds) El Jaguar en el
Nuevo Milenio. Fondo de Cultura Económica, Universidad Nacional Autónoma de México,
Wildlife Conservation Society, México, pp 403–418
Chávez C (2009) Ecología y conservación del jaguar (Panthera onca) y puma (Puma concolor)
en la región de Calakmul y sus implicaciones para la conservción de la Peinínsula de Yucatán.
Universidad de Granada. Granada, Spain
Chetkiewicz C-LB, Clair CCS, Boyce MS (2006) Corridors for conservation: integrating pattern
and process. Annu Rev Ecol Evol Syst 37:317–342
Colchero F, Medellin RA, Clark JS, Lee R, Katul GG (2009) Predicting population survival under
future climate change: density dependence, drought and extraction in an insular bighorn sheep.
J Anim Ecol 78:666–673
Colchero F, Conde DA, Manterola C, Chávez C, Rivera A, Ceballos G (2011) Jaguars on the move:
modeling movement to mitigate fragmentation from road expansion in the Mayan Forest. Anim
Conserv 14:158–166
Conde DA, Colchero F, Zarza H, Christensen NL, Sexton JO, Manterola C et al (2010) Sex mat-
ters: modeling male and female habitat differences for jaguar conservation. Biol Conserv
143:1980–1988 Elsevier Ltd
Crawshaw PG Jr, Quigley HB (1991) Jaguar spacing, activity and habitat use in a seasonally
flooded environment in Brazil. J Zool 223:357–370
Cullen LJ, Sana DA, Lima F, De Abreu KC, Uezu A (2013) Selection of habitat by the jag-
uar, Panthera onca (Carnivora: Felidae), in the upper Paraná River, Brazil. Fortschr Zool
30:379–387
adelatorre@iecologia.unam.mx238 J. A. de la Torre and M. Rivero
Davis S, Haywood V, Herrera-MacBride O, Villa-Lobos J, Hamilton A (1997) Centre of plants
diversity. A guide and strategy for their conservation. The World Wide Fund for Nature, UICN
and The World Conservation Union, Cambridge, UK
De Jong BHJ, Ochoa-Gaona S, Castillo-Santiago MA (2000) Carbon flux and patterns of land-use/
land-cover change in the Selva Lacandona. Ambio 29:504–511
de la Torre JA, Medellín RA (2011) Jaguars Panthera onca in the Greater Lacandona Ecosystem,
Chiapas, Mexico: population estimates and future prospects. Oryx 45:546–553
de la Torre JA, Rivero M (2017) A morphological comparison of jaguars and pumas in southern
Mexico. Therya 8:117–122
de la Torre JA, Núñez JM, Medellín RA (2017a) Spatial requirements of jaguars and pumas in
Southern Mexico. Mamm Biol 84:52–60
de la Torre JA, Núñez JM, Medellín RA (2017b) Habitat availability and connectivity for jaguars
(Panthera onca) in the Southern Mayan Forest: conservation priorities for a fragmented land-
scape. Biol Conserv 206:270–282
de la Torre, JA, González-Maya JF, Zarza H, Ceballos G and Medellín RA (2018) The jaguar's
spots are darker than they appear: Assesing the global conservation status of the jaguar Panthera
onca. Oryx 52:300–315
Dickson BG, Jenness JS, Beier P (2005) Influence of vegetation, topography, and roads on cougar
movement in southern California. J Wildl Manage 69, 264–276
Eisenberg JF (1986) Life history strategies of the Felidae: variations on a common theme. In:
Miller SD, Everett DD (eds) Cats of the world: biology conservation and management. National
Wildlife Federation, Washington, DC, pp 293–303
Emmons LH (1987) Comparative feeding ecology of felids in a neotropical rainforest. Behav Ecol
Sociobiol 20:271–283
Espinosa S, Celis G, Branch LC (2018) When roads appear jaguars decline: increased access to
an Amazonian wilderness area reduces potential for jaguar conservation. PLoS One 13:1–18
Ferguson AW, Currit NA, Weckerly FW (2009) Isometric scaling in home-range size of male and
female bobcats (Lynx rufus). Can J Zool 87:1052–1060
Figueroa O (2013) The ecology and conservation of jaguars (Panthera onca) in Central Belize:
conservation status, diet, movement patterns and habitat use. Gainsville, Florida, USA. 163 pp.
Fortin D, Beyer HL, Boyce WM, Smith DW, Duchesne T, Mao JS (2005) Wolves influence
elk movements: behavior shapes a trophic cascade in Yellowstone National Park. Ecology
86:1320–1330
Foster RJ, Harmsen BJ, Doncaster CP (2010) Habitat use by sympatric jaguars and pumas across
a gradient of human disturbance in Belize. Biotropica 42:724–731
Foster VC, Sarmento P, Sollmann R, Tôrres N, Jácomo ATA, Negrões N et al (2013) Jaguar and
Puma activity patterns and predator-prey interactions in four Brazilian biomes. Biotropica
45:373–379
Frank L, Simpson D, Woodroffe R (2003) Foot snares: an effective method for capturing African
lions. Wildl Soc Bull 31:309–314
Gittleman JL, Harvey PH (1982) Carnivore home-range size, metabolic needs and ecology. Behav
Ecol Sociobiol 10:57–63
Gitzen RA, Belant JL, Millspaugh JJ, Te Wong S, Hearn AJ, Ross J (2013) Effective use of radio-
telemetry for tropical forest carnivores. Raffles Bull Zool 28:67–83
Goodrich JM, Miquelle DG, Smirnov EN, Kerley LL, Quigley HB, Hornocker MG (2010)
Spatial structure of Amur (Siberian) tigers (Panthera tigris altaica) on Sikhote-Alin biosphere
Zapovednik, Russia. J Mammal 91:737–748
Haag T, Santos AS, Sana DA, Morato RG, Cullen L, Crawshaw PG et al (2010) The effect of
habitat fragmentation on the genetic structure of a top predator: loss of diversity and high dif-
ferentiation among remnant populations of Atlantic Forest jaguars (Panthera onca). Mol Ecol
19:4906–4921
Halstead TD, Gruver KH, Phillips RL, Johnson RE (1995) Using telemetry equipment for moni-
toring traps and snares. In: Masters RE, Huggins JG (eds) Twelfth great plains wildl. damage
control workshop proc. Noble Foundation, Ardmore, pp 121–123
adelatorre@iecologia.unam.mxYou can also read