Instantaneous Allocation of DG and DSTATCOM for Loss Reduction and Voltage Profile Enhancement in Radial Distribution Network
←
→
Page content transcription
If your browser does not render page correctly, please read the page content below

© 2021 JETIR June 2021, Volume 8, Issue 6                                                       www.jetir.org (ISSN-2349-5162)

 Instantaneous Allocation of DG and DSTATCOM
      for Loss Reduction and Voltage Profile
   Enhancement in Radial Distribution Network
                                        1
                                             Manikandan K, 2Subramaniyan V, 3Vignesh D
                                                        1,2,3
                                                         Assistant Professor
                                     1,2,3
                                         Department of Electrical and Electronics Engineering
                           1
                             Sree Vidyanikethan Engineering College,Tirupati-517102, Andhra Pradesh
                                 2
                                  Velammal Institute of Technology, Panjetty-601204, Tamilnadu
                                   3
                                     Velammal Engineering College, Chennai-600066, Tamilnadu

Abstract— In the entire power system maximum power losses are occurring on the distribution system side. In a Radial Distribution
System (RDS), maintaining the required voltage profile is a difficult task due to its rugged and irregular structure. Moreover, the
power demand is increasing day-by-day with reducing fossil fuel availability, and also huge environmental pollution occurs while
generating electrical energy by conventional methods. Usage of tiny Distributed Energy Resources such as wind, solar PV, and
biomass at the load side reduces power losses and pollution to a minimum value. To improve the voltage profile DSTATCOM can
be used. Optimal placement of Distributed Generator and DSTATCOM is very essential for their effective functioning in reducing
power losses and improving voltage profile. This paper proposes a code in C language for finding the best location of DG and
DSTATCOM in an RDS by using the Direct Load Flow technique for load flows and Stability Index factor for finding an optimal
location. This methodology is tested on IEEE-9, IEEE-15, and IEEE-33 bus RDS.

Index Terms— Radial Distribution System, Distributed Generator, DSTATCOM, Direct Load Flow, Stability Index.

 I.INTRODUCTION
 The major generation of power in India is through non-renewable energy resources. Nowadays renewable energy sources gaining
 high attention throughout the world to overcome several environmental issues such as pollution increase in global warming etc.
 As non-renewable energy reserves are being under extinction, renewable energy resources usage has to be increased to meet the
 ever-increasing power demand in daily life. The major available renewable resources, PV system, wind turbine system, biomass,
 etc., cannot be used as base loads as their efficiency is low and lack availability throughout the day. In addition, the drawback with
 these DG sets is their intermittent nature because of various factors such as stability and weather conditions. To use these resources
 efficiently the Micro-grid concept came into the scenario. DGs are connected at different PQ buses of a bus system. The loads
 receive power from centralized power stations as well as from these DGs. These DGs are directly connected with the energy
 storage devices such as capacitors, batteries, etc. to increase efficiency. Thus, DG reduces the power demand to the central power
 station. By replacing non-renewable energy resources this DG is not only meeting the load requirements but also reducing the
 pollution and active, reactive power losses. These DGs are also helpful in supplying power to remote areas where there is no
 provision of transmission of power.
 The major problem in the radial distribution system is the reduction of voltage profile at the end consumer and the power loss at
 each bus. In the distribution system, the DG should be placed near the load such that it enhances the quality of the system. The
 economical operation and minimized overall loss of the Distribution Network (DN) can be achieved by allocation of DG sources
 at appropriate bus locations. Even though DG sources are important, the design and operation of DN involving DG are of critical
 concern for the system planners.
 Fahad Iqbal et al have explained the loss reduction and Vimprove by considering the factors loss LSF and VPI for appropriate
 allocation of DG and DSTATCOM [1]. A. Parizad et al have proposed the voltage stability and losses indices for the best location
 of Distribution Generation for reduction of losses in the distribution system [2]. C. Divya et al have illustrated the optimum
 location of multiple Distribution Generations using a sensitivity analysis approach for loss reduction and enhancement of voltage
 profile [3]. F. Peng et al have derived an operational methodology for micro-grid cooperated with DN based on Demand Response
 (DR) when a Distribution Generation is placed in the distribution system [4]. G.Kalidas et al [2015] have explained the
 mathematical modeling and load flow analysis of 9 bus RDS by using the BFSLF algorithm [5]. Marcelo Cortes Carmona et al
 have proposed the algorithm for the power flow analysis of Distribution Networks including Distribution Generation [6]. M.
 Natarajan et al [2015] have illustrated the best possible apportionment and sizing of DG's using the CABC algorithm in DN for
 the minimization of losses and improving the voltage stability in the distribution system [7]. Riteik Majumder et al have explained
 the stability enhancement and power-sharing of an independent micro-grid with non-inertial and inertial DGs with DSTATCOM
 [8]. Taiseer Tuffaha et al have derived the security evaluation of an MG distribution system with a solar photovoltaic and storage
 system [9]. T. Ramana et al have illustrated the direct and easiest power flow solution for electrical power DN [10]. The
 investigation on a new approach for optimal sitting and sizing of DSTATCOM for reducing the power losses in the Distribution

JETIR2106848        Journal of Emerging Technologies and Innovative Research (JETIR) www.jetir.org                             g140
© 2021 JETIR June 2021, Volume 8, Issue 6 www.jetir.org (ISSN-2349-5162)
System using optimization techniques was illustrated [11]. The minimization of power loss, total voltage deviation, and voltage
stability index was considered as the objective using Lightning Search Algorithm. In this, the variation of feeder load was
considered as a 1% change from light load to full load [12]. The factor considers for installing the DSTATCOM in the respective
place of the bus, the voltage stability index was considered. IEEE 33 and IEEE 69 bus Radial Distribution Network was considered
for analysis and the test results were compared with Immune Algorithm [13].B. Singh and D. Kumar have illustrated the detailed
survey for enhancing the power transfer capability in Distribution Network by placing DG optimally. The four different types of
DG were considered which also work with various power factors. In this, the reliability and security of the system, loadability
CAIDI, SAIDI, short circuit current capacity, voltage profile improvement, etc were considered [14].
The mathematical model for flexible variant-based Differential Search (DS) algorithm to determine the optimal location and sizing
of multiple DG optimally. In addition to this, the cost component for real power and energy losses were considered [15]. A brief
overview of the optimal sitting and sizing of multi-type FACTS devices using metaheuristic techniques in power system were
discussed. The location and types of FACTS device utilized was selected optimally [16]. The reconfiguration of DN by changing
the status of sectionalizing switches to reduce the power loss and improve the voltage profile in steady-state conditions [17]. The
solar PV, wind, and biomass were optimally placed in DN to reduce the losses but here the fulfillment of reactive power for the
network was not considered which leads to the under-voltage problem [18]. Indian rural electrification (28 bus) was considered
as the test case and the location of DSTATCOM based on voltage stability index and sizing was identified using the Whale
Optimization Algorithm (WAO)[19]. The reactive power compensation was done on various buses on IEEE 33 bus RDN to
improve the voltage profile using effective techniques and results were verified with the PSO algorithm [20]. In this paper different
objective functions Ploss, Voltage Deviation (VD), and stability are majorly considered for the DG placement. In DG the major
proportion of the load is inductive in nature which causes increased Ploss and enhanced VD. Hence mention issues can be achieved
by appropriate allocation of DSTATCOM.
In this paper, the installation of DG and DSTATCOM is based on Ploss and Voltage profile Improvement (Vimprove) by utilizing the
various factors like Loss Sensitivity Factor (LSF), Fast Voltage Stability Index (FVSI), Voltage profile index (VPI), Line
Utilization Factor (LUF), Stability Index (SI).
II. DIRECT LOAD FLOW METHOD
As mentioned earlier the major losses are in the distribution system. There are different configurations in distribution systems like
the radial, ring, doubly-fed distribution systems. Among these RDS is mostly used because of its rugged structure and low
economic nature. Due to the low X/R ratio and irregular structure Distribution Load Flow techniques are used like Ladder Network
Method, Adaptive Newton-Raphson method, Direct Load Flow method. Therefore, the DLF method is considered in this paper
due to its simple and adaptive nature for complex bus systems including DG, DSTATCOM considerations. Let’s view this method
in terms of IEEE 33 bus RDS.
At bus 'i' the complex load Si can be written as following,
S i Pi Qi (1)
Where i = 1, 2, 3 ...n.
Where n denotes the total number of buses Pi denotes ith bus active power, Qi denotes ith bus reactive power.
The current at the ith bus is given as follows,
C
ii i
S
Vi (2)
Where Vi denotes voltage at the ith bus.
19 20 21 22
26 27 28 29 30 31 32 33
1 2 3 4 5 6 7 8 9 10 11 12 13 14 15 16 17 18
23 24 25
Figure 1. IEEE 33 bus RDS
The current injection matrix can be obtained by computing the currents at all buses using (2). The Branch Current to Bus Injection
(BIBC) matrix can be obtained by applying KCL in the given system and the bus injected currents for IEEE 33 bus RDS are as
follows as per Figure 1.
B1 = i1 + i2 + ….......+ i15 + i16 + i17 + i18 + + i30 + i31 + i32
B10 = i10 + i11 + + i17
JETIR2106848 Journal of Emerging Technologies and Innovative Research (JETIR) www.jetir.org g141
© 2021 JETIR June 2021, Volume 8, Issue 6 www.jetir.org (ISSN-2349-5162)
B22 = i22 + i23 + i24 B25 = i25 + i26 + + i32
B18 = i18 + i19 + i20 + i21 (3)
The relationship between Ibranch currents and Ibus current injections is expressed in the following equation,
[B] = [BIBC] [i] (4)
Where BIBC = Bus Injections to Branch Currents matrix.
The Bus Injection to Bus Voltage matrix (BCBV) is given by,
[BCBV] = [BIBC]T Z (5)
Where Z = diag (Zb) and Zb = Branch impedance matrix.
The iterative change in voltages for each bus is given by matrix as,
[ΔV] = [BCBV] [BIBC] [i] (6)
The DLF can be calculated as,
[DLF] = [BCBV] [BCBI] (7)
From the equation 6,
[ΔV] = [DLF] [i] (8)
The voltage for next iteration is given by,
[Vc+1] = [V0]-[ΔVc+1] (9)
Where c is iteration count and V0 is initial voltage.
The tolerance criterion is checked by the following equation,
ii iic iic 1 (10)
Where ɛ is the tolerance value, when equation 10 satisfies at every bus then the values can be finalized without further iterations.
The active and reactive power losses are given by,
Pj ,loss
Pj2 Q 2j Rij
(11)
V 2
j
Pj2 Q 2j X ij
Q j ,loss
V 2
j (12)
Where
Pi
= Total real power delivered at node 'j'
Qi
= Total reactive power delivered node 'j'
Rij
= ijth bus resistance.
X ij
= ijth bus reactance.
Pi
= (BIBC) x (PRLPM)
Qi
= (BIBC) X (QRLPM)
PRLPM = Active power matrix of the system.
QRLPM = reactive power matrix of the system.
JETIR2106848 Journal of Emerging Technologies and Innovative Research (JETIR) www.jetir.org g142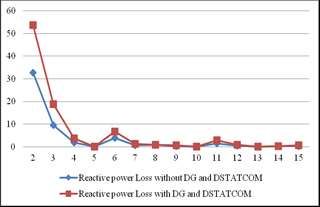
© 2021 JETIR June 2021, Volume 8, Issue 6 www.jetir.org (ISSN-2349-5162)
III. PROBLEM FORMULATION
3.1 DG Sizing
The DG size is calculated iteratively. Considering DG size to a minimum value real and reactive power losses of the system are
determined. Increasing DG size step-wise the losses of the system are determined at each size of DG. The final size of DG is
considered such that the system has maximum reduced active and reactive power losses.
Vm ' jXm Vm 1 '
im rm
iDSTATCOM
Pm jQ m
Pm1 jQm1
Voltage Source
Inverter
Energy Storage
Device
Figure 2. Two bus representation with DSTATCOM [1]
DSTATCOM is a shunt-type FACTS device that absorbs or injects the reactive power from the mainline or to the mainline
respectively in the Distribution System. It is a very quick process, precise, and has a wide controlling area as the DSTATCOM is
made up of the energy storage device and power electronic devices which have fast response.
Generally, the furthermost of the distribution systems are represented in RDS and the power is supplied from one end to the other
end. Figure 2 illustrates the connection of DSTATCOM in the position of m+1. Where Rm symbolizes the resistance of the line
and Xm symbolizes the reactance of the line between 'm' and m+1 buses respectively. Similarly, Pm+jQm and Pm+1+jQm+1 are the
confined loads related to buses m and m+1. Likewise, the voltages at buses 'm' and 'm+1' are represented as Vm and Vm+1. Normally
in the conventional RDS, voltages at the buses are defined at the values of less than 1 p.u. Let us assume that the bus 'm+1' is
under voltage and the DSTATCOM is placed to make its voltage equal to 1 p.u. The expressions for modeling DSTATCOM are
given in [1].
Here two objective functions are created considering different factors for the best location of DG and DSTATCOM.
F1i=W1 (PLSF+QLSF) + W2 (VPIi) + W3 (FVSIi) (13)
Where
PLSF = Active Power Loss Sensitivity Factor
QLSF = Reactive Power Loss sensitivity Factor
VPI = Voltage Profile Index
FVSI = Fast Voltage Stability Index
F2i represents the 2nd objective function includes the stability index alone.
F2i=SIi (14)
Where
SI = Stability Index
1. Loss Sensitive Factor
Rij
PLOSS ,i ( Pi 2 Qi2 )
Vi 2 (15)
X ij
QLOSS ,i ( Pi 2 Qi2 )
Vi 2 (16)
JETIR2106848 Journal of Emerging Technologies and Innovative Research (JETIR) www.jetir.org g143© 2021 JETIR June 2021, Volume 8, Issue 6 www.jetir.org (ISSN-2349-5162)
Where
Pi
= Real power delivered to the jth node
Qi
= Reactive power delivered to the jth node
Rij
= Resistance of ijth bus
X ij
= Reactance of ijth bus
2. Voltage Stability Index
4Z ij2Q j
VSI ij (17)
Vi 2 X ij
3. Voltage Profile Index
Vi
VPI
Vref
(18)
Where
Vi
= ith bus voltage
Vref
= reference bus voltage
4. Stability Index
( Pi 2 Qi2 )
SI 4 Ri
Vi 2 Pi (19)
IV. RESULTS AND DISCUSSION
4.1 IEEE 9 Bus RDS
The base voltage considered for this system is 23kV. The total active and reactive power losses before placing DG are 703.608
kW and 909.577 kvar respectively. After running the code in C language using IDE compiler the optimal placement of DG results
at 9th Bus with a size of 3700 kW. After placing DG at 9 th Bus the total active and reactive power losses are reduced to 210.396
kW and 336.075 kvar respectively as shown in Figure 3. The voltage profile of the system without and with DG is as follows. As
the voltage profile is as per the requirement after placing DG and due to heavy load ratings, DSTATCOM is not placed in IEEE 9
bus RDS.
Figure 3. Voltage profile of IEEE 9 BUS RDS
4.2 IEEE 15 Bus RDS
The base voltage considered for this system is 11 kV. The total active and reactive power losses before placing DG are 56.103 kW
and 51.344 kvar respectively. For this system, the optimal placement of DG is found to be at bus 6 with a size of 600 kW. The
active and reactive power losses are reduced to 46.255 kW and 40.828 kvar respectively. The DSTATCOM size is found to be
139.641 kvar.
JETIR2106848 Journal of Emerging Technologies and Innovative Research (JETIR) www.jetir.org g144© 2021 JETIR June 2021, Volume 8, Issue 6 www.jetir.org (ISSN-2349-5162)
Figure 4. Optimal placement of DG from the 1st objective function is at bus ‘12’
After placing both DG and DSTATCOM the active and reactive power losses are 36.529 kW and 33.215 kvar respectively and
the results of the objective functions are shown in Figure 4 and Figure 5.
Figure 5. Optimal placement of DG from the 2nd objective function is at bus ‘5’
Figure 6 (a). Voltage profile of IEEE 15 bus System
Figure 6 (b). Active power losses of IEEE 15 bus RDS
JETIR2106848 Journal of Emerging Technologies and Innovative Research (JETIR) www.jetir.org g145© 2021 JETIR June 2021, Volume 8, Issue 6 www.jetir.org (ISSN-2349-5162)
Figure 6 (c). Reactive power losses of IEEE 15 bus RDS
The voltage profile, active power (P) loss, and reactive power (Q) losses of IEEE 15 bus network with and without DG based
combined objective function as shown in Figure 6 (a), (b), and (c) corresponding to Series 1-without DG and Series 2-with DG.
4.3 IEEE 33 Bus RDS
For the 33 bus system, the base voltage is considered as 12.6 kV. Earlier placement of DG and DSTATCOM, the total active and
reactive power losses are 199.04 kW and 134.53 kvar respectively. The best location of DG is found to be bus 30 with a size of
1500 kW. Once the DG is placed, the reduced P and Q losses are 119.954 kW and 84.597 kvar respectively. The size of
DSTATCOM is found to be the value of 1858.56 kvar. With the effect of both DG and DSTATCOM placement, the reduced
active and reactive power losses are 80.935 kW and 60.512 kvar respectively.
Figure 7. Voltage Profile of IEEE 33 Bus RDS
The voltage profile of the system without DSTATCOM and DG, with DG and both DSTATCOM and DG, is as shown in Figure
7. The P and Q power losses of the IEEE 33 bus system are shown in Figure 8.
Figure 8 (a). Active power losses of IEEE 33 bus RDS
JETIR2106848 Journal of Emerging Technologies and Innovative Research (JETIR) www.jetir.org g146© 2021 JETIR June 2021, Volume 8, Issue 6 www.jetir.org (ISSN-2349-5162)
Figure 8 (b). Reactive power losses of IEEE 33 bus RDS
The active and reactive power losses for IEEE 9 Bus, IEEE 15 Bus, and IEEE 33 Bus RDS are compared without DSTATCOM
and DG, with DG alone and with DG and DSTATCOM in Figure 7 and Figure 8 (a), (b) respectively. The comparison of losses
in the above test cases before and after installation of DG and DSTATCOM is shown in Tables I, II, and III.
Table 1 IEEE 9 Bus RDS Losses
IEEE 9 BUS DG Size (KW) DSTATCOM (kvar)
DG/DSTATCOM (Bus No.) (Bus No.)
PLoss (KW) QLoss (kvar)
Without DG and
703.608 909.57 - -
DSTATCOM
With DG (F1) 210.396 336.075 3700 (9) -
Table 2 IEEE 15 Bus RDS Losses
IEEE 15 BUS DG Size (KW) DSTATCOM (kvar)
DG/DSTATCOM (Bus No.) (Bus No.)
PLoss (KW) QLoss (kvar)
Without DG and
56.1503 51.344 - -
DSTATCOM
With DG (F1) 46.255 40.828 400 (12) -
With DG (F2) 42.279 38.286 600 (5) -
With DG and
DSTATCOM 36.529 33.215 600 (5) 139.641 (5)
Table 3 IEEE 33 Bus RDS Losses
IEEE 33 BUS DG Size (KW) DSTATCOM (kvar)
DG/DSTATCOM (Bus No.) (Bus No.)
PLoss (KW) QLoss (kvar)
Without DG and
199.04 134.53 - -
DSTATCOM
With DG 119.954 84.597 1500 -
With DG and
DSTATCOM 80.936 60.512 1500 1858.56
V. CONCLUSIONS
This paper proposes a code in C language with IDE compiler for finding the best location and sizing of DSTATCOM and DG in
RDS. The direct Load Flow method was used for calculating load flows. Loss Sensitivity Factor, Fast Voltage Stability Index, and
Voltage Profile Index are used to frame the first objective function of the placement of DG and DTATCOM. Stability Index is
used for framing the second objective function of the placement of DG and DTATCOM. Out of these two objective functions, the
second objective function provides better results. Therefore, Stability Index is considered for the best location of DSTATCOM
and DG. The same Objective function is used for placing both DG and DATACOM as placement of DG and DSTATCOM at the
same bus is more effective. The DG is size calculated by an iterative process. The DSTATCOM rating is calculated from
DSTATCOM modeling. By the location of DG and DSTATCOM in the test cases as per the result, gives better results in reducing
true and reactive power losses and also enhancing the voltage profile.
JETIR2106848 Journal of Emerging Technologies and Innovative Research (JETIR) www.jetir.org g147© 2021 JETIR June 2021, Volume 8, Issue 6 www.jetir.org (ISSN-2349-5162)
REFERENCES
[1] Fahad Iqbal, Mohd Tauseef khan, and Anwar Shahzad Siddiqui, “Optimal placement of DG and DSTATCOM for loss
reduction and voltage profile improvement”, Alexandria Engineering Journal, vol. 57, no. 2, (2018), pp. 755-765.
[2] A. Parizad, A. Khazali, and M. Kalantar, “Optimal Placement of Distributed Generation with Sensitivity Factors Considering
Voltage Stability and Losses Indices”, Proceeding of 18 th Iranian IEEE conference on Electrical Engineering, Isfahan, Iran,
(2010) May 11-13.
[3] C. Divya and T. Gowri Manohar, “Optimal Location of DG Units using Sensitivity Analysis”, International journal of
advanced technology and innovative research, vol. 8, no. 21, (2016), pp. 4192-4196.
[4] F. Peng, H. Su, P.li, G. Song and J. Zhao, “An interactive operation strategy for micro-grid cooperated with distribution system
based on demand response”, IEEE 5th International Conference on Electric Utility Deregulation and Restructuring and Power
Technologies (DRPT), Changsha, China, (2015) Nov. 26-29.
[5] G Kalidas Babu and Rajesh Kumar samala, “Load flow analysis of 9 bus radial system using BFSLF algorithm”, International
Journal of Electronics and Communication Engineering, vol. 4, no. 6, (2015) pp. 17-22.
[6] Marcelo Cortes Carmona, Jeorge Vega and Marcelo Cortes Olivares, “Power flow algorithm for analysis of Distribution
networks including distribution generation”, IEEE PES Transmission & Distribution Conference and Exhibition - Latin
America (T&D-LA), Lima, Peru, (2018) Sep. 18-21.
[7] M. Natarajan, R. Balamurugan and L. Lakshminarasimman, “Optimal placement and sizing of DG's in the Distribution for
loss minimization and voltage stability index using CABC”, International Journal on Electrical Engineering and Informatics,
vol. 7, no. 5, (2015), pp. 679-690.
[8] Riteik Majumder, Arindam Ghosh, Gerard Ledwich, and Firuz Zare, “Power-sharing and stability enhancement of an
autonomous microgrid with inertial and non-inertial DG's with DSTATCOM”, IEEE International Conference on Power
Systems, Kharagpur, India, (2009) Dec. 27-29.
[9] Taiseer Tuffaha and Mohammad Almuhaini, “Reliability assessment of a micro-grid distribution system with PV and storage”,
IEEE International Symposium on Smart Electric Distribution Systems and Technologies, Vienna, Austria, (2015) Sep. 08-
11.
[10] T. Ramana, V. Ganesh and S. Sivanagaraju, “Simple and Fast Load Flow Solution for Electrical Power Distribution Systems”,
International Journal on Electrical Engineering and Informatics, vol. 5, no. 3, (2013), pp. 245-255.
[11] T.Yuvaraj, K. R. Devabalaji, and K. Ravi, "Optimal placement and sizing of DSTATCOM using Harmony Search algorithm",
International Conference on Alternative Energy in Developing Countries and Emerging Economies, Energy Procedia, 79,
759-765,2015.
[12] Yuvaraj Thangaraj, and Ravi Kuppan, "Multi-objective simultaneous placement of DG and DSTATCOM using novel lightning
search algorithm", Journal of Applied Research and Technology, 477-491,2017.
[13] T.Yuvaraj, K. Ravi and K. R. Devabalaji, " DSTATCOM allocation in distribution networks considering load variations using
bat algorithm", Ain Shams Engineering Journal, 26 September 2015.
[14] Bindeshwar Singh and Deependra Kumar Mishra, " A survey on enhancement of power system performances by optimally
placed DG in distribution networks", Energy Reports, 9 March 2018.
[15] Belkacem Mahdad and K. Srairi, " Adaptive differential search algorithm for optimal location of distributed generation in the
presence of SVC for power loss reduction in distribution system", Engineering Science and Technology, an International
Journal, 6 April 2016.
[16] Ahmad AL Ahmad, Reza Sirjani, " Optimal placement and sizing of multi-type FACTS devices in power systems using
metaheuristic optimisation techniques: An updated review", Ain Shams Engineering Journal, Ain Shams Engineering Journal,
611-628, 30 December 2019.
[17] S.Jazebi, S.H.Hosseinian, and B.Vahidi, " DSTATCOM allocation in distribution networks considering reconfiguration using
differential evolution algorithm", Volume 52, Issue 7, Pages 2777-2783, July 2011.
[18] Fahad Iqbal, Mohd Tauseef Khan and Anwar Shahzad Siddiqui, "Optimal placement of DG and DSTATCOM for loss
reduction and voltage profile improvement", Alexandria Engineering Journal, Volume 57, Issue 2 Pages 755-765, June 2018,
[19] P. Balamurugan, T Yuvarai and P. Muthukannan, " Optimal Allocation of DSTATCOM in Distribution Network Using Whale
Optimization Algorithm", Engineering, Technology & Applied Science Research Vol. 8, No. 5, 3445-3449, 2018.
[20] Mohammed N. Abdrabo, Ahmed Y. Hatata, Sahar S. Kaddah, and Mohammed I. Elsaid, "Optimal Allocation of Multiple D-
STATCOM in Distribution System Using PSO", MANSOURA ENGINEERING JOURNAL, (MEJ), VOL. 44, ISSUE 2,
JUNE 2019.
JETIR2106848 Journal of Emerging Technologies and Innovative Research (JETIR) www.jetir.org g148You can also read