Interim report Akelius Residential Property AB (publ) - Cision
←
→
Page content transcription
If your browser does not render page correctly, please read the page content below

Akelius Residential Property AB (publ)

interim report
January to June 2021

                                             2021      2020     2021      2020       2020
                                          Jan‒Jun   Jan‒Jun   Apr‒Jun   Apr‒Jun   Jan‒Dec
Property fair value, EUR million          12,960    11,986    12,960    11,986     12,139
Number of apartments                      45,029    43,989    45,029    43,989     44,443
Residential rentable area, thousand sqm    2,807     2,709     2,807     2,709      2,752
Real vacancy rate, residential, percent       1.0       1.3       1.0       1.3       1.7
Vacancy rate, residential, percent            6.3       7.8       6.3       7.8       7.5
Rent potential, percent                       48        35        48        35        24

Rental income, EUR million                   250       238       125       119       471
Like-for-like growth in rental income,
percent                                       0.2       6.3       0.6       5.8       3.6
Net operating income, EUR million            136       130        69        66       259
Net operating income margin, percent        54.5      54.7       55.1      55.4      54.9
Like-for-like growth in net operating
income, percent                              -1.3     10.3       -1.9       9.0       8.4
EBITDA, EUR million                          121       110        61        55       221
Profit before tax, EUR million               375        53       222        28        72

Loan-to-value, percent                        40        37        40        37        39
Cash sources to cash uses, percent           482       166       482       166       456
Interest coverage ratio                       2.8       6.6       2.8       6.6       3.3
Interest coverage ratio,
excluding realized value growth               2.5       2.4       2.5       2.4       2.5
Credit rating, Standard & Poor's             BBB       BBB       BBB       BBB       BBB
Credit rating, Fitch Ratings                 BBB          -      BBB          -         -
Net asset value, EUR million               6,640     6,386     6,640     6,386      6,324

Definitions on pages 39‒41.
81 Isabella Street, Toronto

real vacancy one percent
vacancy down by 1.2 percentage                 rental income growth 5.2 percent
points                                         Acquisitions and a positive one-off effect
During the second quarter the vacancy          from the Berlin rent regulation were the main
decreased 0.6 percentage points to             factors behind the rental growth.
6.3 percent.                                   COVID-19 has negatively affected rental
So far during 2021 the vacancy has dropped     income.
1.2 percentage points.                         Akelius has temporarily given rent
The major contributor to the progress is       concessions particularly in the United States
finalized extensive upgrading projects.        and in London.
Akelius expects vacancy to continue to         Another effect is lower or postponed rent
decrease materially.                           increases through indexation in regard to the
                                               COVID-19 situation.
The real vacancy improved with
0.7 percentage points to 1.0 percent.          Akelius believes that the COVID-19 effects
The average real vacancy the last decade has   will be lower from the third quarter.
been 1.1 percent.
interim report, January to June 2021

property fair value increased                      average interest rate 1.68 percent
2.6 percent                                        Akelius' improved financial situation coupled
During the first six months 2021,                  with good market conditions are the main
mainly Berlin, Hamburg, and Stockholm              factors behind the lower funding costs.
affected the value growth positively.              So far in 2021, the average interest rate has
New York and London contributed negatively.        decreased from 1.95 to 1.68 percent and the
COVID-19 has affected Akelius’ cities              average duration of the loans has increased to
differently and it is clear that diversification   6 years.
decreases risk.
                                                   loan-to-value 40 percent,
net acquisitions EUR 144 million                   liquidity EUR 1,084 million
Akelius has during the period acquired             Strong liquidity and prudent leverage enable
properties for EUR 170 million in Montreal,        Akelius to act from a strong position.
Toronto, and Washington D.C.
The initial yield was on average 3.9 percent       staff reduced by 239
and the required yield was 4.1 percent.
                                                   Staff has decreased from 1,486 to 1,247 in the
Properties in Germany were divested for            last 12 months.
EUR 26 million.
                                                   The change is in line with the ambition to focus
Akelius has so far in 2021 signed                  on properties with strong cash flow and low
40 condominium sales in Germany.                   need of extensive upgrading.
On average the sale prices exceeded the fair
value with 60 percent.

profit before tax EUR 375 million
Strong development of EBITDA and positive
value changes of properties and financial
instruments increased the profit before tax to
EUR 375 million,
compared with EUR 53 million for the same
period 2020.

                                                   Ralf Spann,
                                                   CEO and Managing Director

                                                                                                   3
interim report, January to June 2021

 property portfolio June 30, 2021

 fair value properties EUR 12,960 million

                              Rentable                                     Vacancy
                                                     Fair value
                                 area,                                         rate,    Capitaliza-
                   Number of thousand       EUR             proportion, residential,     tion rate,
City              apartments      sqm     million   EUR/sqm    percent      percent        percent
Berlin               14,052       936     3,263        3,487          25          2.1         2.84
London                2,068       104       959        9,222           8         12.0         4.13
Hamburg               3,592       207       930        4,494           7          4.4         3.36
Paris                 1,564        53       437       8,268            3         30.6         4.03
Europe               21,276     1,300     5,589       4,300           43          5.6        3.26

Stockholm             5,934       458     1,841        4,022          14          1.3         2.63
Malmö                 4,092       350     1,092        3,124           8          0.2         3.10
Copenhagen             1,031       88       344        3,900           3          3.0         2.98
Scandinavia          11,057      896      3,277       3,660           25          1.0        2.84

Toronto               3,770       203     1,024       5,054            8          6.8         3.50
Montreal               4,016      275       970        3,522           8         15.8         4.30
New York               1,736      122       860        7,040           7         11.4         4.27
Washington D.C.        2,145      179       680        3,792           5         12.4         4.69
Boston                1,029        67       560       8,364            4         17.3         4.25
North America        12,696      846      4,094       4,837           32        12.1         4.17

Total/Average        45,029     3,042    12,960       4,261         100           6.3        3.45

 4
interim report, January to June 2021

like-for-like growth

rental income 0.2 percent                      net operating income -1.3 percent

                                                       10.7

                                                                              8.4
                                                8.0

                         5.7                                     5.1
           5.1
  4.1                           3.6
                  3.2                                                  2.9

                                         0.2

                                                                                    -1.3
 2016     2017   2018   2019   2020 Jan‒Jun    2016   2017      2018   2019   2020 Jan‒Jun
                                     2021                                           2021

changes in the property portfolio

property purchases                             property sales EUR 26 million
EUR 170 million

Washington D.C.                     77                                              26

Toronto                        55
                                                                 85%
Montreal                  38                    14

                                               investments                      sales price

                                               purchase price

                                                                                           5
interim report, January to June 2021

net letting and upgraded apartments

net letting EUR 9.3 million                upgraded apartments
January to June 2021                       54.6 percent

                63.1

                                                          1.4            2.1         54.6
                                             51.1

                             9.3
      -53.8

    move out   move in   net letting       Dec 31       sales and   like-for-like   Jun 30
                                            2020        purchases                    2021

development residential in-place rent
EUR million

                                                                          20           483
       453         -1           452           11           463

                                            2.3%

      Jul 1      sales          Jul 1      change          Jul 1       purchases       Jul 1
      2020                      2020                       2021                        2021

                                        like-for-like

6
interim report, January to June 2021

development vacancy rate, residential
percent

   7.8           -0.1           7.7             -1.4
                                                                    6.3              0.0            6.3

  Jul 1          sales       Jul 1             change               Jul 1       purchases          Jul 1
  2020                       2020                                   2021                           2021

                                             like-for-like

real vacancy rate, residential, 1.0 percent

                                                                               1.7
                          1.3                                1.4
                    1.0               1.1                              1.1                 1.0      1.1
                                                0.9
 0.7      0.7

2012      2013     2014   2015        2016     2017          2018     2019    2020         Jul 1   average
                                                                                           2021

                                                                                                           7
interim report, January to June 2021

property return 7.6 percent

percent

20
18
16
14
12
10
8
6
4
2
0
             2015        2016           2017         2018         2019       2020      2021
           Jan-Dec     Jan-Dec        Jan-Dec      Jan-Dec      Jan-Dec    Jan-Dec    Jan-Jun

            income return         value growth               average annual
                                                             property return

                                                                                   Growth Jan–Jun
                                                        EUR million                       percent
    Fair value, Jan 1, 2021                               12,139
    Revaluations                                              319                            2.6
    Investments                                               160                            1.3
    Purchases                                                 170                            1.4
    Sales                                                      -26                           0.2
    Exchange differences                                      198                            1.6
    Fair value, Jun 30, 2021                              12,960                            6.8
    Net operating income                                      136                            1.1
    Transaction cost                                             -1                          0.0
    Total property return                                    454                  Per annum: 7.6

capitalization rate 3.45 percent                       change in value EUR 319 million

                     Capitalization     Discount                                  EUR      Return,
    percent                    rate         rate                                million    percent
    Jan 1, 2021               3.28          5.26        Cash flow                1,078        8.88
    Purchases                  0.01         0.01        Required rate
    Sales                     0.00          0.00        of return                 -760       -6.26
    Like-for-like              0.14         0.14        Sales                        2        0.02
    Exchange                                            Purchases                   -1       -0.01
    difference                 0.02        0.02         Total change
    Jun 30, 2021               3.45        5.43         in value                  319        2.63

8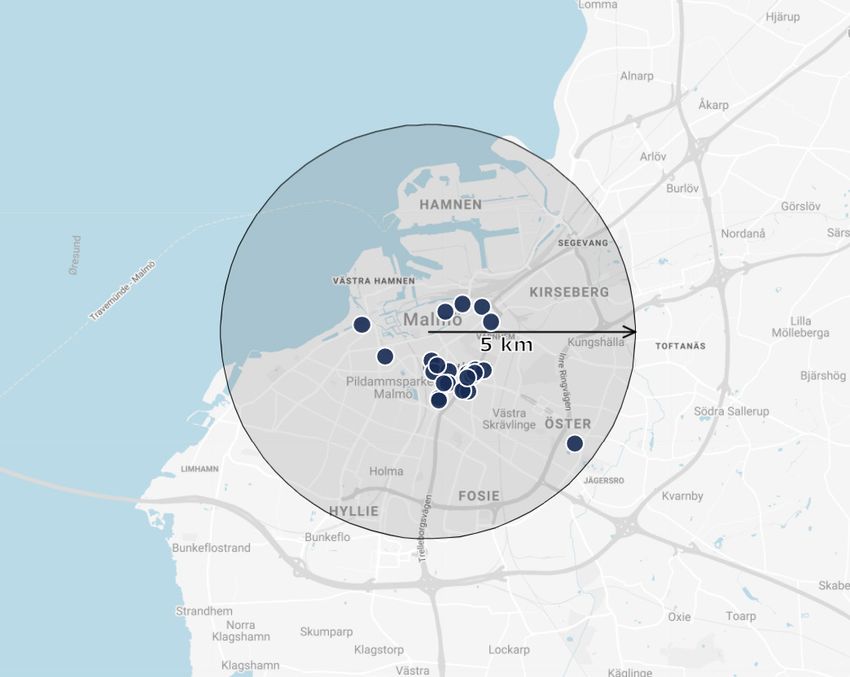
interim report, January to June 2021

financing

loan-to-value ratio                        equity and hybrid capital ratio
40 percent                                 50 percent

                                                      51                   50
                                                                 8                   8
      39                  40

      30                  32
                                                                 43               42

        9                  8

    Dec 31              Jun 30                   Dec 31                  Jun 30
     2020                2021                     2020                    2021

   unsecured loans                           hybrid bonds
   secured loans                             ordinary equity

interest expenses and liquidity            cash uses and sources
EUR million                                EUR million,
                                           12 months forward
                                                                         1,292

                                  1,084                                           208

               626

                                                                                  1,084

                                                268
                                                           50
   46                     46                               182
                                                           36
 Jan-Jun       Jun 30   Jan-Jun   Jun 30     cash uses                cash sources
  2020          2020     2021      2021
                                                                             profit before tax
   interest expenses                         investments
                                                                             and revaluation
   liquidity                                 short-term loans                liquidity
                                             contracted
                                             purchases

                                                                                            9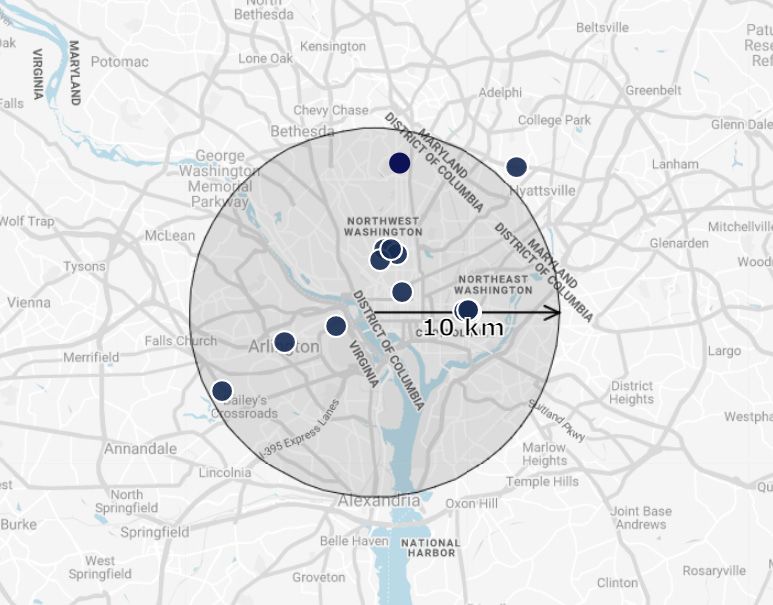
interim report, January to June 2021

financing

debt maturities                                               interest rate hedges
EUR million, year                                             EUR million, year
                                                                                                     2,902
                                                   2,586

                                                                                              890
                                802         775
             545     615                                       612
                                                                                526   475
182
                                                                       100

0–1          1–2     2–3        3–4         4–5     >5         0–1     1–2      2–3   3–4     4–5     >5

fixed interest terms 5.4 years                                interest rate 1.68 percent
debt maturities 6.0 years

                                                        6.0
       5.6          5.7                     5.7
 5.3                            5.4               5.4
                                      5.0
              4.5         4.5

                                                              2.58      2.64
                                                                                  2.25
                                                                                             1.95
                                                                                                     1.68

 Dec 31       Dec 31      Dec 31 Dec 31           Jun 30      Dec 31   Dec 31     Dec 31    Dec 31   Jun 30
  2017         2018        2019   2020             2021        2017     2018       2019      2020     2021

     debt maturities
     fixed interest term

10
interim report, January to June 2021
financing
EBITDA EUR 231 million interest coverage ratio 2.8
302
realized value growth
236 231 adjusted EBITDA
227 221
7.8
5.8
3.3 3.3
2.8 2.8
0.8
1.0
2.5 2.5 3.3
1.8 2.0
2018 2019 2020 Jul 2020- earning 2018 2019 2020 Jul 2020- earning
Jun 2021 capacity2 Jun 2021 capacity2
current interest and debt coverage capacity
Earning
Jul 2020- capacity as at
EUR million Jun 2021 Jun 30, 20212
Rental income 483 5543
Operating expenses -187 -189
Maintenance -32 -33
Net operating income 264 332
Central administrative expenses -33 -31
Other income and expenses - 1
EBITDA 231 302
Other financial income and expenses -131 -5
Adjusted EBITDA 218 297
Net interest expenses -86 -89
Interest coverage ratio excluding realized value growth 2.5 3.3
Realized value growth 22 -
Interest coverage ratio 2.8 -
Net debt as at Jun 30, 2021 5,279 5,279
Net debt/EBITDA 22.9 17.5
Net debt/EBITDA including realized value growth 20.9 -
1) EUR 10 million is a one-off cost to redeem a bond.
2) the earnings capacity is based on the property portfolio as at Jun 30, 2021.
It includes the property portfolio’s gross rent minus real vacancy, estimated operating expenses,
maintenance costs and central administration during a normal year.
3) includes EUR 482 million in residential rental value as at Jul 1, 2021, EUR 39 million in rental
income for commercial properties and parking, EUR -7 million in real vacancy for apartments and
EUR 40 million in other income. Residential rental value of EUR 482 million minus vacancy and plus
debiting of operating expenses is equivalent to EUR 483 million in residential in-place rent.
11interim report, January to June 2021
financing
encumbered properties adjusted unencumbered
EUR million
asset ratio
12,960
2.31 2.35 2.25
5,589 2.04 1.98
0.44 0.46 0.41
4,094 0.41 0.24
3,277
1.63 1.74 1.87 1.89 1.84
Scandi- Europe North Total 2017 2018 2019 2020 Jun 30
navia America 2021
unencumbered unencumbered asset ratio
encumbered unutilized part of credit facilities
carrying value and fair value of interest-bearing liabilities
2021 2021 2020 2020
Jun 30 Jun 30 Dec 31 Dec 31
EUR million Carrying value Fair value Carrying value Fair value
Loans 5,505 5,606 5,043 5,178
Hybrid bonds 999 1,032 999 1,038
Total 6,504 6,639 6,042 6,216
Carrying value and fair value of outstanding Compared to 2020, no transfers have been
derivatives and interest-bearing liabilities made between different levels in the fair value
excluding leasing are shown in the tables. hierarchy for derivatives and borrowings
and no significant change has been made to
Derivatives are measured continuously at fair
valuation techniques.
value through profit or loss.
Financial instruments that are not measured
at fair value through profit and loss are derivatives recorded at fair value
recognized at amortized cost using the
effective interest rate method.
2021 2020
The fair values of bonds are based on level 1, EUR million Jun 30 Dec 31
and the fair values of derivatives and other
Assets 8 14
interest-bearing liabilities are based on level 2
Liabilities 54 96
in the fair value hierarchy.
12interim report, January to June 2021
Berlin Hamburg
like-for-like properties sold properties 2021
Berlin Hamburg
Property portfolio
Fair value, EUR million 3,263 930
Capitalization rate, percent 2.84 3.36
Proportion upgraded apartments, percent 43 57
Residential rentable area, thousand sqm 881 196
Commercial rentable area, thousand sqm 55 11
Average apartment size, sqm 63 55
Walk score 91 91
Average rent residential EUR/sqm/month EUR/sqm/month
Total portfolio Jul 1, 2020 9.41 12.22
Exchange difference - -
Adjusted total portfolio Jul 1, 2020 9.41 12.22
Sales and ended units 0.01 -0.01
Like-for-like Jul 1, 2020 9.42 12.21
Like-for-like change 0.02 0.15
– Change in percent 0.2 1.3
Like-for-like Jul 1, 2021 9.44 12.36
Purchases and new constructions 0.02 0.03
Total portfolio Jul 1, 2021 9.46 12.39
New lease level 12.41 15.31
Vacancy rate residential percent percent
Real vacancy rate 0.6 0.7
Apartments being upgraded 1.5 3.7
Vacancy rate 2.1 4.4
13interim report, January to June 2021
London Paris
like-for-like properties
London Paris
Property portfolio
Fair value, EUR million 959 437
Capitalization rate, percent 4.13 4.03
Proportion upgraded apartments, percent 75 40
Residential rentable area, thousand sqm 85 48
Commercial rentable area, thousand sqm 19 5
Average apartment size, sqm 41 31
Walk score 86 97
Average rent residential EUR/sqm/month EUR/sqm/month
Total portfolio Jul 1, 2020 34.42 26.45
Exchange difference 1.75 -
Adjusted total portfolio Jul 1, 2020 36.17 26.45
Sales and ended units - -
Like-for-like Jul 1, 2020 36.17 26.45
Like-for-like change -1.82 0.61
– Change in percent -5.0 2.3
Like-for-like Jul 1, 2021 34.35 27.06
Purchases and new constructions - 0.08
Total portfolio Jul 1, 2021 34.35 27.14
New lease level 35.36 34.77
Vacancy rate residential percent percent
Real vacancy rate 1.6 2.8
Apartments being upgraded 10.4 27.8
Vacancy rate 12.0 30.6
14interim report, January to June 2021
Stockholm Malmö
like-for-like properties
Stockholm Malmö
Property portfolio
Fair value, EUR million 1,841 1,092
Capitalization rate, percent 2.63 3.10
Proportion upgraded apartments, percent 57 59
Residential rentable area, thousand sqm 424 267
Commercial rentable area, thousand sqm 34 83
Average apartment size, sqm 71 65
Walk score 71 91
Average rent residential EUR/sqm/month EUR/sqm/month
Total portfolio Jul 1, 2020 10.96 11.38
Exchange difference 0.35 0.36
Adjusted total portfolio Jul 1, 2020 11.31 11.74
Sales and ended units - -
Like-for-like Jul 1, 2020 11.31 11.74
Like-for-like change 0.22 0.15
– Change in percent 2.0 1.2
Like-for-like Jul 1, 2021 11.53 11.89
Purchases and new constructions 0.01 0.01
Total portfolio Jul 1, 2021 11.54 11.90
New lease level 12.97 12.80
Vacancy rate residential percent percent
Real vacancy rate 0.0 0.0
Apartments being upgraded 1.3 0.2
Vacancy rate 1.3 0.2
15interim report, January to June 2021
Copenhagen New York
like-for-like properties
Copenhagen New York
Property portfolio
Fair value, EUR million 344 860
Capitalization rate, percent 2.98 4.27
Proportion upgraded apartments, percent 42 48
Residential rentable area, thousand sqm 82 118
Commercial rentable area, thousand sqm 6 4
Average apartment size, sqm 80 68
Walk score 95 96
Average rent residential EUR/sqm/month EUR/sqm/month
Total portfolio Jul 1, 2020 12.10 28.86
Exchange difference 0.03 -1.66
Adjusted total portfolio Jul 1, 2020 12.13 27.20
Sales and ended units - 0.01
Like-for-like Jul 1, 2020 12.13 27.21
Like-for-like change -0.26 -0.25
– Change in percent -2.2 -0.9
Like-for-like Jul 1, 2021 11.87 26.96
Purchases and new constructions - 0.03
Total portfolio Jul 1, 2021 11.87 26.99
New lease level 17.23 38.81
Vacancy rate residential percent percent
Real vacancy rate 0.4 1.2
Apartments being upgraded 2.6 10.2
Vacancy rate 3.0 11.4
16interim report, January to June 2021
Boston Washington D.C.
like-for-like properties
Boston Washington D.C.
Property portfolio
Fair value, EUR million 560 680
Capitalization rate, percent 4.25 4.69
Proportion upgraded apartments, percent 79 78
Residential rentable area, thousand sqm 65 175
Commercial rentable area, thousand sqm 2 4
Average apartment size, sqm 63 82
Walk score 90 90
Average rent residential EUR/sqm/month EUR/sqm/month
Total portfolio Jul 1, 2020 37.07 24.22
Exchange difference -2.13 -1.40
Adjusted total portfolio Jul 1, 2020 34.94 22.82
Sales and ended units - -
Like-for-like Jul 1, 2020 34.94 22.82
Like-for-like change -0.07 0.54
– Change in percent -0.2 2.4
Like-for-like Jul 1, 2021 34.87 23.36
Purchases and new constructions - -3.39
Total portfolio Jul 1, 2021 34.87 19.97
New lease level 36.10 22.80
Vacancy rate residential percent percent
Real vacancy rate 4.6 3.3
Apartments being upgraded 12.7 9.1
Vacancy rate 17.3 12.4
17interim report, January to June 2021
Toronto Montreal
like-for-like properties acquired properties 2021
Toronto Montreal
Property portfolio
Fair value, EUR million 1,024 970
Capitalization rate, percent 3.50 4.30
Proportion upgraded apartments, percent 58 57
Residential rentable area, thousand sqm 198 268
Commercial rentable area, thousand sqm 5 7
Average apartment size, sqm 52 67
Walk score 77 83
Average rent residential EUR/sqm/month EUR/sqm/month
Total portfolio Jul 1, 2020 17.43 12.47
Exchange difference 0.62 0.44
Adjusted total portfolio Jul 1, 2020 18.05 12.91
Sales and ended units - 0.00
Like-for-like Jul 1, 2020 18.05 12.91
Like-for-like change 0.09 0.54
– Change in percent 0.5 4.2
Like-for-like Jul 1, 2021 18.14 13.45
Purchases and new constructions -0.45 0.14
Total portfolio Jul 1, 2021 17.69 13.59
New lease level 23.77 15.79
Vacancy rate residential percent percent
Real vacancy rate 1.9 1.8
Apartments being upgraded 4.9 14.0
Vacancy rate 6.8 15.8
18interim report, January to June 2021
result
rental income EUR 250 million Net operating income margin was
54.5 percent (54.7).
Rental income was EUR 250 million (238), Adjusted net operating income margin
an increase of 5.2 percent compared to the was 68.6 percent (67.9).
same period in 2020.
EUR 7 million is related to acquisitions.
EUR 4 million relates to income from the EBITDA EUR 121 million
correction of the Berlin rent cap for 2020. EBITDA was EUR 121 million (110),
Germany's highest court overturned the Berlin an increase of 9.8 percent compared to the
rent cap in April. same period in 2020.
Like-for-like growth in rental income was The change is mainly due to increased rental
EUR 1 million (13) or 0.2 percent (6.3). income,
The like-for-like rental income was affected by which is due to acquisitions and one-time
discounts and lower lease levels, effects of the abolished rent cap in Berlin.
offered to avoid vacancies primarily in the The table of development of EBITDA can be
United States and in London due to COVID-19 found on page 36.
effects.
During the period, net financial items EUR -58 million
7,436 rental contracts (14,041) with an annual
Interest expenses were EUR -46 million (-46)
rent of EUR 130 million (156) were renewed or
and interest income was EUR 1 million (0).
renegotiated.
The new yearly rent is EUR 131 million (159), Interest expenses for the hybrid bonds were
an increase of 0.9 percent (2.2). EUR -15 million (-14).
The vacancy rate for residential units Revaluations of financial derivatives affected
decreased by 1.5 percentage points to earnings by EUR 15 million (-43).
6.3 percent (7.8) compared to end of June Other financial income and expenses
2020. amounted to EUR -13 million (-3).
This is mainly due to fewer apartments being An early redemption of a bond generated a
upgraded. premium cost of EUR 10 million reported as an
84 percent (84) of vacancy was due to other financial expense.
upgrades or planned sale of apartments.
The real vacancy rate decreased by profit before tax EUR 375 million
0.7 percentage points during 2021 to Profit before tax was EUR 375 million (53).
1.0 percent (1.3). The increase in the fair value of properties and
derivatives had a positive impact on the profit
net operating income of EUR 330 million.
EUR 136 million
Net operating income was
tax expenses EUR 100 million
EUR 136 million (130). Tax expenses totaled EUR 100 million (17).
EUR 97 million (11) was deferred tax,
Property expenses totaled
mainly due to unrealized gain on change in
EUR 114 million (108).
value of properties.
EUR 17 million (13) was attributable to
maintenance,
corresponding to EUR 11 (9) per square meter
per year.
Like-for-like growth in net operating income
was -1.3 percent (10.3).
19interim report, January to June 2021
property portfolio
fair value EUR 12,960 million property purchases
The fair value was EUR 12,960 million EUR 170 million
(11,986), which is equivalent to an average of Property purchases amounted to
EUR 4,261 (4,053) per square meter. EUR 170 million (44) during the period.
The average capitalization rate was The purchased properties are located in
3.45 percent (3.33), Montreal, Toronto, and Washington D.C.
compared to 3.28 percent at year-end 2020. The capitalization rate for the purchased
The increase is mainly due to higher property was 4.14 percent (4.68).
capitalization rates in Berlin.
Due to the abolition of the rent cap in Berlin,
rental income and capitalization rate have
property sales EUR 26 million
been adjusted upwards significantly with In total, Akelius sold properties for
respect to Berlin. EUR 26 million (123).
Fair value has not been significantly adjusted Sales took place in Germany.
for Berlin,
pending on a visible market reaction.
Refer to table on page 8.
increase in property value
2.6 percent
The increase in property value was
EUR 319 million (55), or 2.6 percent (0.5).
Refer to table on page 8.
property investments
EUR 160 million
Investments in properties amounted to
EUR 160 million (202).
On an annual basis,
this corresponds to EUR 107 (142) per square
meter.
11 percent (23) of the total investments were
due to apartment upgrades.
In line with the new strategy,
Akelius completes planned projects and limits
the start-up of new comprehensive projects.
20interim report, January to June 2021
financing
equity and hybrid capital ratio interest rate hedge 5.4 years
50 percent EUR 2,902 million (1,871) had a fixed interest
Equity increased by EUR 246 million to rate term of more than five years and
EUR 5,620 million (5,358) during the period. EUR 612 million (575) had a fixed interest rate
The increase is mainly due to the properties term of less than one year.
fair value development and changes in the On average, the underlying interest rate is
Group’s currency translation reserve. secured for 5.4 years (4.4),
The equity and hybrid capital ratio amounted compared to 5.0 years at the end of 2020.
to 50 percent (52).
average interest rate 1.68 percent
loan-to-value ratio 40 percent During the period the average interest rate
Loans excluding the hybrid bonds increased by decreased from 1.95 to 1.68 percent (2.18).
EUR 462 million during the period, Debt with high interest rate has been replaced
to EUR 5,505 million (4,590). by debt with lower interest rate.
The loan-to-value ratio increased by
1 percentage point since the end of 2020 to liquidity EUR 1,084 million
40 percent (37). Available funds in the form of cash, liquid
Secured loans were EUR 1,289 million (1,583), financial assets, and unutilized credit facilities
compared to EUR 1,357 million at the end of totaled EUR 1,084 million (626).
2020. Unutilized credit facilities amounted to
Secured loan-to-value ratio was EUR 849 million (584) with an average
8 percent (13), maturity of 1.7 years (1.4).
1 percentage point lower than at the end of Facilities intended to be kept are extended at
previous year. least one year prior maturity.
The secured debt was borrowed from The unutilized bilateral credit agreements are
19 banks (23) in five countries. provided by 7 banks (7).
Unsecured debt includes 13 bonds (11) The fair value of the unencumbered properties
and loans from large investors and related was EUR 7,148 million (5,912).
companies. An increase due to the shift from secured to
more unsecured funding.
debt maturities 6.0 years
Loans have an average maturity of adjusted unencumbered asset
6.0 years (5.1), ratio 2.25
compared to 5.7 at the end of 2020. The unencumbered asset ratio was 1.84
EUR 182 million (435) mature within one year. compared to 1.89 at the end of 2020.
The adjusted unencumbered asset ratio
amounted to 2.25 and includes pledge
properties where the counterparty has no
claim.
21interim report, January to June 2021
other financial information
cash flow credit rating
Operating cash flow before change in working In 2021, Standard and Poor’s confirmed the
capital was EUR 60 million (57). investment grade rating BBB with a stable
outlook for Akelius’ and its senior unsecured
Cash flow from investing activities was
debt.
EUR -292 million (-218).
The rating for Akelius’ hybrid bonds is BB+.
Cash required for the acquisition of properties
is secured before the agreements are signed. In 2021, Fitch Ratings assigned Akelius a
On average, upgrades can be stopped within a long-term issuer default rating of BBB.
three-month period. Akelius’ senior unsecured bonds received the
sector specific one-notch uplift to BBB+.
Cash flow from financing activities was
Akelius’ hybrid bonds are graded BBB-.
EUR 230 million (170).
parent company second quarter
Profit before tax amounted to
Dividend of EUR 0.0375 per class A ordinary
EUR 222 million (28).
share was paid on May 12, 2021
Net income for the change in fair value of
totaling EUR 120 million.
properties impacted the profit with
Dividends of EUR 0.025 per class D ordinary
EUR 204 million (12).
share were or will be paid five banking days
Rental income was EUR 125 million (119).
from the record dates pursuant to the Articles
Property expenses totaled EUR 56 million
of Association: May 5, 2021, August 5, 2021,
(53).
November 5, 2021 and February 5, 2022,
Net operating income was EUR 69 million (66).
totaling EUR 22 million.
Net financial items totaled
The profit before tax was EUR 42 million (-27). EUR -40 million (-37).
Financial income mainly includes interest Cash flow amounted to EUR 208 million (-30).
income, currency exchange effects related Cash flow generated from operations was
to currency derivatives, bonds and other EUR 35 million (78).
financial instruments in foreign currency. Net cash from investing activities amounted to
Financial costs mainly include interest EUR -166 million (-67).
expenses, change in derivatives, and financial Financing activities had a positive effect on
exchange differences. cash flow of EUR 339 million (-41).
D-shares staff
The number of ordinary shares of 1,247 people (1,486) were employed as at
class D was 220,000,000, June 30,
equivalent to EUR 357 million reported in compared to 1,300 at the end of 2020.
equity.
D-shares represent 6.45 percent of the total related party transactions
number of shares in Akelius Residential Net debt from related parties increased by
Property AB. EUR 11 million (-16).
On June 30, 2021, the closing price The circle of related parties has not changed
per D-share was EUR 1.63. significantly since the annual report 2020.
significant events after the
reporting period
There are no significant events after the end of
the reporting period.
22interim report, January to June 2021
consolidated income statement
2021 2020 2021 2020 2020
Jan–Jun Jan–Jun Apr–Jun Apr–Jun Jan–Dec
EUR million 6 months 6 months 3 months 3 months 12 months
Rental income 250 238 125 119 471
Operating expenses -97 -95 -48 -46 -184
Maintenance -17 -13 -8 -7 -28
Net operating income 136 130 69 66 259
Central administrative expenses -15 -19 -8 -10 -37
Other income and expenses - -1 - -1 -1
EBITDA 121 110 61 55 221
Depreciation and operational foreign
exchange differences -4 -4 -3 -2 -10
Realized revaluation of investment
properties* 1 - 1 - 6
Unrealized revaluation of investment
properties* 315 53 203 12 24
Restructuring expenses - - - - -14
Operating profit 433 159 262 65 227
Interest income 1 - - - 1
Interest expenses -46 -46 -23 -22 -88
Interest expenses hybrid bonds -15 -14 -8 -8 -29
Other financial income and expenses -13 -3 -1 1 -4
Change in fair value of derivatives 15 -43 -8 -8 -35
Profit before tax 375 53 222 28 72
Current tax -3 -6 -1 -5 -13
Deferred tax -97 -11 -60 -4 57
Profit for the period 275 36 161 19 116
Profit attributable to
–owners of the Parent Company 267 36 154 19 112
–non-controlling interests 8 - 7 - 4
Earnings per share before and after
dilution, EUR 0.08 0.01 0.05 0.01 0.03
*) net income from the revaluation and disposal for Jan-Jun 2021 includes change in fair value of
properties of EUR 319 million (55) minus transaction cost of EUR 1 million (2),
and minus revaluation reserve for owner-occupied properties of EUR 3 million (-)
23interim report, January to June 2021
consolidated statement of comprehensive income
2021 2020 2021 2020 2020
Jan–Jun Jan–Jun Apr–Jun Apr–Jun Jan–Dec
EUR million 6 months 6 months 3 months 3 months 12 months
Profit for the period 275 36 161 19 116
Items that may be reclassified
to profit or loss
Translation differences 186 -139 8 82 -218
Hedge of net investments -68 57 -8 -50 50
Revaluation reserve* 3 - 3 - 1
Tax on items that may be
reclassified -8 1 3 14 24
Other comprehensive income
for the period 113 -81 6 46 -143
Total comprehensive income for
the period 388 -45 167 65 -27
Total comprehensive income
attributable to
–owners of the Parent Company 380 -45 160 65 -31
–non-controlling interests 8 - 7 - 4
*) the revaluation reserve consists of owner-occupied properties
24interim report, January to June 2021
condensed consolidated statement of financial
position
2021 2020 2020
EUR million Jun 30 Jun 30 Dec 31
Assets
Intangible assets 25 23 23
Investment properties 12,886 11,875 12,021
Owner-occupied properties 74 75 100
Right-of-use-assets* 11 16 14
Tangible fixed assets 5 5 5
Derivatives 5 1 4
Deferred tax assets 2 2 4
Financial assets 6 5 5
Total non-current assets 13,014 12,002 12,176
Receivables and other assets 96 120 109
Derivatives 3 8 10
Cash and cash equivalents 225 31 250
Assets held for sale - 36 18
Total current assets 324 195 387
Total assets 13,338 12,197 12,563
Equity attributable to the Parent Company’s
shareholders 5,530 5,278 5,292
Non-controlling interests 90 80 82
Total equity 5,620 5,358 5,374
Unsecured loans 4,053 2,687 3,533
Secured loans 1,270 1,468 1,277
Hybrid bonds 999 999 999
Lease liabilities 10 13 12
Derivatives 44 88 75
Deferred tax liabilities 976 945 869
Provisions 1 - 1
Other liabilities 17 17 16
Total non-current liabilities 7,370 6,217 6,782
Unsecured loans 163 320 153
Secured loans 19 115 80
Lease liabilities 2 2 2
Derivatives 10 2 21
Provisions 7 3 8
Other liabilities 147 176 140
Liabilities held for sale - 4 3
Total current liabilities 348 622 407
Total equity and liabilities 13,338 12,197 12,563
*) EUR 6 million (10) for leased offices and EUR 5 million (6) for site leasehold agreements
25interim report, January to June 2021
consolidated statement of changes in equity
Attributable to the Parent Company’s
shareholders
Currency Non-
trans- con-
Share Share lation Retained trolling Total
EUR million capital premium reserve earnings Total interests equity
Balance at
Dec 31, 2019 199 1,102 -155 4,295 5,441 85 5,526
Total comprehensive
income for the period - - -81 36 -45 - -45
Dividend - - - -118 -118 - -118
Divestment of minority - - - - - -5 -5
Balance at
Jun 30, 2020 199 1,102 -236 4,213 5,278 80 5,358
Total comprehensive
income for the period - - -62 76 14 4 18
Other transactions with
minority - - - - - -2 -2
Balance at
Dec 31, 2020 199 1,102 -298 4,289 5,292 82 5,374
Profit for the period - - - 267 267 8 275
Other comprehensive
income - - 111 2 113 - 113
Total
comprehensive
income for the period - - 111 269 380 8 388
Dividend - - - -142 -142 - -142
Balance at
Jun 30, 2021 199 1,102 -187 4,416 5,530 90 5,620
26interim report, January to June 2021
consolidated statement of cash flows
2021 2020 2021 2020 2020
Jan–Jun Jan–Jun Apr–Jun Apr–Jun Jan–Dec
EUR million 6 months 6 months 3 months 3 months 12 months
Net operating income 136 130 69 66 259
Central administrative expenses -15 -19 -8 -10 -37
Restructuring expenses - - - - -14
Other income and expenses - - - - -
Interest paid -60 -52 -21 -13 -114
Income tax paid -1 -2 -1 2 -6
Cash flow before changes in
working capital 60 57 39 45 88
Change in current assets -12 -4 2 27 14
Change in current liabilities -11 7 -6 6 10
Cash flow from
operating activities 37 60 35 78 112
Investments in intangible assets -4 -6 -2 -3 -11
Investments in properties -160 -202 -84 -85 -381
Acquisition of properties1 -171 -43 -155 -25 -169
Acquisition of other assets -1 -18 57 1 -36
Sale of properties2 26 44 16 38 84
Sale of other assets3 18 7 2 7 10
Cash flow from
investing activities -292 -218 -166 -67 -503
Transaction with minority - -5 - -2 -5
Loans raised 1,276 1,083 693 190 2,320
Repayment of loans -839 -813 -201 -73 -1,586
Settlement of derivatives -75 9 -28 -53 9
Amortization leasing -1 -2 - -1 -3
Dividend A-shares -120 -96 -120 -96 -96
Dividend D-shares -11 -6 -5 -6 -17
Cash flow from
financing activities 230 170 339 -41 622
Cash flow for the period -25 12 208 -30 231
Cash and cash equivalents at the
beginning of the period 250 19 17 61 19
Translation differences in cash and
cash equivalents - - - - -
Cash and cash equivalents at the
end of the period 225 31 225 31 250
Jan‒Jun 2021
1) EUR -170 million for acquisitions in North America and EUR -1 million for prepayments for future
acquisitions
2) EUR 26 million related to sales in Germany
3) EUR 14 million for the sale of bonds and EUR 4 million for the sale of condominiums in Sweden
27interim report, January to June 2021
segment information
Total Net
Realized prop- operat-
Operat- Net and Total erty ing
ing operat- unrealized proper- return, income Proper-
Jan–Jun 2021, Rental expens- Mainte- ing reval- ty per- margin, ty fair
EUR million income es nance income uation return cent percent value
Berlin 70 -22 -3 45 172 217 14.6 63.4 3,263
London 16 -5 -1 10 -11 -1 -0.3 62.6 959
Hamburg 18 -6 -1 11 84 95 23.5 62.9 930
Paris 6 -4 - 2 1 3 1.4 31.0 437
Europe 110 -37 -5 68 246 314 12.2 61.4 5,589
Stockholm 32 -12 -2 18 71 89 10.3 55.3 1,841
Malmö 24 -9 -3 12 34 46 9.3 53.9 1,092
Copenhagen 6 -2 - 4 8 12 7.1 59.5 344
Scandinavia 62 -23 -5 34 113 147 9.6 55.2 3,277
Toronto 19 -9 -2 8 3 11 2.6 45.1 1,024
Montreal 18 -8 -1 9 4 13 3.0 49.6 970
New York 16 -9 -2 5 -50 -45 -10.1 32.3 860
Washington D.C. 16 -8 -1 7 - 7 2.6 43.9 680
Boston 9 -3 -1 5 2 7 2.5 49.7 560
North
America 78 -37 -7 34 -41 -7 -0.4 43.8 4,094
Total 250 -97 -17 136 318 454 7.6 54.5 12,960
28interim report, January to June 2021
segment information, continued
Net
Realized Total operat-
Operat- Net and Total proper- ing
ing operat- unrealized proper- ty income Proper-
Jan–Jun 2020, Rental expens- Mainte- ing reval- ty return, margin, ty fair
EUR million income es nance income uation return percent percent value
Berlin 63 -22 -3 38 1 39 2.5 59.4 3,061
London 17 -5 -1 11 -7 4 0.8 66.5 896
Hamburg 18 -6 -1 11 17 28 7.0 61.3 842
Paris 5 -4 - 1 5 6 3.2 18.4 420
Other 1 -1 - - - - -0.1 9.7 31
Europe 104 -38 -5 61 16 77 2.9 58.4 5,250
Stockholm 30 -11 -2 17 3 20 2.5 56.7 1,674
Malmö 22 -8 -2 12 -5 7 1.5 55.7 976
Copenhagen 6 -2 - 4 2 6 3.3 58.7 330
Scandinavia 58 -21 -4 33 - 33 2.2 56.5 2,980
Toronto 18 -9 -1 8 7 15 3.5 47.1 897
Montreal 17 -8 -1 8 25 33 8.2 48.6 847
New York 18 -9 -1 8 2 10 2.1 43.8 972
Washington D.C. 11 -5 -1 5 1 6 2.8 47.2 468
Boston 12 -5 - 7 2 9 3.2 55.7 572
North
America 76 -36 -4 36 37 73 4.1 48.0 3,756
Total 238 -95 -13 130 53 183 3.1 54.7 11,986
29interim report, January to June 2021
key figures 2021 2020 2019 2018 2017
Jun 30 Dec 31 Dec 31 Dec 31 Dec 31
Equity
Equity, EUR million 5,620 5,374 5,526 5,370 4,901
Equity ratio, percent 42 43 45 43 46
Equity and hybrid capital ratio, percent 50 51 50 47 46
Return on equity, percent 7 - 8 9 19
Net asset value, EUR million 6,640 6,324 6,533 6,284 5,840
Net operating income
Rental income, EUR million 250 471 496 482 469
Growth in rental income, percent 5.2 -5.0 2.7 2.8 -0.6
Like-for-like growth in rental income,
percent 0.2 3.6 5.7 3.2 5.1
Net operating income, EUR million 136 259 260 260 252
Growth in net operating income, percent 4.7 -0.5 -1.3 3.3 4.4
Like-for-like growth in net operating
income, percent -1.3 8.4 2.9 5.1 10.7
Net operating income margin, percent 54.5 54.9 52.4 53.9 53.6
Adjusted net operating income margin,
percent* 68.6 68.2 65.2 69.7 61.4
Financing
Loan-to-value ratio, secured loans, percent 8 9 14 19 18
Loan-to-value ratio, percent 40 39 40 44 44
Unencumbered asset ratio 1.84 1.89 1.87 1.74 1.63
Interest coverage ratio 12 months 2.8 3.3 7.8 2.8 4.7
Interest coverage ratio excluding realized
value growth 12 months 2.5 2.5 2.0 1.8 1.9
Average interest rate, percent 1.68 1.95 2.25 2.64 2.58
Fixed interest term, years 5.4 5.0 4.5 4.5 5.3
Debt maturities, years 6.0 5.7 5.4 5.7 5.6
Properties
Number of apartments 45,029 44,443 44,226 50,407 47,177
Rentable area, thousand sqm 3,042 2,986 2,968 3,422 3,228
Rent potential, percent 48 24 55 56 50
Real vacancy rate, residential, percent 1.0 1.7 1.1 1.4 0.9
Vacancy rate, residential, percent 6.3 7.5 8.6 9.6 6.6
Turnover of tenants, percent 18 16 15 15 14
Fair value, EUR per sqm 4,261 4,066 4,031 3,617 3,292
In-place rent, all unit types, EUR million 523 473 485 516 484
Capitalization rate, percent 3.45 3.28 3.67 3.67 3.60
Like-for-like change in capitalization rate,
percentage points 0.14 -0.38 0.00 0.02 -0.22
Opening balance fair value, EUR million 12,139 11,964 12,379 10,624 9,171
Change in fair value, EUR million 319 34 423 553 886
Investments, EUR million 160 381 468 349 288
Purchases, EUR million 170 172 181 1,286 1,297
Sales, EUR million -26 -185 -1,616 -300 -737
Exchange differences, EUR million 198 -227 129 -133 -281
Closing balance fair value, EUR million 12,960 12,139 11,964 12,379 10,624
*) adjustment for revenue from operating expenses invoiced to the tenants in Germany, France,
Canada, United States and Sweden amounted to EUR 51 million (46) for Jan–Jun 2021
30interim report, January to June 2021
condensed income statement for the
Parent Company
2021 2020 2021 2020 2020
Jan–Jun Jan–Jun Apr–Jun Apr–Jun Jan–Dec
EUR million 6 months 6 months 3 months 3 months 12 months
Central administrative expenses -5 -3 -3 -2 -9
Restructuring expenses - - - - -1
Operating profit -5 -3 -3 -2 -10
Financial income 106 93 16 -9 205
Financial expenses -76 -70 -32 -34 -244
Change in the fair value of
derivatives 17 -47 -10 -24 -39
Profit before appropriations 42 -27 -29 -69 -88
Appropriations - - - - 29
Profit before tax 42 -27 -29 -69 -59
Tax -8 -1 8 13 22
Profit for the period 34 -28 -21 -56 -37
The Parent Company has no items in other comprehensive income.
31interim report, January to June 2021
condensed balance sheet for the
Parent Company
2021 2020 2020
EUR million Jun 30 Jun 30 Dec 31
Shares in Group companies 2,665 2,629 2,665
Receivables from Group companies 4,738 4,222 4,369
Other receivables 5 6 5
Derivatives 5 1 4
Deferred income tax assets 58 44 66
Total non-current assets 7,471 6,902 7,109
Receivables from Group companies 71 37 57
Derivatives 3 8 10
Prepaid expenses and accrued income from Group
companies 32 76 -
Other assets 29 47 53
Cash and cash equivalents 209 15 211
Total current assets 344 183 331
Total assets 7,815 7,085 7,440
Restricted equity 202 202 202
Non-restricted equity 874 984 981
Total equity 1,076 1,186 1,183
Interest-bearing liabilities 2,962 3,888 3,533
Interest-bearing liabilities from Group companies 3,033 942 1,970
Derivatives 43 81 70
Total non-current liabilities 6,038 4,911 5,573
Interest-bearing liabilities 146 297 148
Interest-bearing liabilities from Group companies 481 597 460
Derivatives 10 18 21
Other current liabilities 56 70 53
Other current liabilities from Group companies 8 6 2
Total current liabilities 701 988 684
Total equity and liabilities 7,815 7,085 7,440
32interim report, January to June 2021
alternative performance measures
Calculation of alternative key figures using guidelines published by the European Securities and
Markets Authority.
net asset value and loan-to-value ratio
2021 2020 2020
EUR million Jun 30 Jun 30 Dec 31
Equity 5,620 5,358 5,374
Deferred tax 974 943 865
Deferred taxes reported as liability for sale - 4 3
Derivatives 46 81 82
Net asset value 6,640 6,386 6,324
Total interest-bearing liabilities 6,504 5,589 6,042
Hybrid bonds -999 -999 -999
Cash and cash equivalents -225 -31 -250
Pledged cash assets -1 - -1
Net debt 5,279 4,559 4,792
Total assets 13,338 12,197 12,563
Cash and cash equivalents -225 -31 -250
Pledged cash assets -1 - -1
Net asset 13,112 12,166 12,312
Loan-to-value ratio, percent 40 37 39
Net debt 5,279 4,559 4,792
Less senior unsecured debt -4,216 -3,007 -3,686
Secured debt minus pledged cash,
cash and cash equivalents 1,063 1,552 1,106
Net asset 13,112 12,166 12,312
Loan-to-value ratio, secured loan, percent 8 13 9
average interest rate
2021 2020 2020
EUR million Jun 30 Jun 30 Dec 31
Interest-bearing liabilities excluding hybrid bonds 5,505 4,590 5,043
Interest cost based on interest at June 30 93 100 98
Average interest rate 1.68 2.18 1.95
33interim report, January to June 2021
alternative performance measures, continued
unencumbered asset ratio
2021 2020 2020
EUR million Jun 30 Jun 30 Dec 31
Intangible assets 25 23 23
Unencumbered properties 7,148 5,912 6,324
Right-of-use-assets 11 16 14
Tangible fixed assets 5 5 5
Deferred tax 2 2 4
Financial assets 6 5 5
Receivables and other assets 96 120 109
Derivatives 8 9 14
Unencumbered assets 7,301 6,092 6,498
Unsecured loans 4,216 3,007 3,686
Subordinated debt -17 -28 -6
Cash and cash equivalents -225 -31 -250
Net unsecured senior debt 3,974 2,948 3,430
Unencumbered asset ratio 1.84 2.07 1.89
Unutilized part of credit facilities 0.41 0.46 0.46
Adjusted unencumbered asset ratio 2.25 2.53 2.35
equity
2021 2020 2020
EUR million Jun 30 Jun 30 Dec 31
Comprehensive income for the year 387 -45 -27
Opening balance equity 5,374 5,526 5,526
Return on equity 7 -1 -
Equity 5,620 5,358 5,374
Hybrid bonds 999 999 999
Equity and hybrid bonds 6,619 6,357 6,373
Total asset 13,338 12,197 12,563
Equity ratio, percent 42 44 43
Equity and hybrid capital ratio, percent 50 52 51
liquidity
2021 2020 2020
EUR million Jun 30 Jun 30 Dec 31
Cash and cash equivalents 225 31 250
Unutilized credit facilities 849 584 844
Liquid financial assets 10 11 23
Liquidity 1,084 626 1,117
34interim report, January to June 2021
alternative performance measures, continued
rental income and net operating income growth for like-for-like properties
2021 2020 Growth
EUR million Jan–Jun Jan–Jun percent
Rental income 250 238 5.2
Purchases and sales -9 -3
Service revenue -18 -17
Berlin rent regulation correction -4 1
Exchange differences - -1
Like-for-like rental income 219 218 0.2
Net operating income 136 130 4.7
Purchases and sales -5 -2
Berlin rent regulation correction -4 1
Like-for-like net operating income 127 129 -1.3
adjusted net operating income
Adjustment Adjusted
2021 for other 2021
EUR million Jan–Jun services Jan–Jun
Rental income 250 -51 199
Operating expenses -97 51 -46
Maintenance -17 -17
Net operating income 136 - 136
Net operating income margin, percent 54.5 68.6
realized value growth
2021 2020 2020
EUR million Jun 30 Jun 30 Dec 31
Proceeds from the sale of properties 26 123 185
Costs of sale -1 -2 -4
Acquisition costs -9 -56 -93
Accumulated investments -5 -11 -23
Realized value growth 11 54 65
35interim report, January to June 2021
alternative performance measures, continued
development of EBITDA
Jun 2020–
EUR million Jun 2021
EBITDA 110
Like-for-like rental income 1
Like-for-like operating expenses and maintenance -3
Like-for-like net operating income -2
Purchase and sales rental income 7
Purchase and sales operating expenses and maintenance -3
Purchase and sales net operating income 4
Berlin rent regulation correction 4
Central administrative expenses 4
Other income and expenses 1
EBITDA 121
36interim report, January to June 2021
other information
basis of presentation The Group has changed the presentation of the
Group’s consolidated statement of cash flow
The Akelius Residential Property Group’s from 2021.
year-end report has been prepared in Transactions related to acquisition of
accordance with IAS 34, Interim Financial properties and sale of properties are presented
Reporting and the Swedish Annual Accounts on one row each instead of on several rows in
Act. the cash flow related to investing activities.
The financial statements of the Parent
Company, Akelius Residential Property AB, The presentation of the Group’s consolidated
corporate identity number 556156-0383, statement of financial position has changed
have been prepared in accordance with from 2021.
the Swedish Annual Accounts Act and the Loans are presented on two rows,
accounting standard RFR 2, unsecured and secured loans.
Accounting for Legal Entities. Akelius did not classify properties in Sweden,
Disclosures in accordance with IAS 34 Interim Germany, and Denmark as held for sale in the
Financial Reporting are submitted both in the second quarter, 2021, since management is
notes and in other sections of the year-end not committed to a plan to sell and the plan
report. might be significantly changed or withdrawn.
The figures in this year-end report have been
rounded, while the calculations have been new and amended IFRS standards
made without rounding. adopted by the EU applied as at
As a result, certain tables and key figures may January 1, 2021
appear not to add up correctly.
New and amended IFRS standards that came
into effect after January 1, 2021 have not had
accounting principles any material impact on the Group’s financial
Accounting principles can be found in Akelius reports.
annual report 2020.
Interest Rate Benchmark Reform,
Under IAS 37 Provision, Contingent liabilities
amendments to IFRS 7, IFRS 9 and IAS 39
and Contingent assets are provisions
recognized Amendments are effective for annual reporting
- when the Group has a present legal or periods beginning on or after 1 January 2021.
constructive obligation because of past events The amendments address the accounting
- it is probable that an outflow of resources will issues that arise when financial instruments
be required to settle the obligation that reference an IBOR interest rate transition
- and the amount can be estimated reliably. to an alternative benchmark rate.
The amount expected to be required to settle Akelius has reviewed effects on
the obligation is recognized as provision.
- hedge accounting
Provision must be reviewed at each balance
sheet date and adjusted so that it reflects the - financial instrument including the reference
current best estimate. to IBOR
If it is no longer probable that an outflow The new reform has not had any impact on
of resources will be required to settle the the Group’s financial position, results, or cash
obligation, flows.
the provision shall be reversed.
37interim report, January to June 2021 other information, continued risks and uncertainties The Group is impacted by various types of risks. Operational risks are limited by concentrating the property portfolio to residential properties in metropolitan areas. Strong residential rental markets in Sweden, Germany, Canada, England, France, the United States and Denmark reduce the risk of long-term vacancies. To reduce risk or variations in cash flow further, interest rates are secured on a long-term basis. Access to capital from many banks and through the capital market mitigates the refinancing risk. Overseas investments are hedged to reduce the impact of currency movements related to the Group´s equity ratio. The Group is also impacted by external risks, for example new rent regulations and pandemics. These risk areas can impact the business negatively both in the long and short term. There have been no material changes in the company’s assessment of risks since the publication of the annual report 2020. Ralf Spann, CEO, Managing Director Stockholm, Aug 2, 2021, Akelius Residential Property AB (publ) The interim report has not been reviewed by the company’s auditors. 38
interim report, January to June 2021

definitions
adjusted EBITDA                                    debt maturities, years
EBITDA plus other financial income and             Volume-weighted remaining term of
expenses.                                          interest-bearing loans and derivatives on the
It is used to show results excluding interest      balance sheet date.
expenses and changes in the value of assets        It illustrates the company’s refinancing risk.
and liabilities.
                                                   discount rate
adjusted net operating income margin
                                                   Rate of return used in assessing the present
Net operating income margin excluding
                                                   value of future cash flow and terminal value in
income from operating expenses included in
                                                   the fair value assessment of properties.
the rent invoiced to the tenants,
such as utility and property taxes.
                                                   earnings capacity
It highlights the ongoing earning capacity
from property management related to rental         The earnings capacity is based on the property
services only.                                     portfolio at the balance sheet date and the
                                                   portfolio's gross rent, real vacancy, estimated
adjusted unencumbered asset ratio                  operating expenses and maintenance costs
Adjusted unencumbered asset ratio,                 during a normal year, as well as central
includes properties pledged under unutilized       administrative expenses.
credit facilities.                                 Interest expenses are based on net debt on the
                                                   balance sheet date calculated at the currency
annual property return                             rate on the balance sheet date.
                                                   No tax has been calculated as it relates mainly
Net operating income plus unrealized and
                                                   to deferred tax that does not affect the cash
realized changes in the value of properties on
                                                   flow.
an annual basis in relation to the fair value of
                                                   The earnings capacity is not a forecast for the
the properties at the beginning of the year.
                                                   coming twelve months.
It illustrates the total return on the property
                                                   It contains no estimates of rent, vacancy,
portfolio.
                                                   currency exchange, future property purchases
average interest rate                              and sales or interest rate changes.
Average interest rate on the total
                                                   EBITDA
interest-bearing liabilities, excluding hybrid
bonds, at period end.                              Net operating income plus central
This key figure shows financial risk.              administrative expenses, and
                                                   other income and expenses.
capitalization rate                                Facilitates the analysis of current operating
The rate of return used in assessing the           profit.
terminal value of property in the fair value
assessment.                                        equity ratio
                                                   Equity in relation to total assets.
cash sources                                       It highlights the company’s financial stability.
Cash sources include liquidity, contracted
sales and profit before tax and revaluation.       income return
                                                   Net operating income on an annual basis in
cash uses
                                                   relation to the fair value of the properties at the
Cash uses include investments, contracted          beginning of the year.
purchases and short-term loans.                    It measures the yield on the property portfolio.

debt coverage capacity
Net debt in relation to EBITDA.
Net debt in relation to EBITDA including
realized change in value.
It shows how many years it takes for the
company to pay off its debts with current                                                             39
earnings.
interim report, January to June 2021
definitions, continued
in-place rent net asset
Contracted rent excluding rental discounts and Total assets minus pledged cash, cash and cash
temporary charges. equivalents.
It is used to illustrate the company’s net assets.
interest coverage ratio
net asset value
Adjusted EBITDA plus realized value growth for
the latest rolling 12-month Equity, deferred tax, and derivatives.
period in relation to net interest expenses for It is used to highlight the company’s
the latest rolling 12-month period. long-term capital that is not
It illustrates the company’s sensitivity to interest-bearing.
interest rate changes.
net debt
interest rate hedge
Interest-bearing liabilities excluding leasing
Volume-weighted remaining term of interest less subordinated debt, cash and cash
rates on interest-bearing loans and derivatives equivalents, and pledge cash assets.
on the balance sheet date. It is used to facilitate analysis of the company’s
It illustrates the company’s sensitivity to real indebtedness.
interest rate changes.
net financial items
liquid financial assets
The net of interest income, interest expenses,
Holdings in listed debt securities and equity other financial income and expenses and
securities with an investment grade rating. changes in the fair value of derivatives.
Included in the calculation of liquidity. Summarizes financial income and expenses
and is used to explain the financial items'
liquidity contribution to profit or loss.
The liquidity reserve consists of cash and cash
net interest expenses
equivalents, unutilized credit facilities and
liquid financial assets that can be liquidized Total interest expenses less interest on
within three working days. subordinated debt, one-off financing charges
and interest on cash, cash equivalents and
like-for-like properties liquid financial assets.
It is used to facilitate analysis of the company’s
Properties owned during the compared
interest results.
periods.
This means that properties that were acquired
net letting
or sold during any of the compared periods are
excluded. The sum of agreed contracted annual rents
It facilitates the analysis and the comparison for new lettings for the period less terminated
between different periods when properties that annual rents.
do not figure in all the periods are excluded. Demonstrates the effect of the vacancy
development illustrated in annual rent.
loan-to-value ratio
net operating income
Net debt divided by net assets.
This key figure shows financial risk. Rental income less property costs.
It highlights the ongoing earning capacity from
loan-to-value ratio, secured loans property management.
Net debt reduced by unsecured
interest-bearing debt divided by net assets. net operating income margin
This key figure shows financial risk. Net operating income in relation to rental
income.
It highlights the ongoing earning capacity from
40 property management.interim report, January to June 2021
definitions, continued
other income and expenses rent potential
Items from secondary activities such as The new lease level per area of the last
gains on disposals of fixed assets other than 12 months divided by the rent per area per
investment properties, the last day of the period for all occupied
income and expenses from temporary apartments.
services rendered after the sale of properties.
It summarizes income and expenses from rental value
business operations ancillary to the main
12 months' rent for apartments,
business operations.
including a market rent for vacant apartments.
property costs
return on equity
This item includes direct property costs,
Comprehensive income divided by opening
such as operating expenses, utility expenses,
balance equity.
maintenance costs and property taxes.
It shows the return offered on the owners’
invested capital.
property portfolio
Investment properties, owner-occupied sales and ended units
properties, and investment properties
Sales or split of an apartment where one
classified as assets held for sale.
apartment object is ended and two new ones
are created.
realized value growth
Proceeds from the sale of investment unencumbered asset ratio
properties minus acquisition costs,
Unencumbered assets divided by unsecured
accumulated investments and costs of sale.
loans minus subordinated debt, cash and cash
This item demonstrates the actual result of
equivalents.
sales measured from the acquisition to sale.
It is used to assess unencumbered assets in
relation to unsecured senior interest-bearing
real vacancy rate debt.
The total number of vacant apartments less
the number of apartments vacant due to vacancy rate
renovation work or planned sales,
The number of vacant apartments in relation to
in relation to the total number of apartments.
the total number of apartments.
Real vacancy is measured on the first day after
The vacancy rate is measured on the first day
the period end.
after the period end.
This rate facilitates the analysis of long-term
vacancy for the company.
value growth
renewed and renegotiated rental Changes in the value of investments properties
contracts excluding investment and change in currencies.
It demonstrates the changes in value of
All changes in rental levels for remaining
properties cleared for currency effects and
tenants.
capital spent.
This item highlights changes in contracts with
existing customers.
walk score
rental income Rating from 0 to 100 for how easy it is to carry
out daily errands without a car,
Rental value less vacancies and rent discounts.
where 100 is the best.
Walk score is provided by Walkscore.com
and is disclosed to rate the location of the
properties.
41Head office, Sweden
Rosenlundsgatan 50
Akelius in brief
Box 38149 apartments for metropolitans
100 64 Stockholm All apartments are in metropolitan cities,
+46 8 566 130 00 such as Berlin, Hamburg, Paris, London, Toronto,
+46 10 722 31 00 Montreal, New York, Boston, Washington D.C.,
Stockholm, and Copenhagen.
akelius.se
Germany
better living
Erkelenzdamm 11-13 Akelius helps families and individuals by providing a
better living.
D-10999 Berlin
+49 (0) 800 2535 487
acquire via cherry-picking
akelius.de
Akelius prefers to make many smaller acquisitions of
properties that are exactly right,
Canada by cherry-picking,
289 Niagara Street rather than making a few large acquisitions of
Toronto M6J 0C3 properties that are not quite right.
+1 (844) 253-5487
strong capital structure,
akelius.ca
low refinancing risk
England Akelius has agreements with 25 banks, listed senior
25 Hosier Lane unsecured bonds and listed common shares of
class D.
London EC1A 9LQ Akelius is one of Europe’s largest listed residential
+44 (0) 800 014 8579 companies and has twelve thousand shareholders.
akelius.co.uk
first-class personnel
France More than three hundred employees have graduated
37-41, rue du Rocher from the Residential Real Estate Management
program at Akelius Business School.
75008 Paris
+33 805 081 163
akelius.fr
United States
300 A Street, 5th Floor
financial calendar
Boston, MA 02210
+1 857 930-39 00 interim report Jan‒Sep 2021 October 25, 2021
akelius.us
year-end report 2021 February 7, 2022
Denmark annual report 2021 March 11, 2022
Nørre Voldgade 80, 2. floor
1358 Copenhagen K
+45 80 82 00 41
akelius.dkYou can also read