Interim Report on Neighborhood Indicators of Poverty - Blueprint for Maryland's Future
←
→
Page content transcription
If your browser does not render page correctly, please read the page content below
Blueprint for Maryland’s Future:

Interim Report on
Neighborhood Indicators of
Poverty

 Division of Assessment, Accountability,
 and Performance Reporting

 November 2021 Legislative Report
Blueprint for Maryland’s Future:
Interim Report on Neighborhood Indicators of Poverty November 2021 Legislative Report

 MARYLAND STATE DEPARTMENT OF EDUCATION

 Mohammed Choudury
 State Superintendent of Schools
 Secretary-Treasurer, Maryland State Board of
 Education

 Chandra Haislet
 Executive Director
 Office of Performance Reporting and Accountability

 Larry Hogan
 Governor

 MARYLAND STATE BOARD OF EDUCATION

 Clarence C. Crawford
 President, Maryland State Board of Education

 Charles R. Dashiell, Jr., Esq. (Vice President)

 Shawn D. Bartley, Esq.

 Gail Bates

 Chuen-Chin Bianca Chang

 Susan J. Getty, Ed.D.

 Vermelle Greene, Ph.D.

 Jean C. Halle

 Dr. Joan Mele-McCarthy

 Rachel L. McCusker

 Lori Morrow

 Brigadier General Warner I. Sumpter (Ret.)

 Holly C. Wilcox, Ph.D.

 Kevin Bokoum (Student Member)

 Maryland State Department of Education | 1
Blueprint for Maryland’s Future:
Interim Report on Neighborhood Indicators of Poverty November 2021 Legislative Report

 Table of Contents

 1 | Introduction .....................................................................................................................................................................................3

 2 | Requirement I: Progress on Analyzing Neighborhood Indicators of Poverty .........................................................4

 3 | Requirement II: Progress on Incorporating Medicaid Data ........................................................................................ 14

 4 | Requirement III: Progress on Using and Developing State Alternative Income Eligibility Forms ................ 15

 Appendix A: Methodology.............................................................................................................................................................. 18

 Appendix B: Presentation to the Maryland State Board of Education .......................................................................... 19

 Maryland State Department of Education | 2

Blueprint for Maryland’s Future:
Interim Report on Neighborhood Indicators of Poverty November 2021 Legislative Report

 1 | Introduction
 The Maryland Commission on Innovation and Excellence in Education was created in part to
 review and update the current funding formula for the schools in Maryland. As a part of the
 Commission’s Policy Area of More Resources for Students Who Need Them, the Commission and
 subsequent legislation The Blueprint for Maryland’s Future created a new Concentration of
 Poverty School Grant program for schools with a high concentration of poverty.

 Under the Blueprint for Maryland’s Future, the Maryland State Department of Education is tasked with a
 study on incorporating neighborhood indicators of poverty to determine a school’s eligibility for the
 concentration of poverty grant and the compensatory education program. The MSDE is required to submit a
 final report to the Accountability and Implementation Board on or before October 1, 2022, and the results
 of the study are to evaluate:

 • The American Community Survey data available across geographic areas in the small area income
 and poverty estimates program to provide school district poverty estimates; and

 • The Area Deprivation Index developed by the University of Wisconsin – Madison to rank
 neighborhoods by socioeconomic status disadvantage.

 The MSDE is required to submit an interim report on or before November 1, 2021 to the General Assembly
 to provide an update on:

 • The progress on analyzing and incorporating neighborhood indicators of poverty,

 • The fiscal year for which Medicaid data can be incorporated into the direct certification of students
 eligible for the compensatory education program, and

 • The plan for developing and using the state alternative income eligibility form to determine
 eligibility for the compensatory education program.

 Maryland State Department of Education | 3
Blueprint for Maryland’s Future:
Interim Report on Neighborhood Indicators of Poverty November 2021 Legislative Report

 2 | Requirement I: Progress on Analyzing
 Neighborhood Indicators of Poverty
 INDICATORS OF POVERTY IN EDUCATION DATA
 Background on Indicators of Poverty
 The impact of poverty on student achievement, educational attainment, and other educational outcomes
 has long been a concern for educators and policymakers. State aid formulas, grant programs, and legislation
 use available data to target resources to help mitigate the effects of poverty on students.

 The educational community has relied on the count of students eligible for free or reduced-price meals
 (FARMs) under USDA’s National School Lunch Program (NSLP) to measure poverty. The U.S. Department of
 Agriculture makes annual adjustments to the Income Eligibility Guidelines used to determine eligibility for
 free or reduced-price meals based on the federal income poverty guidelines. For a family of four the Federal
 Poverty Line for school year 2021-2022 is $26,500. Students are determined as eligible for free or reduced-
 price meals in one of two ways:

 • Annual household applications: Annual forms are used to collect information from families on
 household size and family income to determine eligibility.

 • Direct Certification: Eligible students are identified based on participation in programs such as the
 Temporary Assistance for Needy Families (TANF), Supplemental Assistance Nutrition Program
 (SNAP), Foster Care, or status as a homeless student.
 Limitations of Indicators of Poverty
 The eligibility for FARMs is regularly updated, the data is accessible and widely available, and has universal
 participation and criteria. However, the use of FARMs participation data is a proxy for income and poverty.
 Furthermore, there are limitations in the use of FARMs data in the quality, and accessibility of the data:

 • The family income information on free- and reduced-price meal applications is intended only to
 determine a student’s eligibility for the National School Lunch Program. FARMs eligibility data has
 been interpreted as a representation of a student’s family income rather than the student’s
 eligibility for free- or reduced-price meals. Due to NSLP guidelines 1 requiring that state education
 agencies, local school systems, and schools ensure that their data systems, school records, and
 other means of viewing a student’s FARMs eligibility status are accessible only to officials directly
 connected with the administration of the meals program, access to FARMs eligibility data is often
 limited. Teachers, guidance counselors, principals, and education staff who are not providing such
 assistance may not have access to FARMs data.

 • FARMs eligibility data provides little variation in income. FARMs eligibility data is severely limited
 in its ability to capture variation in income as it focuses only on three categories: not eligible, eligible
 for free-lunch, or eligible for reduced-price lunch. Additionally, FARMs eligibility data is a single
 measure, at a single point in time. For example, schools typically collect income eligibility

 1 Disclosure of Children's Free and Reduced Price Meals and Free Milk Eligibility Information in the Child Nutrition Programs, A Rule

 by the Food and Nutrition Service on 03/12/2007

 Maryland State Department of Education | 4

Blueprint for Maryland’s Future:
Interim Report on Neighborhood Indicators of Poverty November 2021 Legislative Report

 applications at the start of the school year. As the global coronavirus pandemic has shown, a family’s
 income can change drastically over the course of the school year.

 • FARMs eligibility data are becoming less applicable as a measure of income. In 2010, the Healthy,
 Hunger-Free Kids Act was amended to provide an alternative to household applications for free-
 and reduced-price meals in high-poverty school systems and schools. The Community Eligibility
 Provision (CEP) allows local school systems to elect CEP on behalf of a single school, group or
 groups of schools, or all schools in the system to provide free meals to all students. To be eligible for
 CEP, school systems and schools are required to have a percentage of enrolled students certified
 for free school meals. When school systems and schools implement the CEP, they are prohibited
 from collecting NSLP household applications. Although the CEP has expanded participation in the
 NSLP, the reporting on students from low-income households through using FARMs status is less
 accurate due to the elimination of NSLP annual household applications. (National Forum on
 Education Statistics, 2015)
 POVERTY MEASURES BEYOND INCOME
 Poverty is “the extent to which an individual does without resources” (Payne, 2005). However, the current
 indicator of poverty, FARMs eligibility, reflects the availability of only one resource –household income
 (National Forum on Education Statistics, 2015). A range of resources and the availability of the resources
 beyond income contribute to students in poverty, including:

 • family or household income,
 • highest level of education completed by parent or guardian,

 • occupation of parent or guardian,

 • home ownership,

 • neighborhood factors, and

 • household composition.
 Access to financial, social, cultural, and human capital resources are broadly defined under the term
 “socioeconomic status” (SES) (National Center for Education Statistics, 2012). Understanding the
 socioeconomic status of local communities allows policymakers and practitioners to:

 • equitably allocate financial, instructional, and support resources to groups of people (e.g., students,
 schools, and communities)

 • identify individuals who are eligible to participate in a range of supplemental programs and services
 or otherwise receive public benefits

 • understand potential socioeconomic differences when comparing educational conditions across
 students, schools, and school systems

 • report on the effectiveness of schools, programs, and services for a wide range of student groups.
 (National Forum on Education Statistics, 2015)
 SES is correlated with skill development, academic achievement, work and life outcomes, and overall
 psychological and behavioral well-being across a lifespan. High SES has particularly positive effects on
 children and students. Young children from high-SES households and communities are less likely to develop
 learning-related behavior problems than those from environments with lower SES (Morgan, Farkas,
 Hillemeier, & Maczuga, 2009). SES has positive effects on individual and school-level literacy indicators, as

 Maryland State Department of Education | 5

Blueprint for Maryland’s Future:
Interim Report on Neighborhood Indicators of Poverty November 2021 Legislative Report

 well as correlations with the quality of students’ home learning environments and their classroom
 instruction (Buckingham, Wheldall, & Beaman-Wheldall, 2013).

 CONCENTRATION OF POVERTY
 In addition to the influence of an individual’s poverty on educational and life outcomes, the concentration of
 poverty within a neighborhood in which an individual resides has an additional effect. Both poverty and
 place matter. Research indicates that poor families in a neighborhood with a concentration of poor families
 have a double disadvantage – it is meaningfully worse to grow up poor in a poor neighborhood than to grow
 up poor in a better resourced neighborhood (Jargowsky, 2015). The concentration of poverty within an area
 can further limit individuals and families' lack of access to resources and support to overcome the resulting
 challenges. There is a large body of research on the impact of concentrated poverty on students’ outcomes
 and opportunities.

 • The many barriers imposed by living in a neighborhood with concentrated poverty make it much
 harder for residents to move up the economic ladder and their chances of doing so only diminish the
 longer they live in such neighborhoods (Chetty R. , Hendren, Kline, & Saez, 2014).

 • A study of the federally sponsored Moving to Opportunity program found that moving young
 children from a high-poverty housing project to a lower-poverty neighborhood increased college
 attendance and earnings and reduced single parenthood rates (Chetty, Hendren, & Katz, 2016).

 • The concentration of poverty within schools has also shown to have negative effects on student
 outcomes. The socioeconomic composition of a school influences students’ educational outcomes
 above and beyond the students’ own family background, prior achievement, race, gender, and levels
 of effort or motivation (Mickelson, 2018).

 • Low-poverty schools are 22 times more likely to reach consistently high academic achievement
 compared with high-poverty schools (Harris, 2007).
 Neighborhoods do not exist in social or physical isolation and are often surrounded by other
 socioeconomically similar neighborhoods with residents of neighborhoods also visiting other
 neighborhoods in their everyday routines. Triple neighborhood disadvantage is a concept that builds on the
 idea that resources and well-being of a neighborhood are also dependent on the conditions in
 neighborhoods its residents visit and are visited by. A triple neighborhood disadvantage may lack the
 needed public or private investment as well as proximity to organizational resources further exagerating the
 concentration of poverty (Levy, Phillips, & Sampson, 2020).

 GEOCODING OF K-12 STUDENT DATA
 Pursuant to Education Article §24–703.3, the Maryland Longitudinal Data System (MLDS) Center is
 required to develop a protocol for geocoding K-12 Student Data. Specifically, the requirements are as
 follows:

 • The Maryland Longitudinal Data System Center is required to develop a protocol for a county board
 to convert a student’s home address and geolocation information into Census tract and block
 numbers.

 • Local School Systems are required to convert student addresses into Census tract and block
 numbers.

 • The MSDE is required to collect Census tract and block numbers from Local Systems, and to provide
 the collected Census tract and block numbers to the MLDS Center.

 Maryland State Department of Education | 6
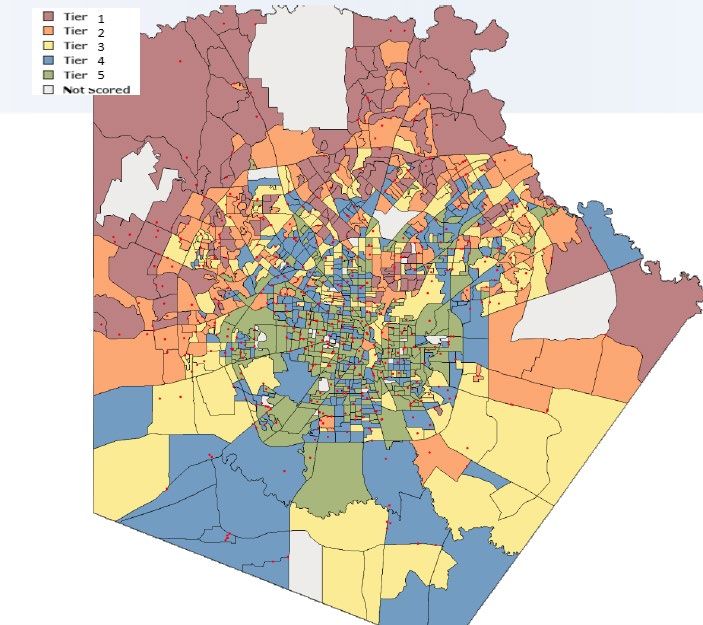
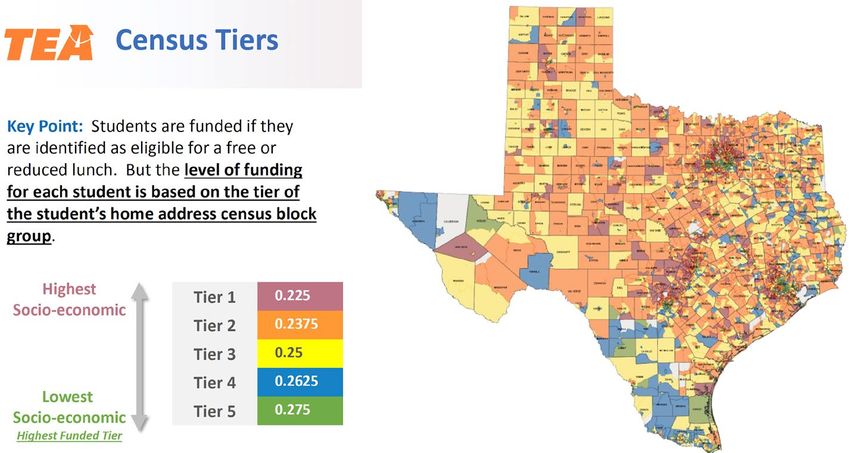
Blueprint for Maryland’s Future:
Interim Report on Neighborhood Indicators of Poverty November 2021 Legislative Report

 The MLDS Center and the MSDE collaborated with four local school systems (LSSs) to pilot a protocol to
 fulfil the requirements of the law. The pilot was completed September 2021 and statewide implementation
 is planned for fall 2022. As part of the pilot, the four LSSs have provided data to the MSDE to support the
 analysis and study of neighborhood indicators of poverty. Figure 1 highlights the activities as part of the
 Geocoding of K-12 Student Data workgroup.

 Figure 1: Geocoding of K-12 Student Data Workgroup

 MLDS Center with the MSDE Protocol and Utility Closure of Pilot and Workgroup
 Convenes a Workgroup Development

 October 2021 —
 August 2020 — December 2020 —
 September 2022
 September 2021 September 2021

 • Protocol developed and • Piloting local school
 • Four Local School
 utility tested systems provide data to
 Systems
 MSDE
 • Piloting local school
 • Explored similar work • MLDS Center finalizes
 systems convert
 across the nation protocol and utility
 addresses into
 geolocation information • The MSDE prepares for
 including Census tract statewide
 and block numbers implementation fall
 2022

 NEIGHBORHOOD INDICATORS OF POVERTY
 Review of National Neighborhood Indicators of Poverty
 The MSDE has reviewed available and emerging models of neighborhood indicators of poverty across the
 nation. Highlights of state and district measures from Texas, New Mexico and Chicago are included below.

 1. Texas Education Agency Statewide Socioeconomic Tier Model for Texas School-Age Residents.
 In Texas, a statewide five-tier socioeconomic status (SES) classification model was developed based
 on four factors using ACS data including household income, home ownership, household
 composition, and educational attainment. A composite SES score was calculated for each of the
 15,286 Texas Census block groups that contained family households and for which the most recent
 5-year ACS provided a median household income estimate.

 • Calculated each students’ economically disadvantaged status by the Census block group
 where their home/residence is located.

 • Increased compensatory education funding for students in lower socioeconomic tiers. The
 compensatory funding is based on a tiered multiplier with the highest weight resulting in
 the greatest amount of additional funding provided for students in the lowest SES tier.
 Homeless students are automatically assigned to the lowest SES tier.

 • Funding must be used for programs that meet the needs of educationally disadvantaged
 students including childcare services, assistance with childcare for students at risk of
 dropping out of school, life skills programs, programs eligible under Title I, and other
 permitted programs depending on needs of students.

 Maryland State Department of Education | 7
Blueprint for Maryland’s Future:
Interim Report on Neighborhood Indicators of Poverty November 2021 Legislative Report

 • Created the Teacher Incentive Allotment, a statewide career ladder initiative to recruit,
 retain, and reward highly impactful teachers to teach in rural and high needs schools.

 2. New Mexico Public Education Department Family Income Index.
 In New Mexico, a statewide five-tier family income index is calculated for every school in the state
 based on data from other state agencies as well as the Census data. For every school, the
 percentage of students in five income categories is calculated, which results in a ranked list of
 schools with the highest populations of low-income students.

 • Calculated each school’s Family Income Index, or the percentage of students in families
 with the lowest incomes.

 • Allocated $15 million to 108 schools, with awards ranging from $20,000 to $434,174, to
 fight concentrated poverty in schools.

 • Funding must be used for specified purposes such as reading and math interventions, hiring
 school counselors and social workers, creating family information and resource centers,
 adopting culturally and linguistically diverse classroom texts, offering innovative
 professional learning opportunities, or after-school enrichment.

 3. Chicago Public School Tiers.
 The Chicago Public Schools (CPS) developed a socioeconomic score (SES) four-tier methodology to
 increase diversity in the student body at selective schools. The model developed by CPS was based
 on six factors from (ACS) data: household income, home ownership, household composition,
 educational attainment, percentage of households where English is not the primary language, and
 school performance.

 Under the Blueprint for Maryland’s Future, the MSDE is required to evaluate the American Community
 Survey and the Area Deprivation Index as part of the study.

 The American Community Survey (ACS) collects data on demographics, household income, education,
 employment, and home ownership and is administered annually by the Census to a stratified random sample
 of approximately 2.5% of households across the United States. ACS data is aggregated and made available
 to the public for download on the Census website at several levels, including the block, block group, tract,
 and county levels. 2 In addition to results of each administration of the survey, the Census also aggregates
 results from the prior five years to provide more reliable estimates.

 The Area Deprivation Index (ADI) developed by the University of Wisconsin-Madison uses the ACS to rank
 neighborhoods by socioeconomic disadvantage status. The ADI calculates a composite of 17 measures at
 the block group level. The measures capture education, income/employment, housing, and household
 characteristics. Block groups are ranked in nationwide percentiles and statewide deciles, which are available
 to the public.

 2
 Census block groups are aggregations of Census blocks and are the smallest unit for which detailed household data is available to the public.

 Maryland State Department of Education | 8
Blueprint for Maryland’s Future:
Interim Report on Neighborhood Indicators of Poverty November 2021 Legislative Report

 Neighborhood Indicator of Poverty Exploration
 The MSDE is leveraging existing and emerging models that use socioeconomic scores and tiers including
 those used by Chicago Public Schools, Dallas Independent School District, San Antonio Independent School
 District, and the Texas Education Agency. These models address many of the limitations of free and
 reduced-price meal eligibility data and capture the multiple dimensions of poverty beyond income. The
 foundation of these models is the use of Census block groups to identify neighborhoods and the use of
 American Community Survey (ACS) measures to identify multiple dimensions of poverty beyond school,
 local school system boundaries, or zip codes. An advantage of using the publicly available ACS data is that it
 allows flexibility in which variables can be included in the indicator.

 The neighborhood indicator of poverty exploration presented in this interim report replicates the Texas
 approach due to its relative simplicity in using four measures which focus on neighborhood factors without
 the inclusion of school outcomes. These four measures represent distinct elements of poverty, are used in
 existing methodologies studied, and have been shown to be correlated with student achievement (Davis-
 Kean, 2005) (Ghimire, 2021) (Milne, Myers, Rosenthal, & Ginsburg, 1986) (Pong, 1997).

 To create the neighborhood indicator of poverty, four Census block group measures were selected from the
 ACS:

 • median household income,

 • adult education level,

 • home ownership, and

 • household composition.
 There are measures available in ACS beyond the four used in the current exploration including school
 performance, language proficiency, race and ethnicity, health disparities, computer ownership, and internet
 access that impact socioeconomic status. Future explorations may include possible expansions or
 supplemental use of the available measures.

 A composite index of these four measures was calculated for 3,718 Census block groups in Maryland using
 the 2019 ACS 5-year estimates. 3 The 3,718 Census block groups were ranked high to low and assigned to
 one of five tiers where each tier contains a similar number of school-age residents (not a similar number of
 block groups). Tier 1 is high socioeconomic status (low poverty), and Tier 5 is low socioeconomic status (high
 poverty). See the Appendix A for the methodology developed for Maryland’s exploration of a neighborhood
 indicator of poverty.

 3
 Maryland has 3,926 Census block groups but 208 block groups were missing one or more indicators and were not assigned a score or tier.

 Maryland State Department of Education | 9
Blueprint for Maryland’s Future:
Interim Report on Neighborhood Indicators of Poverty November 2021 Legislative Report

 Results
 Census block groups are classified into one of 5 tiers so that each tier contains a similar number of school-
 age residents. Statewide, 17.5% of block groups fall in Tier 1, 19.0% in Tier 2, 20.7% in Tier 3, 21.3% in Tier 4,
 and 21.5% in Tier 5. On average, block groups in each tier are differentiated from one another along all four
 indicators as highlighted in Table 1

 Table 1: Average Census block group characteristics by socioeconomic tiers

 Median Total
 SES household % Home % Single Parent Educational SES N School-age
 tier income ($) ownership Households Score 4 score 5 residents

 Tier 1 158,811 95.0 7.1 73.9 2.54 192,957
 Tier 2 113,177 87.3 15.2 66.0 2.07 192,795
 Tier 3 88,817 76.7 25.5 62.0 1.60 192,443
 Tier 4 69,699 58.7 38.3 59.2 1.11 193,226
 Tier 5 46,843 34.6 69.7 52.3 0.49 191,965

 Figure 2 shows the socioeconomic tiers across the state of Maryland. Census block groups are colored
 according to the assigned tier, with red indicating the lowest SES Tier 5 and dark green indicating the
 highest SES Tier 1.

 Figure 2: Map of Maryland Census Block Groups by Socioeconomic Tier

 4
 Education score is calculated as a weighted percentage of adult in a Census block group who have attained different levels of education, from
 20 for less than a high school diploma, to 100 for an advanced degree. See the Appendix A for more information.
 5
 SES Score is the sum of state percentile rankings of the four indicators and can range from 0.04 (low SES) to 3.96 (high SES).

 Maryland State Department of Education | 10
Blueprint for Maryland’s Future:
Interim Report on Neighborhood Indicators of Poverty November 2021 Legislative Report

 While statewide there are between 18% and 22% of Census block groups in each of the five SES tiers, Figure
 3 shows there is considerable variation across school systems in Maryland in the percentage of high and low
 SES tiers within each of the school systems. For example:

 • While more than half (54%) of the Census block groups in Baltimore City are in Tier 5 (low SES),
 zero low SES Census block groups are in Calvert County,

 • Five local school systems (Allegany, Caroline, Dorchester, Kent, and Somerset) have zero high SES
 Census block groups (Tier 1),

 • In Allegany, Baltimore City, Kent, and Wicomico counties, 70% or more of the Census block groups
 are in Tiers 4 or 5 (lower SES), and

 • More than 50% of Census block groups in Calvert, Carroll, Harford, Howard, and Montgomery
 Counties are in Tiers 1 or 2 (higher SES).

 Figure 3: Distribution of Socioeconomic Tiers by Local School System

 Maryland State Department of Education | 11
Blueprint for Maryland’s Future:
Interim Report on Neighborhood Indicators of Poverty November 2021 Legislative Report

 Table 2: Distribution of Census Block Groups by Socioeconomic Tiers and Local School System

 Local School System Tier 1: High Tier 2 Tier 3 Tier 4 Tier 5: Total
 SES Low SES

 STATE 650 705 770 793 800 3,718
 Allegany 0 3 11 24 15 53
 Anne Arundel 68 83 72 56 26 305
 Baltimore City 14 26 77 133 294 544
 Baltimore County 77 95 116 130 95 513
 Calvert 15 8 14 7 0 44
 Caroline 0 3 5 10 5 23
 Carroll 31 32 26 12 5 106
 Cecil 7 12 16 8 12 55
 Charles 10 25 18 17 9 79
 Dorchester 0 3 7 7 11 28
 Frederick 43 50 40 30 17 180
 Garrett 1 1 7 9 3 21
 Harford 41 43 35 24 16 159
 Howard 66 30 24 27 6 153
 Kent 0 2 3 6 6 17
 Montgomery 205 138 97 98 63 601
 Prince George’s 53 97 113 116 135 514
 Queen Anne’s 3 7 12 2 1 25
 Somerset 0 4 6 2 5 17
 St Mary’s 6 14 16 12 4 52
 Talbot 2 5 9 7 4 27
 Washington 3 16 18 24 30 91
 Wicomico 4 3 14 17 32 70
 Worcester 1 5 14 15 6 41

 ANALYSES OF DATA IN PROGRESS
 As reflected in this interim report, the MSDE has made progress in analyzing neighborhood indicators of
 poverty. Ongoing analysis and development continues around the the following areas:

 • Confirming and testing of the model measures and number of tiers.
 The exploratory model used in this interim report includes four available ACS measures. The MSDE
 will continue to analyze the available ACS measures to ensure the robustness of the selected model.
 The exploratory model established 5 tiers based on statewide standards, which could limit the
 usefulness of the results in areas with little variation in SES at the block group level. Further
 exploration is needed to confirm the appropriate number of tiers.

 • Developing of school level SES tiers.
 School level SES tiers will be based on student data provided by the pilot LSS, as required by Md.
 Ann. Code, Ed. Art. §24–703.3. The MSDE will explore how school level SES tiers relate to other
 available measures of poverty (FARMs) and student enrollment in a school.

 • Studying the relationship between school level SES tiers, school outcomes, and school resources.
 Further exploration will include determining the correlations between school level SES tiers and

 Maryland State Department of Education | 12
Blueprint for Maryland’s Future:
Interim Report on Neighborhood Indicators of Poverty November 2021 Legislative Report

 student achievement, growth, and attendance. The MSDE will also explore the relationship of
 school level SES tiers on access to school resources like inexperienced and out-of-field teachers.

 • Supporting the collection of high-quality student geolocation data.
 Through the collaboration with local school systems, the MLDS Center and the MSDE identified
 challenges to the collection of high-quality address data in local school systems. The MSDE will
 continue the collaborative development of data collection procedures to ensure the availability of
 high-quality student geolocation data.
 POLICY CONSIDERATIONS
 The use of currently available data to identify low-income students has limitations, particularly with the
 inception of CEP. A large body of research also has identified the compounding effects of concentrated
 poverty on the outcomes and opportunities of students. There is a critical need for a measure to better
 allocate resources to drive student outcomes positively and at scale. A neighborhood indicator of poverty
 may be a feasible method of measuring and adequately providing funding to improve the outcome of
 disadvantaged students. Policy considerations for the use of emerging neighborhood indicators of poverty
 include:

 • Compensatory and funding allocations
 Neighborhood indicators of poverty may provide a more accurate measure of poverty and
 concentrated poverty resulting in adequate funding of schools (Texas, New Mexico).

 • Equity and access
 Additional funding could be allocated for specified uses grounded in evidence-based results to
 improve outcomes and opportunities for disadvantaged students (Chicago Public Schools).

 • Teacher incentives and placement
 Resulting school level data could be leveraged to recruit, retain, and reward highly impactful
 teachers to teach in rural and high needs schools (Texas).

 Maryland State Department of Education | 13
Blueprint for Maryland’s Future:
Interim Report on Neighborhood Indicators of Poverty November 2021 Legislative Report

 3 | Requirement II: Progress on
 Incorporating Medicaid Data
 BACKGROUND ON INCORPORATING MEDICAID DATA
 Under the Blueprint for Maryland’s Future, the Maryland State Department of Education is required to
 provide as part of the interim report, the progress towards incorporating Medicaid data into the direct
 certification of students eligible for the compensatory education program.

 PROGRESS TOWARD INCORPORATING MEDICAID DATA
 MSDE has applied for participation in the United States Department of Agriculture Medicaid
 Demonstration Project for the 2023 school year. Applications for that time period were due September 30,
 2021, and, if approved, MSDE will implement the program on July 1, 2022.

 The Office of Health Care Financing, that is within the Maryland Department of Health, is coordinating with
 the Maryland Health Benefits Exchange (MHBE), Maryland’s state-based health insurance exchange, to
 ensure student aged Medicaid data is shared with the Maryland State Department of Education (MSDE).
 MSDE will coordinate with the Maryland Health Benefits Exchange to establish a new Data Use Agreement
 that provides Modified Adjusted Gross Income (MAGI) enrollee data by income category needed for this
 project.

 Maryland State Department of Education | 14
Blueprint for Maryland’s Future:
Interim Report on Neighborhood Indicators of Poverty November 2021 Legislative Report

 4 | Requirement III: Progress on Using and
 Developing State Alternative Income
 Eligibility Forms
 BACKGROUND ON STATE ALTERNATIVE INCOME ELIGIBILITY FORM
 Under the Blueprint for Maryland’s Future, the Maryland State Department of Education is required to
 develop an alternative income eligibility form. The form must include a statement indicating that the income
 information requested on the form is used to determine local and state funding for education. The form
 must be used by all schools participating in the U.S. Department of Agriculture Community Eligibility
 Provision and may be collected by all other schools beginning in the 2022-2023 school year.

 PROGRESS TOWARDS THE STATE ALTERNATIVE INCOME ELIGIBILITY FORM
 Because of CEP and other changes to the NSLP, states and local school systems can no longer rely on federal
 resources to collect household forms from students’ families to determine eligibility for meals. The result is
 that schools lack an accurate count of low-income students due to a decline in the collection of household
 forms. States therefore are turning to alternatives with varying levels of success (Greenberg E. , 2018).
 Some states do require household alternative income forms to be administered annually by CEP
 participating school systems 6.

 The MSDE has planned to develop the alternate form during school year 2021-2022.

 6 Alternative Approaches to Using School Meals Data in Community Eligibility (CEP) Schools, Center on Budget and Policy Priorities, Food
 Research & Action Center, June 2017.

 Maryland State Department of Education | 15
Blueprint for Maryland’s Future:
Interim Report on Neighborhood Indicators of Poverty November 2021 Legislative Report

 REFERENCES
 Buckingham, J., Wheldall, K., & Beaman-Wheldall, R. (2013, September 9). Why poor children are more likely
 to become poor readers: The school years. Australian Journal of Education, 57(3), 190–213.
 Retrieved from https://journals.sagepub.com/doi/abs/10.1177/0004944113495500

 Chetty, R., Hendren, N., & Katz, L. F. (2016). The Effects of Exposure to Better Neighborhoods on Children:
 New Evidence from the Moving to Opportunity Experiment. American Economic Review, 106(4), 855-
 902.

 Chetty, R., Hendren, N., Kline, P., & Saez, E. (2014). Where is the land of opportunity? The geography of
 intergenerational mobility in the United States. National Bureau of Economic Research.
 doi:10.3386/w19843

 Davis-Kean, P. E. (2005). The influence of parent education and family income on child achievement: The
 indirect role of parental expectations and the home environment. Journal of Family Psychology, 19(2),
 294-304.

 Ghimire, R. (2021). Homeownership and students’ achievement in public schools in the U.S. state of Georgia.
 Housing Policy Debate.

 Greenberg, E. (2018). New Measures of Student Poverty, Replacing Free and Reduced-Price Lunch Status Based on
 Household Forms with Direct Certification. Washington, D.C.: Urban Institute. Retrieved from
 https://www.urban.org/sites/default/files/publication/99325/new_measures_of_student_poverty_
 1.pdf

 Greenberg, E., Blagg, K., & Rainer, M. (2019). Measuring Student Poverty: Developing Accurate Counts for School
 Funding, Accountability, and Research. Urban Institute. Retrieved from
 https://www.urban.org/research/publication/measuring-student-poverty/view/full_report

 Harris, D. N. (2007, May). High‐Flying Schools, Student Disadvantage, and the Logic of NCLB. American
 Journal of Education, 113(3). doi:https://doi.org/10.1086/512737

 Interagency Technical Working Group on Evaluating Alternative Measures of Poverty. (2019). Final Report
 of the Interagency Technical Working Group on Evaluating Alternative Measures of Poverty. Washington,
 D.C. : Bureau of Labor Statistics, U.S. Census Bureau. Retrieved from https://www.bls.gov/cex/itwg-
 report.pdf

 Jargowsky, P. (2015, August 9). The architecture of segregation. Civil unrest, the concentration of poverty,
 and public policy. Issue Brief. The Century Foundation. Retrieved from https://production-
 tcf.imgix.net/app/uploads/2015/08/07182514/Jargowsky_ArchitectureofSegregation-11.pdf

 Levy, B. L., Phillips, N. E., & Sampson, R. J. (2020, 11 30). Triple Disadvantage: Neighborhood Networks of
 Everyday Urban Mobility and Violence in U.S. Cities. American Sociological Review, 85(6), 925-956.
 doi:https://doi.org/10.1177/0003122420972323

 Maas, S. (2016, November). Chicago's Experiment in Achieving Diversity in Elite Public Schools. The
 Digest(11). Retrieved from https://www.nber.org/digest-2016-11

 Maryland State Department of Education | 16
Blueprint for Maryland’s Future:
Interim Report on Neighborhood Indicators of Poverty November 2021 Legislative Report

 Mickelson, R. (2018). Is there systematic meaningful evidence of school poverty thresholds? The National
 Coalition on School Diversity. Retrieved from https://files.eric.ed.gov/fulltext/ED603709.pdf

 Milne, A. M., Myers, D. E., Rosenthal, A. S., & Ginsburg, A. (1986). Single parents, working mothers, and the
 educational achievement of school children. Sociology of Education, 59(3), 125-139.

 Morgan, B. (2021, January 29). Interagency Federal Task Force Co-chaired by Professor Bruce Meyer
 Recommends Alternative Poverty Measures. Retrieved from The University of Chicago, Harris School
 of Public Policy, News: http://harris.uchicago.edu/news-events/news/interagency-federal-task-
 force-co-chaired-professor-bruce-meyer-recommends

 Morgan, P., Farkas, G., Hillemeier, M., & Maczuga, S. (2009). Risk Factors for Learning-Related Behavior
 Problems at 24 Months of Age: Population-Based Estimates. Journal of Abnormal Child Psychology,
 37(401). Retrieved from https://link.springer.com/article/10.1007/s10802-008-9279-8

 National Forum on Education Statistics. (2015). Forum Guide to Alternative Measures of Socioeconomic
 Status in Education Data Systems. Washington, DC: U.S. Department of Education. Retrieved from
 https://nces.ed.gov/pubs2015/2015158.pdf

 National Research Council. (2012). Using American Community Survey Data to Expand Access to the School
 Meals Programs. Washington, D.C.: The National Academies Press.
 doi:https://doi.org/10.17226/13409.

 Payne, R. K. (2005). A Framework for Understanding Poverty. Aha! Process.

 Pong, S.-L. (1997). Family structure, school context, and eighth-grade math and reading achievement.
 Journal of Marriage and Family, 59(3), 734-746.

 Reardon, S., Weathers, E., Fahle, E., Jang, H., & Kalogrides, D. (2021). Is Separate Still Unequal? New
 Evidence on School Segregation and Racial Academic Achievement Gaps. Retrieved from
 https://cepa.stanford.edu/content/separate-still-unequal-new-evidence-school-segregation-and-
 racial-academic-achievement-gaps

 Shrider, E. A., Kollar, M., Chen, F., & Semega, J. (2021, September). U.S. Census Bureau, Current Population
 Reports, P60-273, Income and Poverty in the United States: 2020. Washington, D.C. : U.S. Government
 Publishing Office. Retrieved from
 https://www.census.gov/content/dam/Census/library/publications/2021/demo/p60-273.pdf

 The Office of Governor Michelle Lujan Grisham. (2021, April 5). Governor enacts Family Income Index.
 Retrieved from New Mexico, The Office of the Governor, Press Releases:
 https://www.governor.state.nm.us/2021/04/05/governor-enacts-family-income-index/

 Maryland State Department of Education | 17
Blueprint for Maryland’s Future:
Interim Report on Neighborhood Indicators of Poverty November 2021 Legislative Report

 APPENDIX A: METHODOLOGY
 The American Community Survey (ACS) 5-year estimate tables were downloaded from the United States
 Census Bureau website and imported into Stata statistical software for each of the 3,926 Census block
 groups in Maryland. The following measures were constructed using ACS data:

 • Median household income in the last 12 months

 • Percent home ownership

 • Calculated as the number of homeowners divided by the total occupied housing units.

 • Percent single parent households

 • Calculated as the number of single parent householders with children under 18 divided by
 the total households with children under 18.

 • Education score

 • A number from 0 to 1, calculated as the percentage of residents over age 25 who had
 attained each education level, weighted as follows:

 • Less than a HS Diploma – 0.2

 • HS Diploma or GED – 0.4

 • Some College – 0.6

 • Bachelor’s Degree – 0.8

 • Advanced Degree – 1.0

 • Student age population

 • Defined as the number of residents between the ages of 5 and 17.

 Out of the 3,926 Census block groups in Maryland, there were 155 block groups missing median household
 income, 34 block groups that contained no residential housing units, 104 block groups in which no family
 households resided, and 27 block groups in which no individuals 25 or older resided. Not surprisingly, there
 was considerable overlap among block groups missing one of these measures. The total number of block
 groups excluded due to a missing or zero value on one or more of these variables was 208 (5.3%) containing
 13,428 school-age residents, while 69 of these block groups had zero school-age residents.

 Each of the four variables were ranked and assigned a percentile score from 0 to 1, with single parent
 households reverse coded. A unique percentile score was calculated for each percentage score, such that
 two block groups sharing the same percentage score on a given indicator received the same percentile score
 for that indicator. The scores were then added to create an overall Socioeconomic Score falling between 0
 and 4, using the following calculation:

 = Median Household Income Score + Home Ownership Score +
 Single Parent Family Score + Education Score

 After calculating a total socioeconomic score for each of 3,718 block groups with complete data, the block
 groups were ranked in order from lowest to highest. Census block groups were then divided so
 approximately 20% (~195,363) of school-age residents were in each of five tiers.

 Maryland State Department of Education | 18
Blueprint for Maryland’s Future:
Interim Report on Neighborhood Indicators of Poverty November 2021 Legislative Report

 APPENDIX B: PRESENTATION TO THE MARYLAND STATE BOARD OF EDUCATION
 Blueprint Deep Dive: Neighborhood Indicators of Poverty, Presentation to the Maryland State Board of
 Education, September 28, 2021 Meeting

 Maryland State Department of Education | 19
TO: Members of the State Board of Education

FROM: Mohammed Choudhury

DATE: September 28, 2021

SUBJECT: Blueprint Deep Dive: Neighborhood Indicators of Poverty

PURPOSE:

To provide an update on the progress towards developing a neighborhood indicator of poverty in the
Blueprint for Maryland’s Future.

EXECUTIVE SUMMARY:

The Blueprint for Maryland’s Future requires the Maryland State Department of Education to conduct
a study on neighborhood indicators of poverty with an interim report due November 1, 2021 to the
Maryland General Assembly and the Accountability Implementation Board (AIB), and a final report
due October 1, 2022 to the AIB.

The presentation to the Board will highlight the efforts underway to collect more comprehensive and
meaningful data, and the progress the Maryland State Department of Education has made in
developing a neighborhood indicator of poverty.

Information presented will include the following topics:
 • Background on Poverty, Limitations of Data and Concentration of Poverty;
 • Maryland’s Timeline and Progress towards a Neighborhood Indicator of Poverty; and
 • Exploring Neighborhood Indicators of Poverty.

Additionally, at the Maryland State board meeting a case study of the use and impact of neighborhood
indicators of poverty in Texas will be presented.

ACTION:

No action is necessary; for discussion only.

 200 WEST BALTIMORE STREET | BALTIMORE, MD 21201 410-767-0100 | 410-333-6442 TTY/TDD
 MarylandPublicSchools.org
Blueprint Deep Dive:
Neighborhood Indicators of Poverty
 Maryland State Department of Education
 September 28, 2021
The Blueprint for Maryland’s Future
 The progress on analyzing
 neighborhood indicators of poverty.
NOVEMBER 1, 2021
 The study shall evaluate:
The Department shall submit an interim report to the
 1. The American Community Survey data available across
General Assembly, and the Accountability and geographic areas in the Small Area Income and Poverty
Implementation Board. Estimates Program to provide school district poverty
 estimates; and
 2. The Area Deprivation Index developed by the University
 of Wisconsin – Madison to rank neighborhoods by
OCTOBER 1, 2022 socioeconomic status disadvantage.

The Department shall submit a report to the
 The fiscal year for which Medicaid data can be incorporated
Accountability and Implementation Board on
 into the direct certification of students eligible for the
incorporating neighborhood indicators of poverty to compensatory education program.
determine a school’s eligibility for the compensatory
education program and the concentration of poverty The plan for developing and using the State alternative
 income eligibility form to determine eligibility for the
grant based on the study.
 compensatory education program.

 2
Topics Background on Poverty, Limitations of Data and Concentration of Poverty Maryland’s Timeline and Progress Towards a Neighborhood Indicator of Poverty Exploring Neighborhood Indicators of Poverty Case Study: Texas 3
Multiple Factors Impact Poverty

 Poverty is "the extent to which an individual does without resources."
 (Payne, R. K. (2005). A framework for understanding poverty. Aha! Process.)

 Home
 Ownership
 Highest Level of
 Family or Education Occupation
 Household
 Completed by of Parent or Neighbor-
 Income Parent or Guardian hood
 Guardian

 Household
 Composition

 4
Why does measuring poverty matter?

Understanding the socioeconomic conditions of local communities allows
policymakers and practitioners to:
• allocate financial, instructional, and support resources to groups of
 Differences in
 people (e.g., students, schools, and communities); demographic and
• identify individuals who are eligible to participate in a range of economic
 supplemental programs and services or otherwise receive public conditions are
 often associated
 benefits;
 with differences in
• understand potential socioeconomic differences when comparing educational
 educational conditions across students, schools, and school systems; opportunities and
 and outcomes.

• report on the effectiveness of schools, programs, and services for a wide
 range of student groups.
National Forum on Education Statistics. (2015). Forum Guide to Alternative Measures of Socioeconomic Status in Education Data Systems.
 5
(NFES 2015-158). U.S. Department of Education. Washington, DC: National Center for Education Statistics. (p. iv)
How is poverty measured in education?

 The count of students eligible for a free or reduced price meal under
 USDA’s National School Lunch Program (NSLP) is the most commonly used measure of poverty in education.
 Pros Cons
 (Core Conditions Met) (Limitations and Data Quality Issues)

 • Universal participation and • Binary measure capturing little variation in household income (Domina
 criteria et al., 2018)
 • Regularly updated • Measure is of an individual at a point-in-time and not a neighborhood
 • Stable infrastructure with measure.
 long history and well funded • Participation rates are not constant across grades (Harwell &
 • Accessible and widely LeBeau, 2010)
 available • Systemic differences in participation
 • Community Eligibility Provision limits availability of student level data
 • Eligibility of students relies on household forms and/or direct
 certification

 6
Both Poverty and Place Matter

• The socioeconomic composition of school influences students’ educational outcomes above and beyond
 their own family background, prior achievement, race, gender, and levels of effort or motivation
 (Mickelson, 2018).

• The many barriers imposed by living in a poor neighborhood make it much harder for residents to move
 up the economic ladder and their chances of doing so only diminish the longer they live in such
 neighborhoods.(Chetty et al., 2014).

• Moving to a lower poverty neighborhood at a young age increases college attendance and earnings
 (Chetty et al., 2016).

• While racial segregation within a district is a very strong predictor of achievement gaps, school poverty -
 not racial composition of schools - accounts for this effect (Reardon, 2019).

• Low‐poverty schools are 22 times more likely to reach consistently high academic achievement
 compared with high‐poverty schools (Harris, 2007).
 7
Concentration of Poverty

 Concentration of poverty is different than a
 measure of poverty at the individual or
 family level.

 The concentration of poverty is a measure
 of the percentage of poor residents in an
 area.

 Poor families in a neighborhood with a high
 concentration of poverty have a double
 disadvantage (Jargowsky, 2015).

 Share of the poor population living in a neighborhood with a 20%+ poverty rate

Link to interactive map: 8
https://www.brookings.edu/research/u-s-concentrated-poverty-in-the-wake-of-the-great-recession/
Progress Towards a Neighborhood Indicator of Poverty

 9
HB 1206 (2019) - Census Tracts and Blocks The Maryland Longitudinal Data System Center Required to develop a protocol for a county board to convert a student’s home address and geolocation information into Census tract and block numbers. Local School Systems Required to convert student addresses into Census tract and block numbers. Maryland State Department of Education Required to collect Census tract and block numbers from Local System, and to provide the collected Census tract and block numbers to the MLDS Center. 10
HB 1206 (2019) - Census Tracts and Blocks

 What are
 Census Tracts
 and Blocks?

Adapted from What are Census Summary Levels (SUMLEV)? using 2010 Census Redistricting Data (Public Law 94-171) Summary File p. 2-6 11
HB 1206 (2019) - Census Tracts and Blocks

 12
Progress Towards a Neighborhood Indicator of Poverty

 13
Maryland Blueprint Interim Report - Highlights

The progress on Update

Analyzing neighborhood indicators of Using the American Community Survey (ACS), Census block
poverty groups have been categorized and a socioeconomic score
 1. The US Census American Community calculated based on a composite index of:
 Survey ● median household income;
 2. The Area Deprivation Index ● adult education level;
 developed by the University of ● home ownership; and
 Wisconsin ● household composition.

Incorporating Medicaid data into the direct MSDE is applying for participation in the USDA Medicaid
certification of students eligible for the Demonstration Project for the 2023 school year. Applications
compensatory education program for that time period are due September 30, 2021 and, if
 approved, MSDE will implement the program July 1, 2022.

Developing and using the State alternative No Alternate Form has been developed by the State.
income eligibility form to determine eligibility
for the compensatory education program

 14
Maryland’s Exploration of a
Neighborhood Poverty Indicator

 Census
 Block
 Group

 Maryland has Using the ACS measures, Census block groups were assigned into one
 3,926 Census each Census block group of five tiers based on the socioeconomic
 block groups* was given a socioeconomic score, with a similar number of school-age
 score and ranked lowest to residents in each Tier.
 highest

*208 block groups (5%) were missing one or more of the selected ACS measures. 15
Maryland’s Exploration of a
 Neighborhood Poverty Indicator

 Median Home Single Educational Block Block
 household ownership Parent Level Groups Groups
 20 = Less than HS
 Tier* income (%) Households (%) 100 = advanced degree (N) (%)
 Tier 1 $158,811 95.0% 7.1% 73.9 650 17.5%
 Tier 2 $113,177 87.3% 15.2% 66.0 705 19.0%
 Tier 3 $88,817 76.7% 25.5% 62.0 770 20.7%
 Tier 4 $69,699 58.7% 38.3% 59.2 793 21.3%
 Tier 5 $46,843 34.6% 69.7% 52.3 800 21.5%

*Tier 5 is considered high poverty/low socioeconomic score and Tier 1 is low poverty/high socioeconomic score.

 16
Maryland’s Exploration of a
Neighborhood Poverty Indicator

Each tier contains a similar
number of school-age residents
(approximately 192,000)
 17
Maryland’s Exploration of a
Neighborhood Poverty Indicator
Socioeconomic Tiers by Local School System

 In Baltimore City,
 54% of the Census
 Block Groups are in
 Tier 5
 (294 out of 544)

 18
Maryland’s Exploration of a
Neighborhood Poverty Indicator
 Percent Tier 4 and Tier 5 in Local School Systems

 19
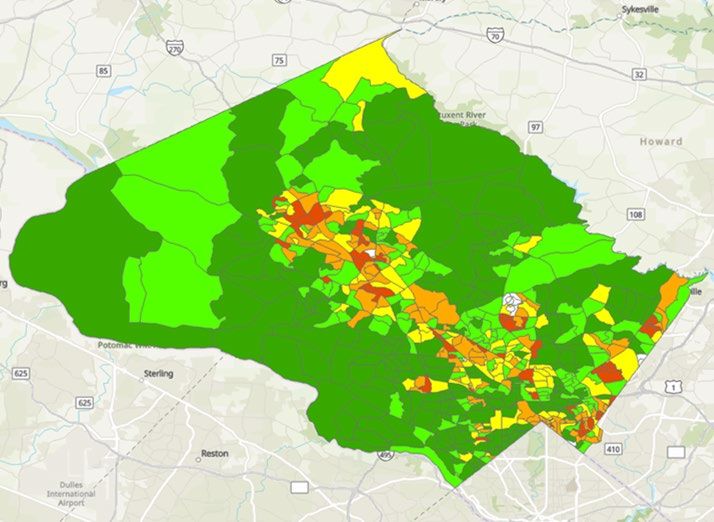
Maryland’s Exploration of a
Neighborhood Poverty Indicator
Howard County Prince
 George’s
 County

 20
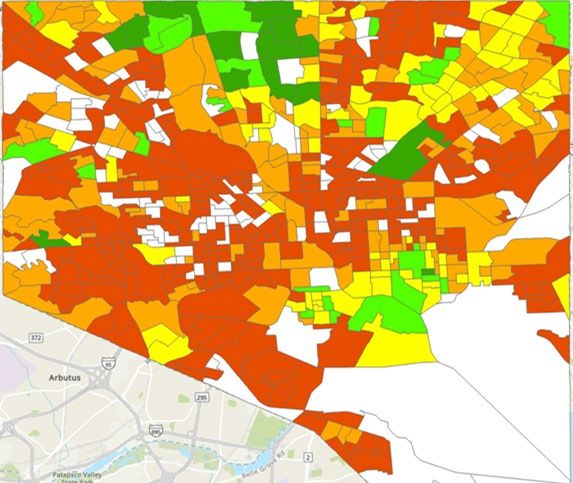
Maryland’s Exploration of a
Neighborhood Poverty Indicator
Baltimore City Montgomery County

 21
Future Explorations

 22
Progress Towards a Neighborhood Indicator of Poverty

 23
National Exploration of a
Neighborhood Poverty Indicator

 With the support of the National
 Center on Education Statistics (NCES)
 and the Institute of Education Sciences
 (IES) participating states will combine
 information, including geolocation of
 students, to summarize existing and
 proposed poverty measures.

 Sixteen states are participating in the
 project to evaluate the value of
 supplementing poverty measures.

 24
National Exploration of a Neighborhood Poverty Indicator New Mexico’s Family Income Index Act signed into law April 2021 • Census data used to identify household income of Funding must be used for: every NM public school student. reading and math interventions, hiring school counselors and social workers, • Calculated each school’s Family Income Index, or the percentage of students in families with the lowest creating family information and resource incomes. centers, adopting culturally and linguistically diverse classroom texts, • Allocated $15 million to 108 schools, with awards ranging from $20,000 to $434,174, to fight offering innovative professional learning concentrated poverty in schools. opportunities, or after-school enrichment. 25
National Exploration of a
Neighborhood Poverty Indicator
 Texas House Bill 3 passed in July 2019
 • Established the Texas Education Agency Statewide Socioeconomic Tier Model for Texas
 School-Age Residents.

 • Census block groups are tiered by income and household characteristics using ACS data.

 • Students are designated as economically disadvantaged by the Census block group where
 their home/residence is located.

 • Increased compensatory education funding for students in lower socioeconomic tiers.

 • Created the Teacher Incentive Allotment, a statewide career ladder initiative to recruit,
 retain, and reward highly impactful teachers to teach in rural and high needs schools.

 26
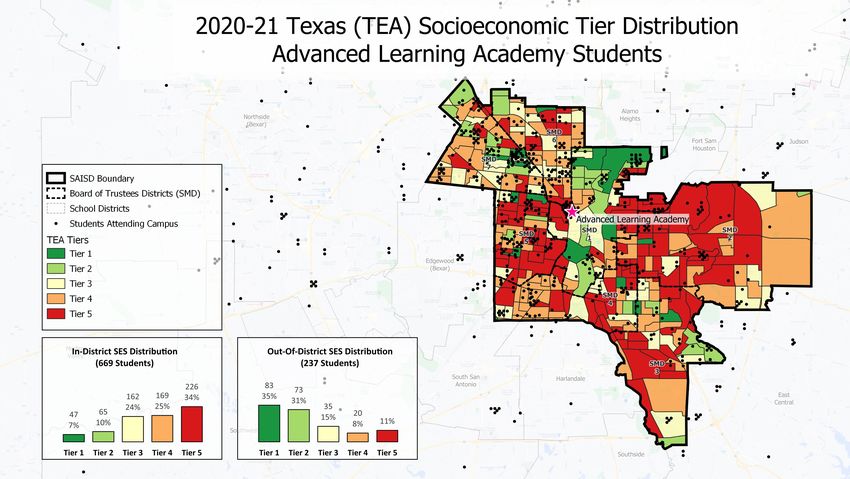
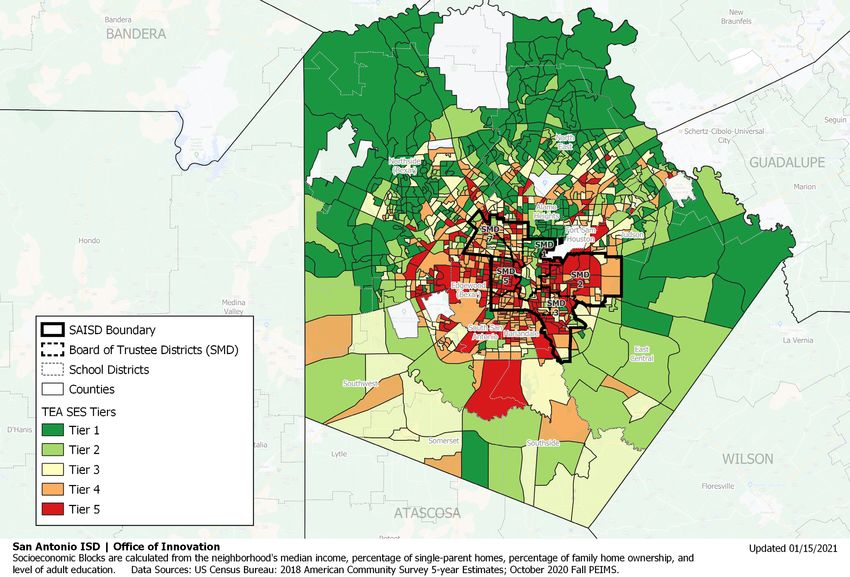
Case Study: Texas
San Antonio ISD
San Antonio ISD is the main urban
core district in Bexar County

 • The district has about 49,000
 students in 90+ campuses
 • 92% students qualifying for Free
 or Reduced Lunch
 • 93% Hispanic Students
 • 6% Black Students
 • 19% English Language Learners
 • 12% Special Education

 27
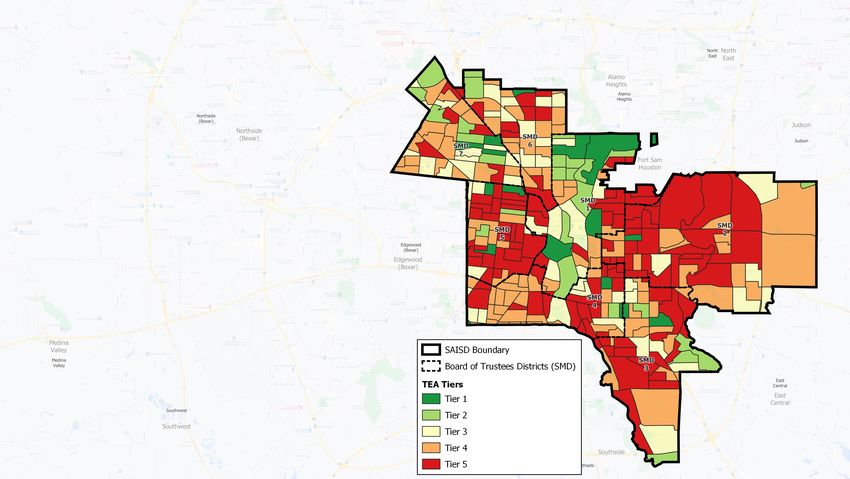
Texas (TEA) Socioeconomic Tiers 2020-2021
 Block Assignments
 321 Census Block Groups categorized into five
 levels based on:
 San Antonio ISD District Boundaries
 • Median Household Income
 • Home Ownership rate
 • Single Parent Households
 • Adult Education Levels
 An equal number of school-aged children reside in
 each of the five colored blocks

 Federal Income Criteria for Family of Four

 Poverty Level: $26,500
 Reduced Lunch Program: $48,470
 Free Lunch Program: $34,060

 SAISD Tier 1 Tier 2 Tier 3 Tier 4 Tier 5
 Econ. Disadv. Students 1,923 4,521 10,499 17,297 26,022
 Median Income $115,651 $57,349 $47,961 $35,936 $26,728
Percent Single Parent Households 17% 24% 34% 45% 56%
 Percent Home Ownership 75% 64% 62% 56% 41%
 Education Score 71% 58% 51% 45% 40%
 Total SES Score 3.01 2.22 1.68 1.15 0.65

 Texas Tier 1 Tier 2 Tier 3 Tier 4 Tier 5
 Econ. Disadv. Students 642,317 642,533 642,740 642,481 584,077
 Median Income $102,627 $61,172 $49,108 $39,185 $28,873
Percent Single Parent Households 13% 24% 33% 42% 56%

 Percent Home Ownership 83% 68% 60% 49% 32%
 Education Score 66% 56% 51% 46% 41%
 Total SES Score 3.15 2.25 1.70 1.19 0.64
You can also read