Introduction to Science - Urban Data Data Grammar - Trivik Verma
←
→
Page content transcription
If your browser does not render page correctly, please read the page content below

Introduction to
  Urban Data
    Science
  Data Grammar
      (EPA1316)
       Lecture 3

     Trivik Verma
                    Kung Fu Panda is property of DreamWorks and Paramount Pictures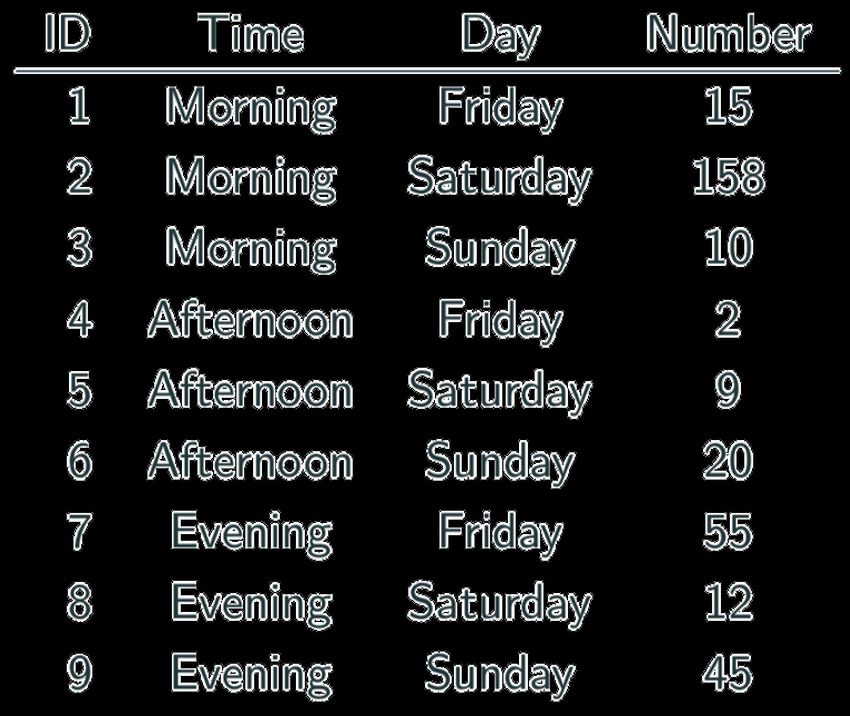
Last Time

•   What are data?
•   Types of (geo-)data
•   Traditional and new sources of spatial data
•   Opportunities and Challenges
•   New ways for traditional approaches

Today

•   Types of Data
•   Grammar
•   EDA without Pandas
•   EDA with Pandas
•   Data Concerns
How were the data sampled?
 Which data are relevant?
 Are there privacy issues?
Types of Data
Types of Data

What kind of values are in your data (data types)?

Simple or atomic:

   Numeric: integers, floats
   Boolean: binary or true false values
   Strings: sequence of symbols
Data Types
What kind of values are in your data (data types)? Compound, composed of a bunch of atomic types:

Date and time: compound value with a specific structure
Lists: a list is a sequence of values
Dictionaries: A dictionary is a collection of key-value pairs, a pair of values x : y where x is usually a string
     called the key representing the “name” of the entry, and y is a value of any type.

Example: Student record: what are x and y?
First: Trivik
Last: Verma
Classes: [EPA1316, EPA1352]
Data Storage How is your data represented and stored (data format)? • Tabular Data: a dataset that is a two-dimensional table, where each row typically represents a single data record, and each column represents one type of measurement (csv, dat, xlsx, etc.). • Structured Data: each data record is presented in a form of a [possibly complex and multi-tiered] dictionary (json, xml, etc.) • Semi structured Data: not all records are represented by the same set of keys or some data records are not represented using the key-value pair structure. • Geographic Data: (shp, dbx, shx…)
Tabular Data
In tabular data, we expect each record or observation to represent a set of
measurements of a single object or event.
Tabular Data
• Each type of measurement is called a
  variable or an attribute of the data
  (e.g. seq_id, status and duration are
  variables or attributes).
• The number of attributes is called the
  dimension. These are often called
  features.
• We expect each table to contain a set
  of records or observations of the same
  kind of object or event (e.g. our table
  above contains observations of
  rides/checkouts).
Types of Data
Important to distinguish between classes of variables or attributes based on the
type of values they can take on.

•   Quantitative variable: is numerical and can be either:
     • discrete - a finite number of values are possible in any bounded interval.
        For example: “Number of siblings” is a discrete variable
     • continuous - an infinite number of values are possible in any bounded
        interval.
        For example: “Height” is a continuous variable

•   Categorical variable: no inherent order among the values
    For example: “What kind of pet you have” is a categorical variable
Common Issues
Common issues with data:
• Missing values: how do we fill in?
• Wrong values: how can we detect and correct?
• Messy format
• Not usable: the data cannot answer the question
posedMessy Data
• The following is a table accounting for the number of produce deliveries over a
weekend.
• What are the variables in this dataset? What object or event are we
measuring?
What’s the issue? How do we fix it?Messy Data We’re measuring individual deliveries; the variables are Time, Day, Number of Produce. Problem: each column header represents a single value rather than a variable. Row headers are “hiding” the Day variable. The values of the variable, “Number of Produce”, is not recorded in a single column.
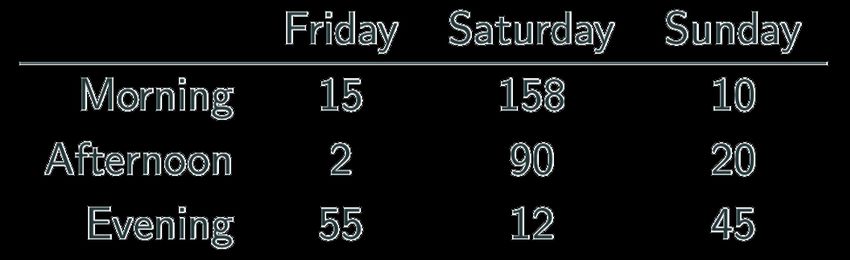
Fixing Messy Data

We need to reorganize the
information to make explicit
the event we’re observing,
and the variables associated
to this event.
Tabular = Happy Me J
Common causes of messiness are:
• Column headers are values, not variable names
• Variables are stored in both rows and columns
• Multiple variables are stored in one column/entry
• Multiple types of experimental units stored in same table

In general, we want each file to correspond to a dataset, each column to represent a
single variable and each row to represent a single observation.

We want to tabularize the data. This makes Python happy.
Grammar
Exploratory Data Analysis (EDA)
    Why?
•    EDA encompasses the “explore data” part of the data science process
•    EDA is crucial but often overlooked:
       •   If your data is bad, your results will be bad
       •   Conversely, understanding your data well can help you create smart,
           appropriate models
Exploratory Data Analysis (EDA)
What?
1. Store data in data structure(s) that will be convenient for exploring/processing
(Memory is fast. Storage is slow)
2. Clean/format the data so that:
• Each row represents a single object/observation/entry
• Each column represents an attribute/property/feature of that entry
• Values are numeric whenever possible
• Columns contain atomic properties that cannot be further decomposed*
* Unlike food waste, which can be composted.
Please consider composting food scraps.Exploratory Data Analysis (EDA)
What? (continued)
3. Explore global properties: use histograms, scatter plots, and aggregation
functions to summarize the data
4. Explore group properties: group like-items together to compare subsets of the
data (are the comparison results reasonable/expected?)
This process transforms your data into a format which is easier to work
with, gives you a basic overview of the data's properties, and likely
generates several questions for you to follow-up in subsequent analysis.Break WATER WALK COFFEE OR TEA MAKE FRIENDS
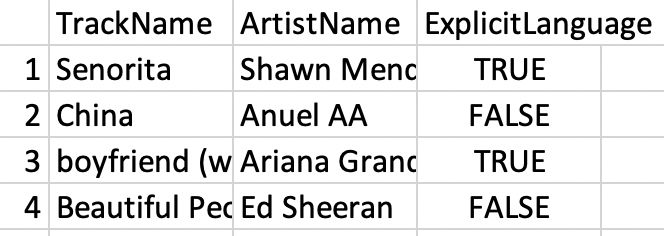
EDA: without Pandas

Say we have a small dataset of the top 50 most-streamed Spotify
songs, globally, for 2019.
EDA: without Pandas
Say we have a small dataset of the top 50 most-streamed Spotify
songs, globally, for 2019.

   NOTE: The following music data are used purely for illustrative, educational
   purposes. The data, including song titles, may include explicit language. TU
   Delft, including myself and the rest of the EPA1316 staff, does not endorse
   any of the entailed contents or the songs themselves, and we apologise if it
   is offensive to anyone in anyway.
EDA: without Pandas
top50.csv

Each row represents a distinct song. The columns are:
•   ID: a unique ID (i.e., 1-50)
•   TrackName: Name of the Track
•   ArtistName: Name of the Artist
•   Genre: the genre of the track
•   BeatsPerMinute: The tempo of the song.
•   Energy: The energy of a song - the higher the value, the more energetic.
•   Danceability: The higher the value, the easier it is to dance to this song.
•   Loudness: The higher the value, the louder the song.
•   Liveness: The higher the value, the more likely the song is a live recording.
•   Valence: The higher the value, the more positive mood for the song.
•   Length: The duration of the song (in seconds).
•   Acousticness: The higher the value, the more acoustic the song is.
•   Speechiness: The higher the value, the more spoken words the song contains.
•   Popularity: The higher the value, the more popular the song is.
EDA: without Pandas

Q1: What are some ways we can store this file into data structure(s) using
regular Python (not the Pandas library).
EDA: without Pandas
                                   top50.csv

Possible Solution #1: A 2D array (i.e., matrix)
Weaknesses:
•   What are the row and column names? Need separate lists for
    them – clumsy.
•   Lists are O(N). We’d need 2 dictionaries just for column names
EDA: without Pandas
top50.csv
Possible Solution #2: A list of dictionaries
list
Item 1 = {“Track.Name”: “Senorita”, “Artist.Name”: “Shawn Mendes”, “Genre”: “Canadian pop”, …}
Item 2 = {“Track.Name”: “China”, “Artist.Name”: “Anuel AA”, “Genre”: “reggaetón flow”, … }
Item 3 = {“Track.Name”: “Ariana Grande”, “Artist.Name”: “boyfriend”, “Genre”: “dance pop”, … }EDA: list of dictionaries Possible Solution #2: A list of dictionaries
EDA: list of dictionaries
Possible Solution #2: A list of dictionaries
Q2: Write code to print all songs (Artist and Track name) that are
longer than 4 minutes (240 seconds):EDA: list of dictionaries
Possible Solution #2: A list of dictionaries
Q3: Write code to print the most popular song (artist and track) – if ties,
show all ties.EDA: list of dictionaries
Possible Solution #2: A list of dictionaries
Q4: Write code to print the songs (and their attributes), if we sorted by
their popularity (highest scoring ones first).
list
Item 1 = {“Track.Name”: “Senorita”, “Artist.Name”: “Shawn Mendes”, “Genre”: “Canadian pop”, …}
Item 2 = {“Track.Name”: “China”, “Artist.Name”: “Anuel AA”, “Genre”: “reggaetón flow”, … }
Item 3 = {“Track.Name”: “Ariana Grande”, “Artist.Name”: “boyfriend”, “Genre”: “dance pop”, … }
Cumbersome to move dictionaries around in a list.
Problematic even if we don’t move the dictionaries.EDA: list of dictionaries
Possible Solution #2: A list of dictionaries
Q5: How could you check for null/empty entries? This is only 50
entries. Imagine if we had 500,000.
list
Item 1 = {“Track.Name”: “Senorita”, “Artist.Name”: “Shawn Mendes”, “Genre”: “Canadian pop”, …}
Item 2 = {“Track.Name”: “China”, “Artist.Name”: “Anuel AA”, “Genre”: “reggaetón flow”, … }
Item 3 = {“Track.Name”: “Ariana Grande”, “Artist.Name”: “boyfriend”, “Genre”: “dance pop”, … }EDA: list of dictionaries
Possible Solution #2: A list of dictionaries
Q6: Imagine we had another table* below (i.e., .csv file). How could we
combine its data with our already-existing dataset?
spotify_aux.csv
* 3rd column is made-up by me. Random values. Pretend they’re accurate.EDA: with Pandas! Kung Fu Panda is property of DreamWorks and Paramount Pictures
EDA: with Pandas
What / Why?
• Pandas is an open-source Python library (anyone can contribute)
• Allows for high-performance, easy-to-use data structures and data analysis
• Unlike NumPy library which provides multi-dimensional arrays, Pandas
provides 2D table object called DataFrame
(akin to a spreadsheet with column names and row labels).
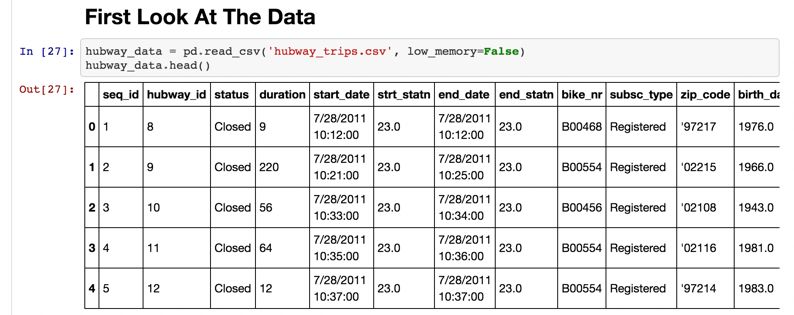
• Used by a lot of peopleEDA: with Pandas How • import pandas library (convenient to rename it) • Use read_csv() function
EDA: with Pandas

Common Panda functions
High-level viewing:
•   head() – first N observations
•   tail() – last N observations
•   columns() – names of the columns
•   describe() – statistics of the quantitative
    data
•   dtypes() – the data types of the columns
EDA: with Pandas Common Panda functions Accessing/processing: • df[“column_name”] • df.column_name • .max(), .min(), .idxmax(), .idxmin() • • .loc[] – label-based accessing • .iloc[] – index-based accessing • .sort_values() • .isnull(), .notnull()
EDA: with Pandas

Common Panda functions
Grouping/Splitting/Aggregating:
•   groupby(), .get_groups()
•   .merge()
•   .concat()
•   .aggegate()
•   .append()
Data Concerns

When determining if a dataset is sound to use, it can be useful to think about
these four questions:
•   Did it come from a trustworthy, authoritative source?
•   Is the data a complete sample?
•   Does the data seem correct?
•   (optional) Is the data stored efficiently or does it have redundancies?
Data Concerns: the format

•   Often, there may not exist a single dataset that contains all the information
    we are interested in.
•   May need to merge existing datasets
•   Important to do so in a sound and efficient format
Data Concerns: the format
Dataset 1 Dataset 2
Top 200 most-frequent streams per day (for June 2019) Top 50 most streamed in 2019, so far
SpotifySongID, # of Streams, Date
2789179, 42003, 06-01
. SpotifySongID, Artist, Track, [10 acoustic features]
200
. 2789179, Billie Eilish, bad guy, 3.2, 5.9, …
3819390, 89103, 06-01 .
50 .
4492014, 52923, 06-02 3901829, Outkast, Elevators, 9.3, 5,1, …
.
200 . 50 x 13
8593013, 189145, 06-02
6,000 x 3Data Concerns: the format We are interested in determining if songs with high danceability are more popular during the weekends of June than weekdays in June. What should our merged table look like? Concerns?
Data Concerns: the format
 This is wasteful, as it has 10 acoustic features, artist, and track repeated many times for each
 unique song.

                               Datasets Merged (poorly)
      SpotifySongID, # of Streams, Date,        Artist, Track, [10 acoustic features]

         2789179,        42003,      06-01     Billie Eilish, bad guy, 3.2, 5.9, …
             .
200
             .
         3819390,        89103,      06-01     Outkast,    Elevators, 9.3, 5,1, …

         4492014,        52923,      06-02
             .
200          .
         8593013,        189145,      06-02

                                       6,000 x 15 è 90,000 cells
Data Concerns: the format
Some rows may have null values for # of Streams (if the song wasn’t popular in June)
Datasets Merged (better)
SpotifySongID, Artist, Track, [10 acoustic features], 06-01 Streams, 06-02 Streams
2789179, Billie Eilish, bad guy, 3.2, 5.9, …, 42003, 42831, 43919
.
50 .
3901829, Outkast, Elevators, 9.3, 5,1, … 29109, 27193, 25982
50 x 43 è 2,150 cellsData Concerns: the format • Is the data correctly constructed (or are values wrong)? • Is there redundant data in our merged table? • Missing values?
For next class..

Finish Lab 02 to practice   Submit Homework 02 for   Check Assignment 1 – due    See “To do before class”     Read paper for Discussion     Post questions on the
      programming             peer review on Peer     in Week 3 on Friday at    for every lecture (~ 1 hour     session before every         Discussion forum on
                                                               2330                    of self study)                  Friday             Brightspace (especially on
                                                                                                                                                   Pandas)
You can also read