Investor Presentation - CITI-SGX-REITAS REITs and Sponsors Forum 2021 August 2021
←
→
Page content transcription
If your browser does not render page correctly, please read the page content below
Investor Presentation
CITI-SGX-REITAS REITs and Sponsors Forum 2021
August 2021
Important Notice
This announcement is for information only and does not constitute or form part of an offer, invitation or solicitation of any
offer to purchase or subscribe for units in Elite Commercial REIT (“Units”) in Singapore or any other jurisdiction nor should it
or any part of it form the basis of, or be relied upon in connection with, any contract or commitment whatsoever. This
presentation may contain forward-looking statements that involve assumptions, risks and uncertainties. Actual future
performance, outcomes and results may differ materially from those expressed in forward-looking statements as a result of
a number of risks. Representative examples of these factors include (without limitation) general industry and economic
conditions, interest rate trends, cost of capital and capital availability, competition from other developments or companies,
shifts in expected levels of occupancy rate, property rental income, charge out collections, changes in operating expenses,
property expenses, governmental and public policy changes and the continued availability of financing in the amounts and
the terms necessary to support future business.
You are cautioned not to place undue reliance on these forward-looking statements, which are based on the Manager’s
current view on future events. No representation or warranty express or implied is made as to, and no reliance should be
placed on, the fairness, accuracy, completeness or correctness of the information or opinions contained in this
presentation. Neither the Manager nor any of its affiliates, advisers or representatives shall have any liability whatsoever (in
negligence or otherwise) for any loss howsoever arising, whether directly or indirectly, from any use of, reliance on or
distribution of this presentation or its contents or otherwise arising in connection with this presentation.
The past performance of Elite Commercial REIT is not indicative of future performance. The listing of the Units on the
Singapore Exchange Securities Trading Limited (“SGX-ST”) does not guarantee a liquid market for the Units. The value of the
Units and the income derived from them may fall as well as rise. The Units are not obligations of, deposits in, or guaranteed
by Elite Commercial REIT, the Manager or any of their respective affiliates. An investment in the Units is subject to
investment risks, including the possible loss of the principal amount invested. The Unitholders have no right to request the
Manager to redeem or purchase their Units while the Units are listed. It is intended that Unitholders may only deal in their
Units through trading on the Singapore Exchange Securities Trading Limited (“SGX-ST”). Listing of the Units on the SGX-ST
does not guarantee a liquid market for the Units.

Oversea-Chinese Banking Corporation Limited ("OCBC") and UBS AG, Singapore Branch ("UBS") are the joint issue managers for the
Offering. OCBC, UBS, CGS-CIMB Securities (Singapore) Pte. Ltd. and China International Capital Corporation (Singapore) Pte. Limited
are the joint bookrunners and underwriters for the Offering (collectively, the "Joint Bookrunners").

                                                                                                                                      1
Content

      I. About Elite Commercial REIT

      II. Portfolio Performance

      III. Financial Highlights – 1H2021

      IV. Experienced Sponsors & Management Team

      V. Moving Forward

      VI. Appendix

                                                   2
Section I

About Elite Commercial REIT

                              Nutwood House, Canterbury
First & Only UK-Focused S-REIT
Over 99% Leased to the AA-rated UK Government1

                                                                                                  AA-rated
      £515.3m(2)                                          155                                   UK Government                                    100%
      Portfolio value                                Office Assets                               credit rating                               Occupancy Rate

                                                      Triple Net                                Every 5 years
           97%                                   Full Repairing &                                Built in Inflation-
                                                                                                linked Rent Uplift
                                                                                                                                             6.6 years(5)
          Freehold(3)                           Insuring Leases(4)                                                                                Long WALE

 High Road, Ilford                                            Holborn House, Derby                                           Glasgow Benefits Centre, Glasgow

Notes:                                                                                      Notes:
1. Majority of the leases are signed by the Secretary of State for Housing, Communities     4. The Tenant (UK Government) is responsible for the full maintenance and repair of
   and Local Government, which is a Crown Body.                                             external, internal and structural format of the property and landlord (Elite Commercial
2. As at 31 December 2020.                                                                  REIT) has no repairing or insuring liability.
3. 150 properties are on freehold tenures and 5 properties are on long leasehold tenures.   5. As at 30 June 2021.                                                              4
Key Investment Merits

  1      Attractive & defensive, recession-proof yields
         Over 99% leased to the AA-rated UK Government

         Geographically diversified
  2      A network of assets across the UK

         Crucial public infrastructure
  3      Primarily occupied by the Department for Work and Pensions

         Well-located assets
  4      Primarily in town centres, close to transportation nodes & amenities

         Future growth potential
  5      Acquisition pipelines, asset enhancement & redevelopment potential

                                                                                5
Defensive & Recession-Proof Yields
Attractive yield spread in a “lower for longer” interest rate environment
Portfolio NPI yield against comparable benchmarks
8.0 Portfolio
NPI Yield(1)
7.0
6.2%
6.0
5.0 ~570 bps
4.0 Yield spread
Yield (%)
to 10Y UK
3.0
Govt bond
2.0
1.0
0.0
2000
2001
2002
2003
2004
2005
2006
2007
2008
2009
2010
2011
2012
2013
2014
2015
2016
2017
2018
2019
2020
2021
2022
Bank of England base rate UK Government 10 year bond yield UK regional office prime yield
Note:
1. Based on annualised 1H2021 net property income (NPI) and portfolio valuation as at 31 December 2020.
Annual increase in CPI
2019-2023E CPI
Inflation rate (%)
4.5 CAGR 2.3%
3.6 4.0
3.3
2.8 2.6 2.7 2.5 2.5
2.1 2.3 2.3 2.2 2.0
1.5 1.8
1.2 1.3 1.4 1.3
0.8 0.7 0.6
0.0
2000
2001
2002
2003
2004
2005
2006
2007
2008
2009
2010
2011
2012
2013
2014
2015
2016
2017
2018
2019
2020
2021E
2022E
2023E
Source: FactSet, Bloomberg, Savills UK Regional Office Investment Market Watch, Office for Budget Responsibility, Office for National Statistics, Bank of England Monetary
6
Policy Report (May 2021, August 2021)
Geographically Diversified
A network of assets across the UK

                                                 Population density

                                                       Densely populated areas
                                                       Less densely populated areas
                                                       IPO Portfolio
                                                       Properties from Maiden Acquisition

Parklands, Falkirk
                                                                   Dundee

                                    Glasgow                       Edinburgh

                                                                  Newcastle
                                                                  Sunderland

                                    Blackpool

                                    Liverpool                     Manchester
Blackburn Road, Burnley                                           Nottingham

                                    Birmingham

                                                                            Milton
                                                                            Keynes
                                    Cardiff                                 London
                                    Bristol

                                    Plymouth
                                                     Brighton

Peel Park, Blackpool
                                                                                            7
Crucial Public Infrastructure
Department for Work & Pensions is integral in supporting UK’s social fabric
UK’s Largest Public Service Department
Responsible for welfare, pensions and child maintenance policy
Over 22 million claimants(1); £212.4 billion benefit spent in
FY20/21 and £218.3 billion benefit planned for FY21/22(2)
Services provided primarily via Jobcentre Plus centres (“JCP”)
Front Line in UK’s Emergency Economic Response
Leading UK’s national recovery through Plan for Jobs and more
In March 2021, the UK Government met its pledge to recruit
13,500 new Work Coaches(3) which has boosted jobseeker support
in towns and cities UK-wide, in one of their fastest and largest ever
recruitment rounds(4)
JCP locations remained open throughout the nation’s first, second
and third lockdowns to process and disburse benefits to claimants
COVID-19 situation does not trigger force majeure or termination
clauses of the leases with the UK Government
Built-in Upside from Inflation-Linked Rental Uplift
Rent reviews in the fifth year (2023) for UK Government leases
Based on the UK Consumer Price Index (“CPI”), subject to an annual
minimum increase of 1.0% and maximum of 5.0%
Potential revaluation upon lease breaks not exercised
Notes:
1. “National Statistics, DWP benefits statistics: February 2021”, Gov.UK, 23 February 2021
2. “Corporate report, DWP Annual Report & Accounts 2020 to 2021”, Gov.UK, 15 July 2021
3. Work Coaches provide jobseekers with tailored support to build their skills, develop CVs and find new jobs in expanding sectors
8
4. “Government delivers 13,500 Work Coaches to boost Britain’s Jobs Army’, Gov.UK, 29 March 2021
Crucial Public Infrastructure
For the provision of essential social welfare services by DWP

  Front of house – primarily Jobcentre Plus and other ancillary services
                Jobcentre Plus - Usage highly correlated with unemployment
    1           • Staff readily on hand to assist customers with mock interviews, “Back to Work” plan, etc.
                • Computers and free wifi for customers to job-surf, write CVs or make claims

             Pension Services - Usage expected to increase as population ages
   2         • Face-to-face meetings to claim benefits
                                                                                                                      82%(1)

             • IT training to assist retirees with no internet access or difficulty using online services

             Child Maintenance Services - Stable usage regardless of economic conditions
    3        • Face-to-face meetings to discuss more complicated child maintenance cases
             • Registration and declaration of child maintenance received

             Disability Services - Stable usage regardless of economic conditions
    4        • On-site medical examination centres as part of the Work Capability Assessment for disability benefit
             • Training programmes such as Specialist Employability Support and Work and Health Programmes

  Back of house – various support functions without public-facing element
            Support functions – Usually larger, critical centres for supporting the administration of
    5       DWP services
            •     Service roll out planning (e.g. Universal Credit)
            •     Claims processing, finance and accounts
            •     Fraud detection and investigation
            •     Call centre & IT support

 Source: Independent Market Report, Department for Work & Pensions
                                                                                                                               9
Well-located Assets
Primarily in town centres, close to transportation nodes & amenities(1)
Proximity to bus stops
Centrally 74% located in town centres, city centres and 70 Average walk:
Located(1) suburbs 2.2 minutes
Number of properties
100% within 10 minutes walk from bus stop 19
Easily
6
Accessible(1) 2
60% within 15 minutes walk from train station 0
5 5 4 3 2 1
Notes:
1. Statistics refer to IPO Portfolio of 97 properties Number of supermarkets
2. Percentage based on number of properties
3. Supermarkets comprise small to large supermarkets
4. Medical facilities comprise hospitals and general practices
5. Schools comprise primary schools, secondary schools and independent schools 10Section II
Portfolio Performance
Nutwood House, CanterburyMaiden Acquisition Completed on 9 March 2021
Rationale: Executing growth strategy Expansion of Current Portfolio
1. Extends the REIT’s exposure to UK sovereign credit, 60% increase in number of properties
whilst diversifying occupier mix
2. Stable cashflows and CPI-linked growth from uniquely 39% increase in market cap
counter-cyclical occupier
3. Increases exposure to London
4. Increases size, market cap, free float and liquidity
5. DPU accretive, with attractive yields relative to Existing
Portfolio
Bridgwater
About the Acquisition
WALE 7.4
58 Number of Assets (Weighted Average
years
Lease Expiry)
Basildon
Annual GRI from UK £212.5
98.8% Government tenants
Acquisition Value
mil
London Exposure
100% Occupancy Rate
(by value) 35.9%
New UK South Hampton Chester
Freehold Properties
92.3% (by NIA)
Government 5
Vendors
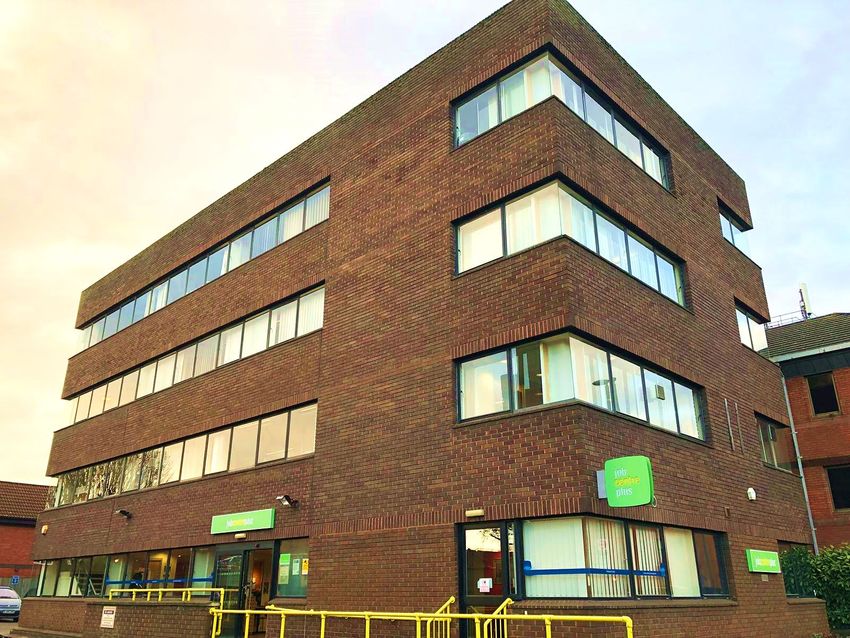
12Resilient Portfolio with Income Visibility
Assets stay relevant as utilisation by tenant remains high
Steady Portfolio Performance
100% portfolio occupancy rate as at 30 June 2021
Long weighted average lease to expiry (WALE) of 6.6
years
Crown Building, Banbury
Consistent Rent Collection in Advance
Received in advance 99.7% of the rent for the
period spanning across the three months of July 2021
to September 2021, within seven days of the due date
Consistently achieved ~100% of rent collection in
Crown House, Worthing
advance since listing, amid Brexit and UK lockdowns
Lease Event
Lease break option for The Forum, Stevenage is not
exercised
Lease will continue to run until 31 March 2028 The Forum, Stevenage
13Notable Property Developments
Buy offer above valuation received for East Street, Epsom
Demand for Well-Located Assets
Lease break for the property at East Street, Epsom, has been exercised
Received a buy offer at £2.9 million, ~21% above valuation of £2.4 million(1)
The Manager is undertaking due diligence on the offer and purchaser; and is also reviewing
potential asset enhancement initiatives
The building is well-located within Epsom, as it is within 7 minutes’ walk to the town centre
and less than 10 minutes’ walk to the Epsom Railway Station
The asset offers potential for continued commercial use or conversion or redevelopment for
alternative uses
EAST
STREET,
EPSOM
EPSOM
RAILWAY
STATION
TOWN
CENTRE 5-minute walk
East Street, Epsom
10-minute walk
Note:
1. As at 31 December 2020. 14Resilient Portfolio and Income Visibility
Full occupancy, Long WALE of 6.6 years
Lease Expiry Profile as at 30 June 2021 (% of total portfolio rent)
(1)
100% 92.9% % of rent by WALE
(2)
% of rent by WALB
80%
63.7%
60%
40% 31.6%
20%
3.8% 0.4%
0.4% 0.1% 2.1% 2.3% 0.4%
1.3% 1.0%
0%
2021 2022 2023 2024 2025 2026 2027 2028 2029 2030
Proactive asset management steps taken
Tenant Engagement Management Reinforcement Data Collection & Analysis
Regular active dialogue Additional boots on the Insight into utilisation of
with tenants ground assets by tenants
Notes:
1. Percentage of rent by WALE (Weighted Average Lease to Expiry) – Based on the final termination date of the agreement (assuming the tenant does not terminate the lease
on the permissible break dates)
2. Percentage of rent by WALB (Weighted Average Lease to Break) – Based on the next permissible break date at the tenant’s election and pursuant to the lease agreement
15More Diversified and Resilient
Enlarged Portfolio with ~14.1% exposure to London
Extends exposure to
Diversify Tenant Mix
UK sovereign credit
Tenant Breakdown by Gross Rental Income Portfolio Breakdown by Valuation
Yorkshire
1.8% 1.2% 1.1% 1.0% & Humber East
North 3.3%
East 2.0%
2.1% 4.5%
London
Wales 14.1%
5.8%
Midlands
7.6% South
East
£515.3m(1)
17.7%
South
West
8.0%
North
Scotland
West
92.8% 18.7%
18.3%
Other tenants
Note:
1. As at 31 December 2020.
16Section III
Financial Highlights
1H2021
Parklands, Falkirk
171H2021 DPU Growth Exceeded Projection
Outperformance over IPO Projection(1) and Actual 1H2020(2)
Boosted by ~ 4 months contribution from newly acquired portfolio
Income available for distribution to Distribution per unit (pence)
unitholders
12,000 11,161 3.00
+8.7% 2.63
(3)
+37.1% 2.42
8,141 1.95
8,000 2.00
6,517
+34.9%
+71.3%
4,000 1.00
0.90
0 0.00
Actual IPO Actual Actual IPO Actual
(6 Feb 20 - 30 Jun 20) Projection 1H 2021 (6 Feb 20 - 30 Jun 20) Projection 1H 2021
Notes:
1. IPO Projection refers to the profit projection for the period from 1 January 2021 to 30 June 2021. The projection figures were derived by pro-rating the financials of IPO Projection Year 2021 as
disclosed in the Prospectus.
2. Actual 1H2020 refers to the financial period from Listing Date of 6 February 2020 to 30 June 2020. Actual financial results from Listing Date to 30 June 2020 is the first reporting period incorporating
the results of the initial portfolio held directly by Elite Commercial REIT. Although Elite Commercial REIT was constituted on 7 June 2018, the initial public offering was completed on 6 February 2020
which was the official listing date of Elite Commercial REIT.
3. The DPU of 2.63 pence includes the advanced distribution of 0.90 pence per Unit for the period from 1 January 2021 to 8 March 2021 that was paid on 15 April 2021. 18Review of Financial Performance – 1H2021
1H2020
1H2021
(6 Feb 2020 to 30 June 2020)
Actual Projection(1) Variance Actual(2) Variance
£’000 £’000 % £’000 %
Revenue 15,896 11,541 37.7 9,316 70.6
Net property income 15,386 11,234 37.0 9,055 69.9
Income available for
11,161 8,141 37.1 6,517 71.3
distribution to Unitholders
Distribution per unit
2.63(3) 2.42 8.7 1.95 34.9
(“DPU”) - pence
Notes:
1. IPO Projection refers to the profit projection for the period from 1 January 2021 to 30 June 2021. The projection figures were derived by pro-rating the financials of IPO Projection Year 2021 as
disclosed in the Prospectus.
2. Actual 1H2020 refers to the financial period from Listing Date of 6 February 2020 to 30 June 2020. Actual financial results from Listing Date to 30 June 2020 is the first reporting period
incorporating the results of the initial portfolio held directly by Elite Commercial REIT. Although Elite Commercial REIT was constituted on 7 June 2018, the initial public offering was
completed on 6 February 2020 which was the official listing date of Elite Commercial REIT.
3. The DPU of 2.63 pence includes the advanced distribution of 0.90 pence per Unit for the period from 1 January 2021 to 8 March 2021 that was paid on 15 April 2021.
19Healthy Balance Sheet
As at 30 June 2021
£’000
Non-current assets 516,528(1)
Current assets 24,996
Total assets 541,524
Non-current liabilities 225,807
Current liabilities 22,602
Total liabilities 248,409
Net assets / Unitholders’ funds 293,115
Units in issue and issuable (‘000) 471,363
Net asset value per unit (£) 0.62
Notes:
1. Non-current assets comprise investment properties, which are stated at their fair values. The carrying values of the investment properties as at 30 June 2021 were
subject to both external and internal assessments. Colliers International Valuation UK LLP were instructed to conduct desktop assessment of the fair values for a sample
of properties. The Manager also undertook an internal assessment of the assets not included in the Colliers’ assessment sample. The Manager has taken into
consideration the portfolio being 100% occupied, the close to 100% rental collection statistics, the stability of market rents, the current pricing of comparable investment
transactions in the UK, the yield rates and the current relatively stable condition of the UK economy. Overall, the Manager has assessed that the carrying values of the
investment properties as at 30 June 2021 approximate their fair values.
20Prudent Capital Management
Debt Maturity Profile (£ m) Credit Metrics
6
£228m Total Debt
Gearing Ratio 42.1%
14
~1.9% Borrowing Costs
125 Average Weighted 2.5
Debt Maturity years
80
6.4 X Interest Coverage Ratio
Fixed Interest Rate Exposure 63%
9
2021 2022 2023 2024 2025 and Proportion of
61%
beyond Unencumbered Assets(1)
Undrawn Capacity Bridge Loan
RCF Term Loan Facility Available Debt Headroom(2) ~£29m
Notes:
1. Based on valuations; unencumbered assets refer to properties without land mortgages
2. Based on gearing ratio of 45%; available debt headroom is ~£85m based on gearing ratio of 50% 21Future-Proofing the REIT
Enhancing Tax Efficiencies Strengthening Balance Sheet
Application for Elite UK Commercial Holdings Establishment of Distribution Reinvestment
Limited (“ECHL”) to be admitted on The Plan (“DRP”)
International Stock Exchange (“TISE”) as a
listed UK REIT Rationale:
Provide unitholders with an opportunity to
Rationale:
increase unitholding in Elite Commercial REIT
Tax treatment of Elite Commercial REIT is without incurring brokerage fees, stamp duties (if
expected to be on par with other UK REITs any) and other related costs
The principal tax rate applicable to Elite Will strengthen Elite Commercial REIT’s balance
Commercial REIT is expected be reduced to 15% sheet, enhance its working capital reserves and
from the current 19% improve the liquidity of the Units
Any latent capital gains and its corresponding Unitholders may elect to receive fully paid new
deferred tax liabilities of the properties currently units in lieu of distribution, or to receive
held by Elite Commercial REIT will be eliminated distribution entirely in GBP or SGD
Estimated completion Application of DRP to
3Q 20211 1H2021 Distribution
Notes:
1. There is no assurance that it will be successfully completed. Prior to ECHL’s admission to the International Stock Exchange (“TISE”), the income and gains of Elite
Commercial REIT’s subsidiaries in the UK would continue to be subjected to the prevailing UK corporate tax. 22Resilient Trading Performance
Recession-proof amid COVID-19 Pandemic and Brexit
120% Relative unit price performance of Elite Commercial REIT against indices
(From Listing to 30 June 2021)
ELITE: -1.5%
% change in unit price /index value
100%
STI: -2.1%
iEdge S-REIT: -7.8%
80%
Note:
60%
1. Percentage change in
ELITE STI iEdge S-REIT index unit price/index value for
Elite Commercial REIT is
40% based on IPO price of
GBP0.68 and indices are
based on 5 February
2020 closing price.
Intensified Investor Relations Efforts
Research House Coverage Virtual Conferences and Webinars
RHB Webinar: Building A Nest Egg With
Initiated coverage Singapore Real Estate Investments Trusts
“BUY” “ADD” “BUY” “BUY” SGX-REITAS Webinar
Target price Target price Target price Target price REITs Symposium 2021
£0.75 £0.83 £0.95 £0.80 CGS-CIMB Malaysia and Singapore Joint
Included in the RHB Small Cap Top 20 Jewels Retail Investors Webinar
2021 Edition in May 2021 The Edge REITs Investment Forum
23Section IV
Experienced Sponsors &
Management Team
Parklands, Falkirk
24Elite Commercial REIT Sponsors
Elite Partners Holdings Ho Lee Group Sunway RE Capital
Pte. Ltd. ("EPH") Pte. Ltd. ("HLG") Pte. Ltd. ("Sunway")
The investment holding firm for Incorporated in 1996 through Wholly-owned subsidiary of
Elite Partners Group, the amalgamation of various Sunway Berhad, one of
established to deliver lasting construction-related Malaysia’s largest
value for investors based on businesses, and acquired Wee conglomerates
common interests, long-term Poh Construction Co. Pte. Ltd.
perspectives and a disciplined in 2005 Has businesses in property
approach development, property
Extensive experience in investment and REIT,
Backed by a team with proven development of industrial and construction, healthcare,
expertise in private equity and residential properties hospitality, leisure, quarry,
REITs building materials, and trading
One of the major sponsors of
and manufacturing
Investment philosophy aims to Viva Industrial Trust during its
protect investors' initial capital, IPO listing in November 2013 Sunway Berhad Group
enhance investment value and comprises three public listed
create new growth entities: Sunway Berhad,
opportunities Sunway Construction Group
Berhad and Sunway REIT
25Key Management
Shaldine Wang Joel Cheah, CFA
Chief Executive Officer Chief Financial Officer
• Over 20 years of experience in corporate • Over 13 years of experience in finance,
finance, financial management and capital markets, treasury and strategic
investments planning
• Previously, Head of Projects at Sime Darby • Previously, Senior Vice President of Finance
Real Estate Management Pte. Ltd., Group for the Manager of an SGX-listed hospitality
Finance Director of China Huarong Energy trust and Treasurer at Cambridge Industrial
Company Limited, Chief Financial Officer of Trust Management Limited.
the trustee-manager of Pacific Shipping
Trust and Head of Investment at Cambridge
Industrial Trust Management Limited.
Jonathan Edmunds Chai Hung Yin
Chief Investment Officer Assistant Vice President, Investor Relations
• Over 18 years of experience in the real • Over 16 years of experience in investor
estate industry, focusing on real estate relations, corporate communications and
investment and management across journalism
various sectors globally, and capital raising
• Previously, Assistant Vice President of
• Previously, Director of the Real Estate Investor Relations and Corporate
department of AEP Investment Communications for YTL Starhill Global REIT
Management Pte. Ltd., as well as of WW Management Limited and a journalist with
Advisors Ltd. and lead manager of Basil various newspapers, including The Business
Property Trust. Times Singapore.
26Section V
Moving Forward
Nutwood House, CanterburyMoving Forward
Rebound in UK Economy Increased Utilisation of DWP’s Services
7.25% 2.0% 4.7% 2.33mil
UK economy’s GDP Consumer Prices Unemployment DWP’s claimant count
growth forecast Index (CPI) in the 12 rate in UK in May 2021 remains
in 2021 months to July 2021 April-June 2021 high vs pre-pandemic
Steady Operations & Growth Potential Expected Increase in Utilisation of Assets
Stable Acquisition
income opportunities 5.5% Sept 30
Minimal COVID-19 ROFR pipeline from Unemployment Coronavirus Job
impact on business Sponsors & open projected to peak Retention Scheme
and rent collection market supply in 3Q2021 (furlough) expiry
28Confidential
Thank You
For enquiries, please contact:
Ms CHAI Hung Yin, Investor Relations
Elite Commercial REIT Management Pte. Ltd.
DID: +(65) 6955 9977 Main: +(65) 6955 9999 Email: hungyin.chai@elitecreit.com
Address: 8 Temasek Boulevard, #37-02 Suntec Tower Three, Singapore 038988
https://www.elitecreit.com/
Follow us on LinkedIn:
https://www.linkedin.com/company/elitecreit LinkedIn ELITECREIT
Page WebsiteSection VI
Appendix
Nutwood House, CanterburyTypical Lease Arrangements for the UK Office Sector
Lease terms:
– Lease terms are fixed and typically for 5-10 years
Rent increase/review:
– Rents are reviewed against the open market rent typically every 5 years. Reviews for shorter leases may be more frequent.
Commercial leases typically impose upward only rent reviews which allow for rents to be increased but never decreased
Service charge:
– The tenant is responsible for pro-rated share in addition to the rent, payable quarterly
Break clauses:
– The landlord may grant a break clause which gives one or either party the right to end the lease sooner by giving notice either
at any time or between specified dates
Assignment/Subletting:
– Landlords' approval for subletting and assignment is generally not to be unreasonably withheld but parameters are set out in
the lease terms. Subleases are often granted outside the protection of the Landlord and Tenant Act 1954 (as amended)
Repairs and insurance:
– Usually, the tenant will have direct responsibility for repairing the internal parts included in the lease terms and the landlord
will agree to repair and insure the external structure and the common parts retained by the landlord. The landlord’s costs for
repairs and insurance are typically borne by the tenants via the service charge
– Tenants will usually be made responsible for the regular redecoration of the premises let out under the leases
Alterations:
– The landlord may restrict alterations that can be made to the demise and alterations will usually require the landlord’s
consent. The landlord has the right to insist that the tenant removes the alterations and restores the premises at the end of the
lease
Dilapidations:
– The tenant has the responsibility to return the building to its original condition at the end of the lease. The term 'dilapidations'
is normally used to cover defects and disrepair that the tenant will be required to deal with or pay to have remedied when they
vacate the premises at the end of the lease. Landlords cannot generally make dilapidations claims earlier than three years
before the end of the lease
31Case study—Front of House
High Road, Ilford
Seven Kings
Post Office ALDI
Seven Kings Train Station
Cameron House Children's Home
Bus Stop
Cemo supermarket
Bombardier Transportation Pharmaram Dispensing
Ilford Fire Station Chemists
Poundland
Ilford Advice Wise
Train station The Exchange Solicitors
Ilford High Road
The commercial and retail Esso Tesco Ilford Express
Goodmayes
road of Ilford
Redbridge Library
Redbridge museum
Town hall
Legend
Subject Property Amenities Transportation Religious centres Schools
Organisations Attractions 0.5 mile / 0.80 km 1.0 mile / 1.6 km
Overview • Located in Ilford, within the London Borough of Redbridge, 9 miles north east of Central London and 6 miles west of Romford
• Modern three storey purpose built office building. Brick clad with double glazing windows
• Jobcentre Plus on the ground floor
Connectivity • Situated on the High Road; eastern periphery of town centre
• 0.2 miles from Seven Kings Station; frequent connections to London Liverpool Street Station (20 min journey)
Key • Site area: 0.12 ha • Valuation: £6.5m(1)
statistics • NIA: 18,741 sq ft • Rent: £356,394 pa; £19.02 psf
• Freehold • Lease terms(2): 10 year lease with 5 year break
Notes:
1. As at 31 December 2020.
2. As at lease renewal on 31 March 2018. 32Case study—Back of House
Glasgow Benefits Centre
Glasgow Benefits Centre
Royal Mail
Police of
Glasgow Caledonian Scotland
Royal Conservatoire of Scotland
The Glasgow University
School of Art
Pavilion Theatre
Glasgow Royal
King's Theatre Concert Hall
Glasgow Royal Infirmary
Glasgow Post Office Buchanan Galleries
Glasgow Queen
Street Station
Glasgow City Chambers University of
Retail and theatre district Strathclyde
Gallery of Modern Art
Glasgow Central Station
High Street Station
Glasgow Police Museum
Argyle Street Station
Legend
Subject Property Amenities Transportation Religious centres Schools
0.5 mile / 0.80 km 1.0 mile / 1.6 km
Overview • Located off Milton Street in the Townhead area of Glasgow
• Large office building formed over three storeys configured in “U” shaped floor plates with two main wings connected at
the western end of the site
• Concrete and steel frame construction with curtain wall glazing windows that are double glazed
• Houses the only Passport Office in Scotland
Connectivity • Situated 0.50 miles north of Glasgow City Centre
• Located in mix of surrounding uses including offices, residential, ground floor retail/leisure and a potential student
accommodation site
Key statistics • Site area: 1.18 ha • Valuation: £30.3m(1)
• NIA: 137,287 sq ft • Rent: £1,940,350 pa; £14.13 psf
• Heritable interest (i.e. Freehold) • Lease terms(2): 10 year lease with no break
Notes:
1. As at 31 December 2020.
2. As of lease renewal on 31 March 2018.
33You can also read