INVESTOR PRESENTATION - May 2019 - Investor Relations
←
→
Page content transcription
If your browser does not render page correctly, please read the page content below
INVESTOR PRESENTATION
May 2019
                        Discovery Village at Naples (Naples, FL)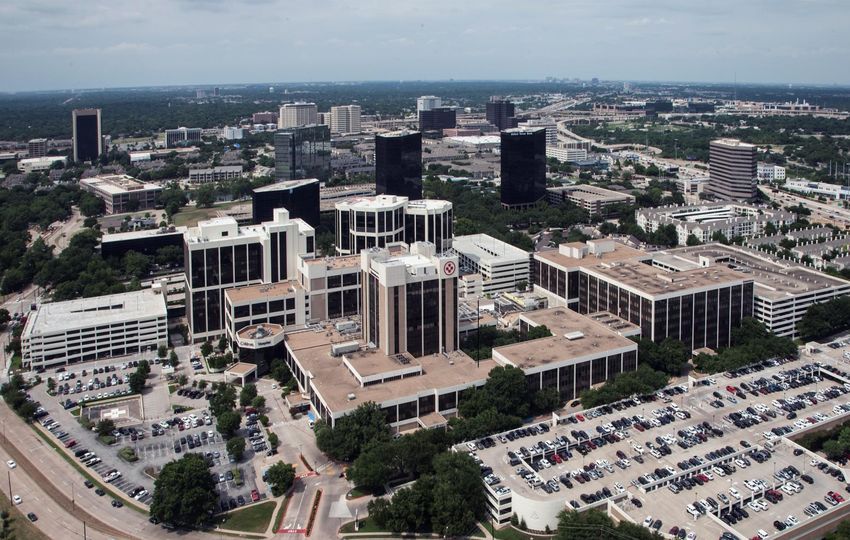
DISCLAIMERS
This presentation is being presented solely for your information, is subject to change and speaks only as of the date hereof. This presentation is not complete and is only a summary of the more detailed information included elsewhere,
including in our Securities and Exchange Commission (“SEC”) filings. No representation or warranty, expressed or implied is made and you should not place undue reliance on the accuracy, fairness or completeness of the information
presented.

FORWARD-LOOKING STATEMENTS

Statements contained in this presentation, as well as statements made by management, that are not historical facts are "forward-looking statements" within the meaning of Section 27A of the Securities Act of 1933, as amended, and
Section 21E of the Securities Exchange Act of 1934, as amended. Forward-looking statements include, among other things, statements regarding our and our officers’ intent, belief or expectation as identified by the use of words such as
“may,” “will,” “project,” “expect,” “believe,” “intend,” “anticipate,” “seek,” “target,” “forecast,” “plan,” “potential,” “estimate,” “could,” “would,” “should” and other comparable and derivative terms or the negatives thereof. Forward-
looking statements reflect our current expectations and views about future events and are subject to risks and uncertainties that could significantly affect our future financial condition and results of operations. While forward-looking
statements reflect our good faith belief and assumptions we believe to be reasonable based upon current information, we can give no assurance that our expectations or forecasts will be attained. Further, we cannot guarantee the
accuracy of any such forward-looking statement contained in this presentation, and such forward-looking statements are subject to known and unknown risks and uncertainties that are difficult to predict. These risks and uncertainties
include, but are not limited to: HCP, Inc.’s (“HCP” or the “Company”) reliance on a concentration of a small number of tenants and operators for a significant percentage of its revenues, the financial condition of the Company’s existing
and future tenants, operators and borrowers, including potential bankruptcies and downturns in their businesses, and their legal and regulatory proceedings, which results in uncertainties regarding the Company’s ability to continue
to realize the full benefit of such tenants’ and operators’ leases and borrowers’ loans; the ability of the Company’s existing and future tenants, operators and borrowers to conduct their respective businesses in a manner sufficient to
maintain or increase their revenues and to generate sufficient income to make rent and loan payments to the Company and the Company’s ability to recover investments made, if applicable, in their operations; competition for the
acquisition and financing of suitable healthcare properties as well as competition for tenants and operators, including with respect to new leases and mortgages and the renewal or rollover of existing leases; the Company’s
concentration in the healthcare property sector, particularly in senior housing, life sciences and medical office buildings, which makes its profitability more vulnerable to a downturn in a specific sector than if the Company were
investing in multiple industries; the Company’s ability to identify replacement tenants and operators and the potential renovation costs and regulatory approvals associated therewith; the risks associated with property development
and redevelopment, including costs above original estimates, project delays and lower occupancy rates and rents than expected; the risks associated with the Company’s investments in joint ventures and unconsolidated entities,
including its lack of sole decision making authority and its reliance on its partners’ financial condition and continued cooperation; the Company’s ability to achieve the benefits of acquisitions or other investments within expected time
frames or at all, or within expected cost projections; the potential impact on the Company and its tenants, operators and borrowers from current and future litigation matters, including the possibility of larger than expected litigation
costs, adverse results and related developments; operational risks associated with third party management contracts, including the additional regulation and liabilities of RIDEA lease structures; the effect on the Company and its
tenants and operators of legislation, executive orders and other legal requirements, including compliance with the Americans with Disabilities Act, fire, safety and health regulations, environmental laws, the Affordable Care Act,
licensure, certification and inspection requirements, and laws addressing entitlement programs and related services, including Medicare and Medicaid, which may result in future reductions in reimbursements or fines for
noncompliance; changes in federal, state or local laws and regulations, including those affecting the healthcare industry that affect the Company’s costs of compliance or increase the costs, or otherwise affect the operations, of its
tenants and operators; the Company’s ability to foreclose on collateral securing its real estate-related loans; volatility or uncertainty in the capital markets, the availability and cost of capital as impacted by interest rates, changes in the
Company’s credit ratings, and the value of its common stock, and other conditions that may adversely impact the Company’s ability to fund its obligations or consummate transactions, or reduce the earnings from potential transactions;
changes in global, national and local economic and other conditions, including currency exchange rates; the Company’s ability to manage its indebtedness level and changes in the terms of such indebtedness; competition for skilled
management and other key personnel; the potential impact of uninsured or underinsured losses; the Company’s reliance on information technology systems and the potential impact of system failures, disruptions or breaches; the
Company’s ability to maintain its qualification as a real estate investment trust; and other risks and uncertainties described from time to time in the Company’s SEC filings. Except as required by law, we do not undertake, and hereby
disclaim, any obligation to update any forward-looking statements, which speak only as of the date on which they are made.

The estimated stabilized cash capitalization rates and yield ranges included in this presentation are calculated by dividing projected cash net operating income (adjusting for the impact of upfront rental concessions) for the applicable
properties by the aggregate purchase price or development cost, as applicable, for such properties. The aggregate cash net operating income projections used in calculating the cash capitalization rates and yield ranges are based on
information currently available to us, including, in certain cases, information made available to us by third parties, and certain assumptions applied by us related to anticipated occupancy, rental rates, property taxes and other
expenses over a specified period of time in the future based on historical data and the Company’s knowledge of and experience with this submarket. Newly acquired operating assets are generally considered stabilized at the earlier of
lease-up (typically when the tenant(s) control(s) the physical use of at least 80% of the space) or 12 months from the acquisition date. Newly completed developments are considered stabilized at the earlier of lease-up or 24 months
from the date the property is placed in service.

The actual cash capitalization rates for these properties may differ materially and adversely from the estimated stabilized cash capitalization rates and yield ranges discussed in this presentation based on numerous factors, including
our difficulties achieving assumed occupancy and/or rental rates, development delays, unanticipated expenses not payable by a tenant, increases in the Company’s financing costs, tenant defaults, the results of our final purchase price
allocation, as well as the risk factors set forth in our Annual Report on Form 10-K for the year ended December 31, 2018 and our subsequent filings with the SEC. As such, we can provide no assurance that the actual cash capitalization
rates for these properties will be consistent with the estimated stabilized cash capitalization rates and yield ranges set forth in this presentation. Moreover, the Sierra Point Towers acquisition remains subject to customary closing
conditions. As such, we cannot assure you that the Sierra Point Towers acquisition will be consummated on time or at all, nor can we assure you that if consummated, the property will perform to our expectations.

MARKET AND INDUSTRY DATA

This presentation also includes market and industry data that HCP has obtained from market research, publicly available information and industry publications. The accuracy and completeness of such information are not guaranteed.
Such data is often based on industry surveys and preparers’ experience in the industry. Similarly, although HCP believes that the surveys and market research that others have performed are reliable, such surveys and market research
is subject to assumptions, estimates and other uncertainties and HCP has not independently verified this information.

NON-GAAP FINANCIAL MEASURES

This presentation contains certain supplemental non-GAAP financial measures. While HCP believes that non-GAAP financial measures are helpful in evaluating its operating performance, the use of non-GAAP financial measures in this
presentation should not be considered in isolation from, or as an alternative for, a measure of financial or operating performance as defined by GAAP. You are cautioned that there are inherent limitations associated with the use of each
of these supplemental non-GAAP financial measures as an analytical tool. Additionally, HCP’s computation of non-GAAP financial measures may not be comparable to those reported by other REITs. You can find reconciliations of the
non‐GAAP financial measures to the most directly comparable GAAP financial measures, to the extent available without unreasonable efforts, at “1Q 2019 Discussion and Reconciliation of Non-GAAP Financial Measures” on the Investor
Relations section of our website at www.hcpi.com

                                                                                                                                                                                                                   HCP, Inc.                    2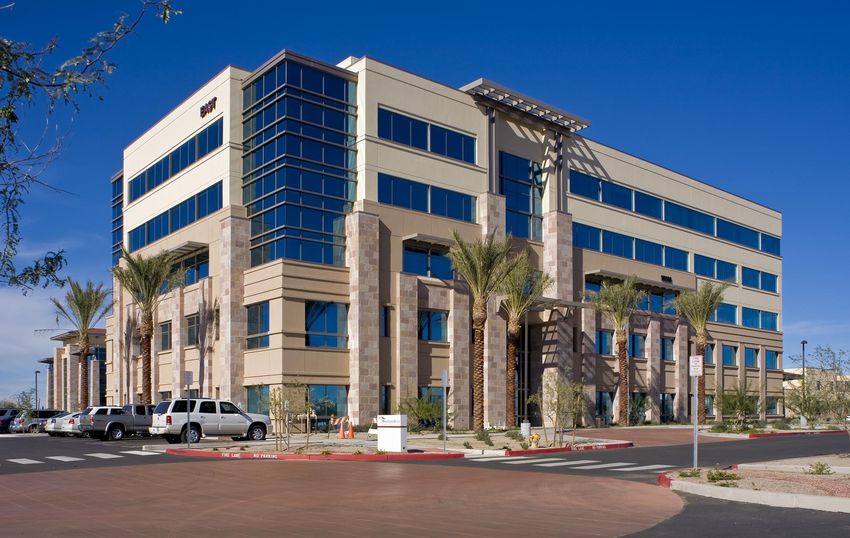
TABLE OF CONTENTS

1.   Introduction to HCP                    4 - 10

2.   Recent Investments                     11 - 15

3.   Development Overview                  16 - 21

4.   Segment Overviews
     A. Life Science                        23- 26
     B. Medical Office                     27 - 32
     C. Senior Housing                     33 - 37

5.   Balance Sheet & Sustainability        38 - 42

                                      HCP, Inc.       3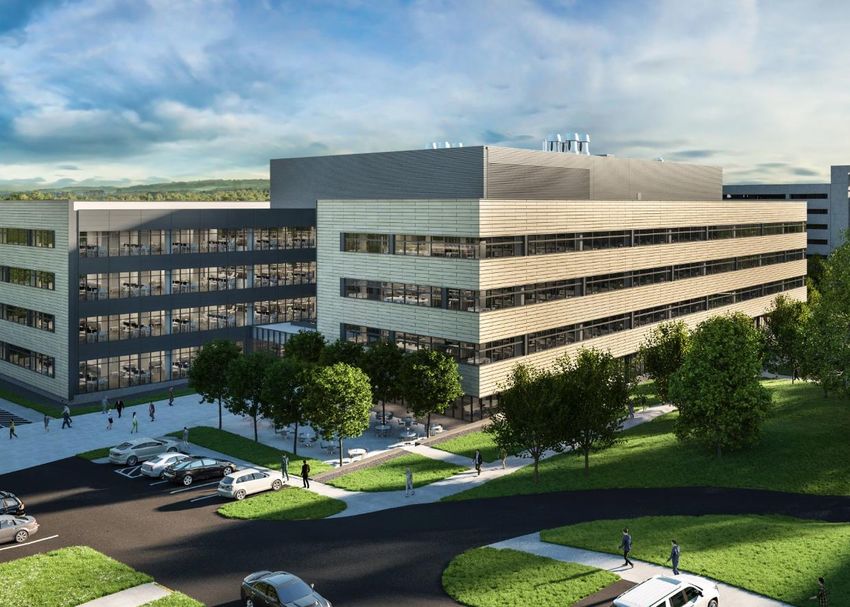
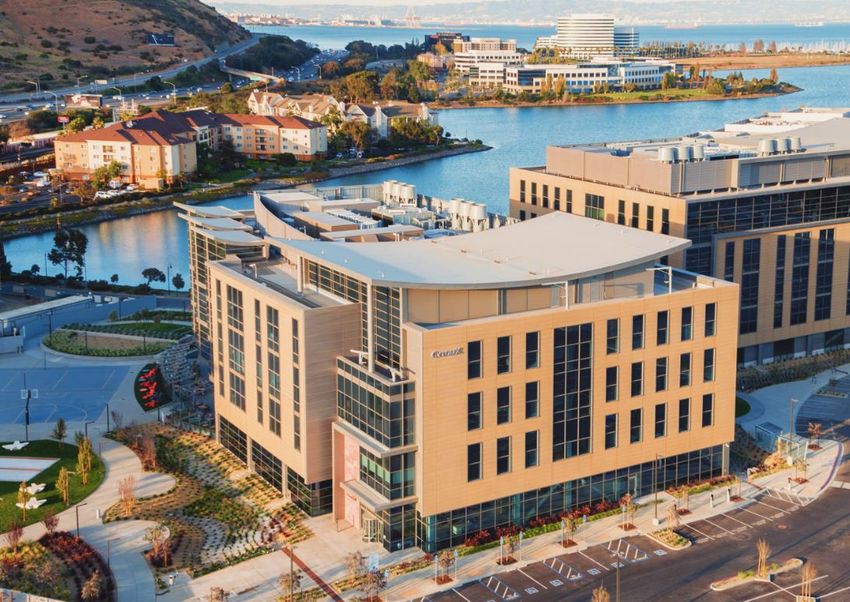
INTRODUCTION TO HCP

HCP, Inc.                The Cove | South San Francisco, CA
INTRODUCTION
HCP at a glance

                              DIVERSIFIED                                                                                                                                                          SCALE

                  BALANCED PORTFOLIO                                                                                                                                                        734 PROPERTIES
             21 Million Sq. Ft. Medical Office                                                                                                                                        $22 Billion in Enterprise Value(1)

                 7 Million Sq. Ft. Life Science                                                                                                                                         $15 Billion in Market Cap(1)

                25,750 Senior Housing Units

                                                                                                               HIGH-QUALITY
                                                                                                                 PRIVATE PAY
                                                                                                                 DIVERSIFIED

                    INVESTMENT GRADE                                                                                                                                                          ESTABLISHED

              STRONG BALANCE SHEET                                                                                                                                             34 YEARS AS A PUBLIC COMPANY
                          S&P: BBB+ (Stable)                                                                                                                                                Member of S&P 500

                      Moody’s: Baa1 (Stable)                                                                                                                                               4.7% Dividend Yield(2)

               Fitch: BBB (Positive Outlook)

___________________________
1. Enterprise value and market capitalization based on HCP’s share price of $31.19 on 05/15/19 and total consolidated debt and HCP’s share of unconsolidated JV debt as of 3/31/19.
2. Based on share price as of 05/15/19.

                                                                                                                                                                                                              HCP, Inc.    5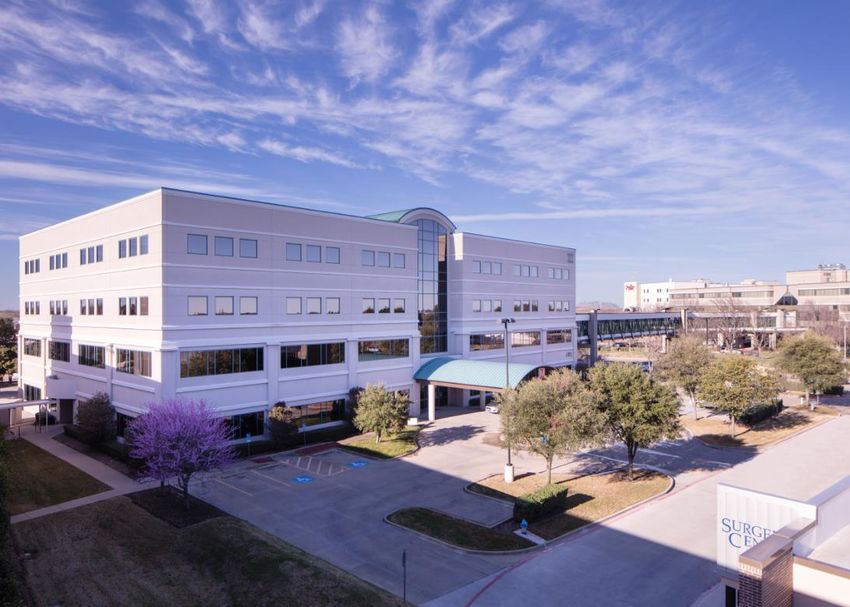
SENIOR LEADERSHIP

                                                         TOM HERZOG President & Chief Executive Officer
                                                         Mr. Herzog is our President and Chief Executive Officer and a
                                                         member of our Board of Directors. Mr. Herzog is responsible for all
                                                         aspects of the Company’s business. Prior to HCP, Mr. Herzog was
                                                         CFO of UDR, Inc. from January 2013 until June 2016. Prior to UDR,
                                                         Mr. Herzog served as both the CFO (2005 to 2009) and CAO (2004 to
                                                         2005) for Apartment Investment and Management Company
                                                         (AIMCO). From 2000 to 2004, Mr. Herzog served as the CAO and
                                                         Global Controller for GE Real Estate. His experience also includes 10
                                                         years at Deloitte & Touche LLP’s audit and real estate group.

        SCOTT BRINKER Chief Investment Officer                                                            PETER SCOTT Chief Financial Officer
        Mr. Brinker is our EVP and Chief Investment Officer. In addition to                               Mr. Scott is our EVP and Chief Financial Officer and is responsible
        leading the Company’s investment activities, Mr. Brinker also                                     for all aspects of the Company’s finance, treasury, tax, risk
        oversees our senior housing platform. Prior to HCP, Mr. Brinker                                   management, and investor relations activities. Mr. Scott also
        most recently served as EVP and Chief Investment Officer at                                       oversees our life science platform and sits on our Investment
        Welltower from July 2014 to January 2017. Prior to that, he served as                             Committee. Prior to joining HCP in 2017, he served as Managing
        Welltower’s EVP of Investments from January 2012 to July 2014.                                    Director in the Real Estate Banking Group of Barclays from 2014 to
        From July 2001 to January 2012, he served in various investment and                               2017. His experience also includes various positions of increasing
        portfolio management related capacities with Welltower.                                           responsibility at the financial services firms Credit Suisse from 2011
                                                                                                          to 2014, Barclays from 2008 to 2011 and Lehman Brothers from
                                                                                                          2002 to 2008.

        TOM KLARITCH Chief Operating Officer &                                                            TROY McHENRY General Counsel & Corporate Secretary
                     Chief Development Officer                                                            Mr. McHenry is our EVP, General Counsel and Corporate Secretary
        Mr. Klaritch is our EVP, Chief Operating Officer and Chief                                        and serves as the Chief Legal Officer. He is responsible for providing
        Development Officer. He oversees the Company’s medical office                                     oversight and a legal perspective for the Company’s real estate and
        platform, working closely with the team to advance competitive                                    financing transactions, litigation, as well as corporate governance
        performance and growth. He also oversees the management of HCP’s                                  and SEC/NYSE compliance. He previously served as SVP – Legal and
        development and redevelopment projects. Prior to his current role,                                HR from July 2013 to February 2016, as well as other legal related
        Mr. Klaritch served as Senior Managing Director – Medical Office                                  capacities since December 2010. Prior to HCP, Mr. McHenry held
        Properties from April 2008 to August 2017. Mr. Klaritch has over 35                               various legal leadership roles with MGM Resorts International, Boyd
        years of operational and financial management experience in the                                   Gaming Corp., and DLA Piper.
        medical office and hospital sectors.

                                                                                                                                                      HCP, Inc.               6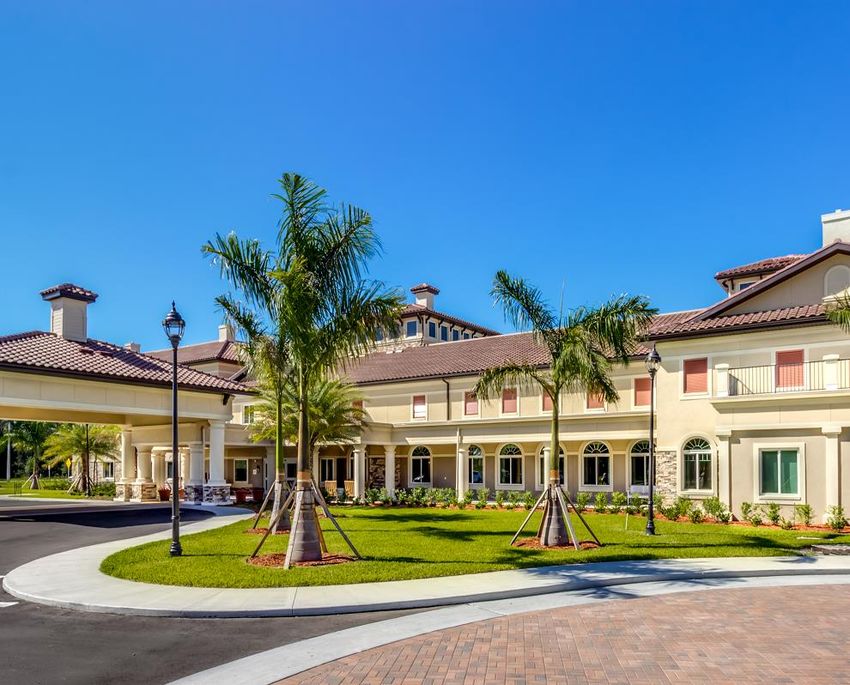
THE OPPORTUNITY
HCP has a significant pipeline for future growth

      U.S. HEALTHCARE REAL ESTATE(1)                                                                                        HCP’s PORTFOLIO INCOME(2) BY SEGMENT

                              Other owners of
                            healthcare real estate
                                                                                                                                                            Senior Housing
                                                                                                                                 Medical Office                  31%
                                                                                                                                    32%

                                          $1.1                                                                                                    $22B
                                                                                       HCP                                                        Enterprise
                                  Trillion                                      Other                                                               Value
                                                                                public                                                                                       Hospital, 5%
                                                                                REITs
                                                                                                                                                                           Other & Unconsolidated
                                                                                                                                             Life Science                         JVs, 3%
                                                                                                                                                 24%
                                                                                                                                                                      CCRC & Other SH JV,
                                                                                                                                                                             6%

___________________________
1. Source: National Investment Center for Seniors Housing & Care (NIC), HCP research.
2. Portfolio income represents cash NOI plus interest income plus our pro rata share of Cash NOI from our unconsolidated JVs.

                                                                                                                                                                             HCP, Inc.         7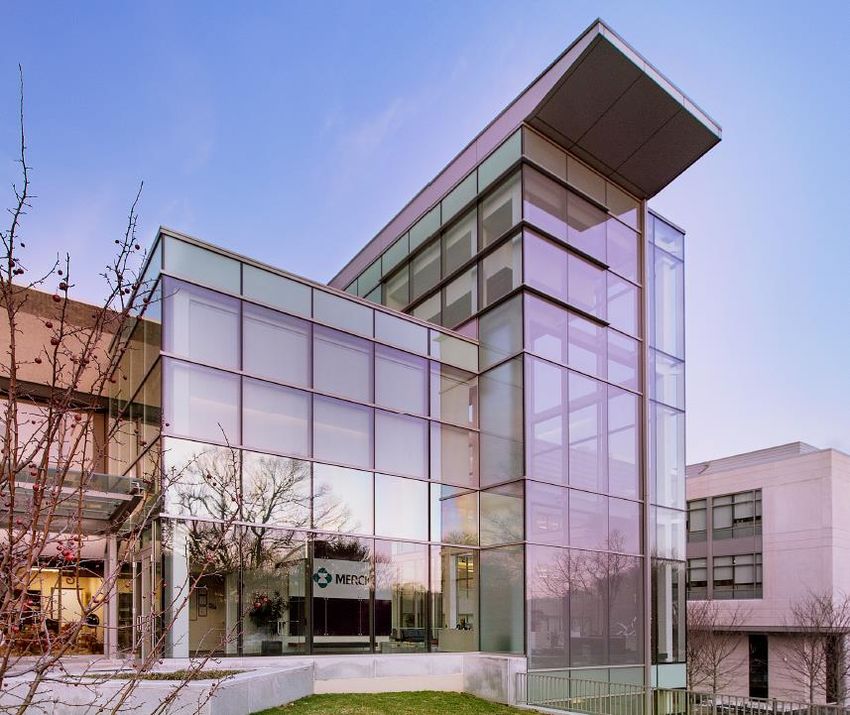
HCP’S PORTFOLIO & STRATEGY OVERVIEW
Strategic growth initiatives across segments
As Baby Boomers Age, They Will Continue to Seek…
Outpatient services and specialist Senior Housing communities
New and innovative drugs,
offering social activities, daily
doctor visits performed more treatments and healthcare
efficiently in a Medical Office living assistance, and
devices, which will be serviced by
building setting coordination with outside
our Life Science portfolios
healthcare providers
Parker Adventist Denver, CO The Cove San Francisco, CA The Solana Preserve Houston, TX
Grow relationships with top Focus on the three major Life Focus on locations with strong 5-
hospitals and health systems Science markets mile / 20-min drive time
demographics and favorable
Pursue on-campus and select off- Assemble clusters of assets
supply outlooks
campus assets with strong hospitals through acquisitions, development
and health systems in relevant and redevelopment Active asset and portfolio
markets Grow existing relationships by management to reduce risks
Redevelop portions of our older, on- providing expansion opportunities Capitalize on select development
campus portfolio to our tenants and redevelopment opportunities
HCP, Inc. 8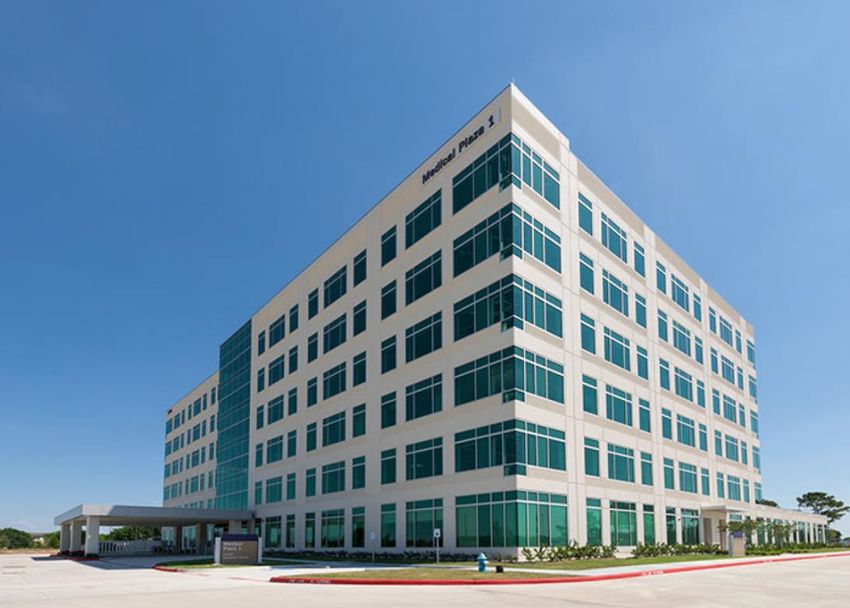
WHAT DIFFERENTIATES HCP
•      High-quality portfolio with a balanced emphasis on Medical Office, Life Science, and Senior Housing real
       estate
•      ~56% of portfolio NOI(1) from on-campus Medical Office portfolio and premier Life Science properties,
       primarily in San Francisco, San Diego and Boston
•      ~37% of portfolio NOI(1) from a diversified senior housing portfolio with a balanced mix of well-covered
       triple-net leases and operating properties
•      Portfolio-wide average lease maturity of 5 years(2) gives HCP the opportunity to mark leases to market in a
       rising rate environment
•      $1.3 billion development pipeline that is over 60% pre-leased and almost $600 million is already funded;
       significant shadow pipeline
•      Investment grade balance sheet with ample liquidity
•      Global leader in sustainability

 Briargate MOB                                                                            Colorado Springs, CO                          The Shore (Rendering)                                                                       San Francisco, CA

___________________________
1. Portfolio NOI represents cash NOI plus interest income plus our pro rata share of Cash NOI from our unconsolidated JVs.
2. Portfolio average lease duration calculated based on annualized base rent for senior housing triple-net, medical office, and life science and annualized Cash NOI for SHOP. SHOP average remaining lease duration assumed at 0.5 years.

                                                                                                                                                                                                                                             HCP, Inc.   9
HCP’S PREMIER REAL ESTATE PORTFOLIO
9 portfolios representing ~$300 million of cash NOI at stabilization

The Cove At Oyster Point       Life Science     Medical City Dallas      Medical Office    Discovery Portfolio              Senior Housing
San Francisco, CA           Stabilized / Dev.   Dallas, TX                   Stabilized    FL, GA, TX                      Recent Acquisition

Hayden Research Campus          Life Science    Greenville Portfolio     Medical Office    Centennial Campus                  Medical Office
Boston, MA                  Value-Add / Dev.    Greenville, SC               Stabilized    Nashville, TN                          Stabilized

Swedish First Hill Campus    Medical Office     Britannia Oyster Point     Life Science    The Shore at Sierra Point            Life Science
Seattle, WA                      Stabilized     San Francisco, CA             Stabilized   San Francisco, CA                    Development

                                                                                                                       B
                                                                                                                       L
                                                                                                                       D
                                                                                                                       G
                                                                                                                       .
                                                                                                                       A

                                                                                                                           HCP, Inc.            10
RECENT INVESTMENTS HCP, Inc. Cypress Medical Office Building | Cypress, TX
GROWING OUR BALANCED PORTFOLIO OF HIGH-QUALITY ASSETS
Recent Transactions Investment Highlights
$445M Discovery portfolio acquisition Recently-built, highly-amenitized
$113M Oakmont portfolio acquisition communities in attractive markets
Senior Housing Top-tier operating partners
Strong relationship with alignment of
interests
Attractive total returns
$98M CambridgePark acquisition and Deepens our footprint in Boston
development opportunity Creating another 1M square foot
Life Science $245M Sierra Point Towers acquisition(1) Class A life science campus in South
$385M The Shore Phases I/II accelerated San Francisco
development Attractive total returns
$70M of total estimated investment Three new MOB’s anchored by HCA
added to development program with Proprietary program sourced through
HCA strong relationship
Medical Office
Significant pre-leasing with HCA (50-
70%)
Attractive stabilized return on cost
___________________________
and total returns
1. Expected to close 2Q 2019.
HCP, Inc. 12ACQUISITIONS WITH BEST-IN-CLASS OPERATORS
High-quality, recently-built communities in high-growth and / or high-barrier markets
Discovery Oakmont
Purchase Price $445M $113M
Cap Rate Low-4% (initial), ~6% (stabilized)(1) Mid-5% range (year one)(1)
Current Occupancy High 70’s Mid 90’s
# of Properties 9 3
Units 1,242 units (IL, AL, MC) 200 units (AL, MC)
Location Florida (7), Georgia (1) and Texas (1) Bay Area, Los Angeles and Sacramento
Avg Portfolio Age 3 years 3 years
HCP to provide up to $40M of junior financing on
In connection with the transaction, HCP assumed
four new Discovery development projects; three
$50M of secured debt and issued $6M of downREIT
are campus expansions of the properties just
units
Other acquired by HCP
HCP converted four existing high-performing
HCP to receive purchase option to acquire each
Oakmont-operated communities from triple-net
project at a 6.25% cap rate on stabilized NOI
leases to RIDEA structures
($300M acquisition potential)
Discovery Village at Palm Beach Gardens Discovery Village At The Forum Mariner Point (Oakmont) Whittier (Oakmont)
Palm Beach Gardens, FL Fort Myers, FL San Francisco, CA Los Angeles, CA
___________________________
1. See “Disclaimers” on page 2 for information on how we calculate estimated cash capitalization rate and stabilization.
HCP, Inc. 13EXPANDING OUR PRESENCE IN TOP LIFE SCIENCE SUBMARKETS
THE SHORE AT SIERRA POINT SIERRA POINT TOWERS CAMBRIDGEPARK DRIVE
• 23-acre site offering state-of-the–art • Two office and life science buildings • 3-acre campus in Cambridge, MA
life science space totaling 427,000 square feet, • 87 CambridgePark Drive - 64,000
• Development site encompassing immediately adjacent to the Shore at square foot life science building, 100%
~591,000 square feet over three Sierra Point leased to two emerging biotech tenants
phases • ~100% leased with more than 5 years Projected cash capitalization rate of
Phase I is 100% leased with est. of average remaining lease term 6%(1) in 2020
stabilized occupancy in Q1 2020 • Projected cash capitalization rate of • 101 CambridgePark Drive – adjacent
Recently commenced construction ~6.0%(1) in 2020 vacant land parcel
on phases II and III with est. • Ability to integrate the two campuses, • Expansion of HCP’s relationship with
stabilized occupancy in 2021/2022 to drive leasing and operational KSP, leading local life science owner
• Capitalizing on leasing momentum and synergies over time and operator
continued market demand by • Significant excess surface parking
accelerating remaining two phases creates long-term densification
• Projected stabilized yields in the range opportunities
of 6.0% to 6.5%(1)
Class A life science campus with over 1 million square feet and a total investment Future densification potential within
of approximately $850 million in this dynamic and growing sub-cluster growing submarket
___________________________
1. See “Disclaimers” on page 2 for information on how we calculate estimated cash capitalization rate, yield and stabilization.
HCP, Inc. 14GROWING OUR HCA MEDICAL OFFICE DEVELOPMENT PROGRAM
Grand Strand Lee’s Summit Brentwood Ogden
• Myrtle Beach, SC • Kansas City, MO • Nashville, TN • Ogden, UT
• 90,000 SF • 52,000 SF • 119,000 SF • 70,000 SF
• $26M estimated total cost • $16M estimated total cost • $36M estimated total cost • $18M estimated total cost
• 47% pre-leased • 50% pre-leased • 49% pre-leased • 66% pre-leased
Partnering with HCA, the world’s leading for-profit hospital, to build
medical office buildings at stabilized yields in the 7.0%-7.5% range(1)
___________________________
1. See “Disclaimers” on page 2 for information on how we calculate estimated cash capitalization rate, yield and stabilization.
HCP, Inc. 15DEVELOPMENT OVERVIEW HCP, Inc. 75 Hayden (Rendering)| Boston, MA
ACTIVE DEVELOPMENT PIPELINE(1)
                                                                            Total               Cost to           Remaining              Leasable            Percent Est. Date of Est. Stab. Yield                                Est. Stab. Cash
     Project                                    Market                                              (2)                                                                                                            (3)                             (4)
                                                                        Costs ($M) Date                  ($M) Costs ($M) Area (000s) Leased                                   Stab. Occ.                 Range                     NOI ($M)
     The Cove Phase III                         San Francisco                $253                 $216                  $37                  324 SF            100%             Q3 2019             9.2% - 9.7%                           $24
     Ridgeview                                  San Diego                      73                  69                     4                  306 SF            100%             Q4 2019             6.5% - 7.0%                             5
     Sorrento Summit                            San Diego                      19                    8                    11                   28 SF           100%             Q4 2019             7.7% - 8.2%                             1
     The Cove Phase IV                          San Francisco                  111                 48                    64                  164 SF            100%             Q1 2020             9.8% - 10.3%                            11
                              (5)
     The Shore Ph. I                            San Francisco                 237                  128                  109                  222 SF            100%             Q1 2020             6.0% - 6.5%                            15
                                                                                                                                                                                                                            (6)
     Grand Strand                               Myrtle Beach                   26                    7                   19                   90 SF             47%             Q3 2021             7.0% - 7.5%                             2
                               (5)
     The Shore Ph. II                           San Francisco                 292                   43                  249                  266 SF                -            Q4 2021             5.7% - 6.2%                            17
                                (5)
     The Shore Ph. III                          San Francisco                  94                   15                   78                  103 SF                -            Q4 2022             7.1% - 7.6%                             7
     75 Hayden                                  Boston                        160                   50                   110                 214 SF                -            Q4 2022             7.4% - 7.9%                            12
                                                                                                                                                                                                                            (6)
     Lee's Summit                               Kansas City                    16                    -                   16                    52 SF            50%                  --             7.0% - 7.5%                             1
     Brentwood                                  Nashville                      36                    -                   36                   119 SF           49%                   --             7.0% - 7.5% (6)                         3
                                                                                                                                                                                                                            (6)
     Ogden                                      Ogden                          18                    -                   18                    70 SF           66%                   --             7.0% - 7.5%                             1
                                               (7)
     Total/Weighted Average                                                 $1,334                $584                 $750               1,958 SF             62%                                  7.0% - 8.0%                          $100

PROJECT RENDERINGS

  Sorrento Summit                                               San Diego                  The Shore                                               San Francisco                    75 Hayden                                                            Boston
___________________________
1. Excludes unconsolidated joint venture developments. Total Costs, Remaining Costs, Estimated Date of Stabilized Occupancy, Estimated Stabilized Yield Range and Estimated Stabilized Cash NOI are based on management’s estimates and are forward-looking.
2. Cost to date represents construction in process balance of 3/31/19.
3. See “Disclaimers” on page 2 for information on how we calculate estimated stabilized yield.
4. Represents projected stabilized cash NOI following lease-up and expiration of any free rents; economic stabilization typically occurs three to six months following stabilized occupancy. Cash NOIs presented in the table may not sum due to rounding.
5. Development costs and returns inclusive of legacy pre-development site work and capitalized interest which resulted in a higher land basis; yield assuming a market value of land would be approximately 100 basis points higher. Additionally, Phase I includes costs
   associated with construction of campus-wide amenity space while Phase II includes costs associated with a parking structure.
6. Represents the estimated blended stabilized yield range across all development projects with HCA.
7. Represents total for: Total Costs, Cost to Date, Remaining Costs, Leasable Area and Stabilized Cash NOI. Percent Leased is weighted by leasable area. Estimated Stabilized Yield Range is weighted by Total Costs.

                                                                                                                                                                                                                                            HCP, Inc.                       17
SIGNIFICANT EARN-IN OPPORTUNITY FROM ACTIVE PIPELINE(1)
Development deliveries will compliment our organic earnings growth(2)
EXPECTED INCREMENTAL CASH NOI BY YEAR FROM ACTIVE DEVELOPMENT PIPELINE(3)
$ in millions
$75
$22
$50 $38
$25
$13
$0
2019 2020 2021
Development pipeline is expected to generate significant incremental cash NOI
___________________________
1. Analysis based on cash NOI contribution and does not make a cost of capital adjustment relative to development spend.
2. FFO earn-in will include incremental development NOI partially offset by a reduction in capitalized interest.
3. Excludes unconsolidated joint venture developments.
HCP, Inc. 18VALUE CREATION FROM DEVELOPMENT
✔ Pipeline Expected to Drive ✔ In-Place Dev Yield Expected to Generate a ✔ Projects Totaling $695M are
~$500-700M of Value Creation ~250bps Spread Over Market Cap Rates 100% Pre-Leased
ACTIVE DEVELOPMENT PIPELINE(1) ILLUSTRATIVE NAV CREATION FROM ACTIVE DEVELOPMENTS
Costs Percent Est. Stab. Yield Market Cap $ in millions
Project (2) (3)
($M) Leased Range Rate Range
Cove Phase III $253 100% 9.2% - 9.7%
Ridgeview 73 100% 6.5% - 7.0% ~$500-$700 $1,800-$2,000
Sorrento Summit 19 100% 7.7% - 8.2%
Cove Phase IV 111 100% 9.8% - 10.3% ~$1.00-$1.50/sh
(4) $1,300 Value Creation
Sierra Point I 237 100% 6.0% - 6.5%
(5)
Grand Strand 26 47% 7.0% - 7.5%
(4)
Sierra Point II 292 - 5.7% - 6.2%
(4)
Sierra Point III 94 - 7.1% - 7.6%
75 Hayden 160 - 7.4% - 7.9%
(5)
Lee's Summit 16 50% 7.0% - 7.5%
(5)
Brentwood 36 49% 7.0% - 7.5%
Ogden
(5)
18 66% 7.0% - 7.5% Land and Value Creation(6)(7) Stabilized Value(7)
Development Costs
Active Projects $1,334 62% 7.0% - 8.0% 4.5% - 5.5%
In-process developments are a source of future NAV growth
___________________________
1. Excludes unconsolidated joint venture developments.
2. See “Disclaimers” on page 2 for information on how we calculate estimated stabilized yield.
3. Represent estimated range of fair market cap rates at stabilization.
4. Development costs and returns inclusive of legacy pre-development site work and capitalized interest which resulted in a higher land basis; yield assuming a market value of land would be approximately 100 basis points higher. Additionally, Phase I includes costs
associated with construction of campus-wide amenity space while Phase II includes costs associated with a parking structure.
5. Represents the estimated blended stabilized yield range across all development projects with HCA.
6. Value creation defined as the undiscounted stabilized cash NOI divided by current market cap rate less cost of development.
7. Assumes developments generate an approximate 7% to 8% cash yield and the resulting cash NOI is valued at the mid-point of the fair market cap rate of 5.0%.
HCP, Inc. 19LIFE SCIENCE LAND BANK AND ENTITLEMENTS
Land bank is comprised of sites located in the life science
markets of San Francisco, San Diego and Cambridge
Plan to strategically activate land bank over time as leasing
progress and market conditions warrant
KEY FUTURE LIFE SCIENCE DEVELOPMENT OPPORTUNITIES
Est. Rentable Book Value
Project Market
Sq. Ft. (in 000s) ($M)
Forbes Research Center San Francisco 326 $48
Modular Labs III San Francisco 106 11
Torrey Pines Science Center San Diego 93 12
Directors Place San Diego 150 7
101 CambridgePark Drive Cambridge N/A 27
Forbes Research Center (Rendering) San Francisco
Land bank represents a shadow development pipeline in excess of $700 million
HCP, Inc. 20ACTIVE REDEVELOPMENT
• Our portfolio has approximately $50 to $100 million per year of embedded redevelopment potential over the
next few years
• Cash-on-cash returns average 9% to 12% for these lower-risk redevelopment opportunities
BEFORE AFTER
LIFE SCIENCE
Wateridge
San Diego, CA
$16M project cost
MOB
Yorktown 50
Fairfax, VA
$7M project cost
SENIOR HOUSING
Atria Woodbridge
Irvine, CA
$10M project cost
HCP, Inc. 21SEGMENT OVERVIEWS HCP, Inc. Plano MOB III | Plano, TX
LIFE SCIENCE

HCP, Inc.      Hayden Research Campus | Boston, MA
LIFE SCIENCE
Demographic trends driving health care needs
     The combination of people living longer with an associated increase in chronic conditions and escalating
                         healthcare costs is driving growth in the life science industry

  U.S. AVERAGE LIFE EXPECTANCY                                                                                                       CHRONIC DISEASE MORTALITY

    (Years)

       80                                                                                                                       79

                                                                                                                                72                ~50% of
                70
       70                                                                                                                                        U.S. adults
                                                                                                                                                  live with
                                                                                                                                                   chronic
                                                                                                                                                 conditions
       60

                53

       50
                                                                                                                                          Chronic Disease Mortality
                                                                                                                                          Other Causes

                                U.S. Life Expectancy                                                Worldwide Life Expectancy

___________________________
Source: World Bank, Centers for Medicare & Medicaid Services, Rand Corporation and World Health Organization.

                                                                                                                                                               HCP, Inc.   24
LIFE SCIENCE CONTINUES TO ATTRACT INVESTORS
U.S. VENTURE CAPITAL INVESTMENT
($ in billions) 2018 investments of
approximately $20B
set a record high
$5.0
More than double
10-year historical
average
$2.5 +70% of all dollars
deployed to CA & MA
1Q 2019 investment
levels in-line with
$0.0
2017, the previous
10 YR Q1 2017 Q2 2017 Q3 2017 Q4 2017 Q1 2018 Q2 2018 Q3 2018 Q4 2018 record year
Qrtly. Avg.
U.S. BIOTECHNOLOGY IPO VOLUMES
($ in billions)
$7 More companies are
$7.5
successfully listing
publicly
$5.0 $7B of volume in 2018
$1.7 Billion
2006 – 2018 Average Period marks the
$2.5 most dollars raised
since 2000
$0.0 $1.5B raised YTD 2019
'06 '07 '08 '09 '10 '11 '12 '13 '14 '15 '16 '17 '18 across 14 IPOs despite
Jan gov’t shutdown
60 IPOs ~$100M $604M
Full-Year 2018 Average Raise Single Largest Raise
___________________________
Sources: Company fillings and press releases, PWC MoneyTree, Bloomberg and SNL Capital IQ.
Note: U.S. Venture Capital Investment includes investments in Biotechnology, Drug Delivery, Drug Development, Drug Discovery, Drug Manufacturing, Medical Devices & Equipment, Pharmaceuticals / Drugs and Disease Diagnosis.
HCP, Inc. 25LIFE SCIENCE
Class A real estate in premier life science epicenters
81%
112 / 94% 7M 97% $280M
On-Campus / Affiliated
Properties Square Feet Occupancy CASH NOI(1)
San Francisco San Diego Boston
3.8M 2.1M 462K
Total Square Feet Total Square Feet Total Square Feet
Irreplaceable real estate
Preeminent Life Science real estate Focused, value-add market
strategically positioned in leading
owner in South San Francisco with positioning with a pathway for
biotechnology hotbed with more
nearly 30% share growth
than 15% market share
Britannia Oyster Point South San Francisco, CA Sorrento Gateway Sorrento Mesa, CA 87 CambridgePark Dr. Cambridge, MA
___________________________
Note: Figures as of 1Q 2019 unless otherwise noted.
1. Represents annualized 1Q 2019 cash NOI.
HCP, Inc. 26MEDICAL OFFICE HCP, Inc. East Mesa | Phoenix, AZ
MEDICAL OFFICE
Point of care evolution driven by aging patients

Demand for outpatient care has outpaced inpatient services since 2015, as an older patient population that requires
     more consistent care has recognized the advantages of shorter duration, lower price-point office visits

                    AGE 65+ POPULATION                                    COST EFFECTIVE CARE             ANNUAL MEDICAL VISITS

      (in Millions)                                                % of Net Patient Revenue

                                                                                                                                    6.6
      70                                                           54%            Patients are choosing                            Visits
              19%
               40%increase byby
                    increase  2030
                                2030                                               outpatient services
                                                                   52%
      65      8% increase by 2025
                                                                                                                        3.7
                                                                   50%                                                 Visits
                                                                                                            2.7
                                                                                                           Visits
      60                                                           48%

                                                                   46%
      55
                                                                   44%
                                                                          2012 2013 2014 2015 2016 2017    65
      50
                                                                               Outpatient Revenue
                     2018                  2025             2030                                                    Age Group
                                                                               Inpatient Revenue

___________________________
Source: National Ambulatory Medical Care Survey, Revista.

                                                                                                                                HCP, Inc.   28
INDUSTRY-LEADING ON-CAMPUS MEDICAL OFFICE PORTFOLIO
Top ten markets represent 67% of segment cash NOI
21M 80%+ 83% / 95% 92%+
Specialty Focused
square feet On-Campus / Affiliated Consistent Occupancy
Physicians(1)
Seattle
Salt Philadelphia
Lake
City
Denver
Louisville
Nashville
Greenville
Phoenix
Dallas
Houston
HCP Top 10 Markets
Additional Locations
___________________________
1. Represents percentage of physician tenants classified as non-primary care.
HCP, Inc. 29MEDICAL OFFICE
Strong relationships drive steady performance
HISTORICAL SAME-PROPERTY OCCUPANCY KEY RELATIONSHIPS
Occupancy %
95%
90%
85% Largest for-profit hospital
91% 92% 93% 91% 91% 92% 92% 92% operator in the U.S.
80% 40% of HCP’s medical office
square footage affiliated
with HCA
75%
2011 2012 2013 2014 2015 2016 2017 2018
HISTORICAL SAME-PROPERTY CASH NOI GROWTH
% Growth
4%
3%
Largest non-profit health
system in southeast Texas
2%
A1 investment-grade credit
2.8% 3.0% 3.0% rating
2.7%
1% 2.3% 2.0% 2.1% 2.1%
9% of HCP’s medical office
square footage affiliated
with Memorial Hermann
0%
2011 2012 2013 2014 2015 2016 2017 2018
HCP, Inc. 30MEDICAL OFFICE TENANT MIX
Focus on specialty physicians differentiates our portfolio
• Our disproportionately high percentage of specialty physicians reflects our on-campus focus and insulates our portfolio from
evolving lower acuity healthcare delivery locations such as neighborhood urgent care centers and telemedicine
PORTFOLIO TENANCY(1) PHYSICIAN SPECIALTY
U.S. Patient
Physicians 46%
HCP Care
Physicians(3)
Ancillary Medical Services(2) 31%
Other Support Services 23% Specialties 81% 67%
Primary Care 19% 33%
Types of Specialties:
Obstetrics / Gynecology 9% 5%
Leased Directly to
Hospital 48% Ambulatory Surgery Center 8% N/A
General / Specialty Surgery 8% 7%
Imaging / Radiology 8% 3%
Non-Hospital
Leased 52% Orthopedics 8% 4%
Cardiovascular 7% 4%
Oncology 3% 3%
Neurology 3% 2%
Gastroenterology 3% 2%
Physicians 68%
Other 24% 37%
Ancillary Medical Services 17%
Total Specialists 81% 67%
Other Support Services 15%
___________________________
1. Excludes some master leased properties due to data accessibility. Also excludes the Greenville Health System portfolio acquired subsequent to Q2-2018.
2. Non-hospital ancillary medical includes services such as labs, imaging, dialysis and physical therapy, among others.
3. U.S. physicians breakdown from AAMC, 2016 Physician Specialty Data Book.
HCP, Inc. 31MEDICAL CITY DALLAS
Fully-integrated, highly-specialized, two million square foot campus anchored by HCA
5 2.1M 96% $38M
Properties Square Feet Occupancy 2019 Cash NOI
Building A
A
Building B
B
D
C
$194 $202 $210
$183 $186 $189
$170 $179
Building C
C
B
A
Building D
D
HCP, Inc. 32SENIOR HOUSING HCP, Inc. Residence at Watertown | Watertown, MA
SENIOR HOUSING
Long-term fundamentals position segment for success over time

     Increased product awareness, declining caregiver ratios, and acceptance combined with increasing longevity
                               will drive a dramatic increase in demand over time.

                                                                                                                                                                                         STEADILY INCREASING
                 AGE 80+ POPULATION                                                              DECLINING CAREGIVER RATIOS
                                                                                                                                                                                         PENETRATION RATES(1)

   (in Millions)                                                                               Ratio of 45-64 to 65+                                                           % Penetration

                                                                                                 16

                                                                                                 15
    20          56% increase by 2030                                                                                                                                           13%
                                                                                                 14
    18
                                                                                                 13
                                                                                                                                                                               12%
    16          23% increase by 2025
                                                                                                 12

    14                                                                                            11
                                                                                                                               A 18% decline                                   11%

     12                                                                                          10                          from ’18E to ’27E
                                                                                                                                                    Forecast                                   Actual   Forecast
    10                                                                                             9
                                                                                                                                                                               10%
                Current                 2025E                 2030E
                                                                                                  8
                                                                                                                              2014
                                                                                                        2008

                                                                                                                                     2016
                                                                                                               2010
                                                                                                                      2012

                                                                                                                                            2018
                                                                                                                                                   2020
                                                                                                                                                          2022
                                                                                                                                                                 2024
                                                                                                                                                                        2026

___________________________
Source: US Census, American Community Survey (ACS), NIC.
1. Penetration rate from 2009-2017 is based on NIC data. Projected penetration rates based on Green Street Advisors estimates.

                                                                                                                                                                                                        HCP, Inc.   34
DIVERSIFIED SENIOR HOUSING PORTFOLIO(1)
79% of NOI from East Coast, West Coast, Texas and Denver
228 25,750 91%
Properties Units NOI from NIC-99
Denver 6%
West Coast
17%
East Coast
41%
Texas
14%
Balanced mix of triple-net and operating communities
___________________________
1. Metrics and geographic exposure are as of 1Q 2019 cash NOI. Excludes unconsolidated joint ventures and CCRC portfolio.
HCP, Inc. 35SENIOR HOUSING PORTFOLIO MIX
Well-balanced combination of strong operators & locations
HCP’S CASH NOI(1) BY OPERATOR TOP 10 MARKETS
(1)
Cash NOI by Market
Markets
Other Total NNN SHOP
16%
Washington DC 9% 11% 6%
Houston 7% 1% 21%
Aegis
Brookdale New York 7% 9% 4%
5%
36%
Denver 5% 4% 8%
HRA
6% Chicago 5% 4% 7%
Dallas 4% 3% 6%
Atria Los Angeles 4% 4% 2%
10%
San Francisco 3% 5% 0%
Portland 3% 4% 0%
Sunrise Austin 3% 3% 3%
27%
Top 10 Markets(2) 50% 47% 56%
Balanced mix of operators with diverse exposure to high barrier to entry and high growth markets
___________________________
1. Cash NOI by market is based on 1Q 2019 Cash NOI as of 3/31/19. Excludes unconsolidated joint ventures and CCRC portfolio.
2. Total Top-10 market percentages may not add due to rounding.
HCP, Inc. 36CONTINUING CARE RETIREMENT COMMUNITY (CCRC) JV
PORTFOLIO OVERVIEW
15 Community JV with Brookdale representing ~5% of Portfolio
Income
CCRC’s are a lifestyle choice where residents move in at a
younger age and have much longer lengths of stay than rental
AL/IL
Sizable upfront construction costs and large site requirements
create meaningful barriers to entry; far less new CCRC supply
compared to rental AL/IL
Freedom Pointe The Villages, FL
STABLE OCCUPANCY & FINANCIAL PERFORMANCE OVER TIME
Quarterly Occupancy Rolling-4Qtr Avg. Cash NOI $M(1)
90% $20
80% $10
70% $0
1Q16 3Q16 1Q17 3Q17 1Q18 3Q18 1Q19 Freedom Plaza Tampa, FL
___________________________
1. HCP’s share of cash NOI, including non-refundable entrance fees.
HCP, Inc. 37BALANCE SHEET & SUSTAINABILITY HCP, Inc. Centerpoint | Kansas City, MO
IMPROVED CREDIT PROFILE
Strong, investment grade balance sheet with ample liquidity
STRONG FINANCIAL POSITION CAPITAL STRUCTURE HIGHLIGHTS
• Investment grade balance sheet Metric 1Q 2019
• Primarily fixed rate, unsecured borrowings Net Debt-to-Annualized Adjusted EBITDAre 5.5x
• Low overall average cost of debt Secured Debt Ratio 3%
• Minimal near-term maturities Financial Leverage 37%
Adjusted Fixed Charge Coverage 4.5x
• As of March 31, 2019, we had $1.7 billion
remaining available under our credit facility
• Additional ~$585 million available from our
December forward equity follow-on offering
and year to date ATM forward equity
proceeds to fund 2019 acquisitions and
development
• High-quality, ~97% private-pay portfolio
• Diversified tenant base with top three tenants
representing 31% of total portfolio income
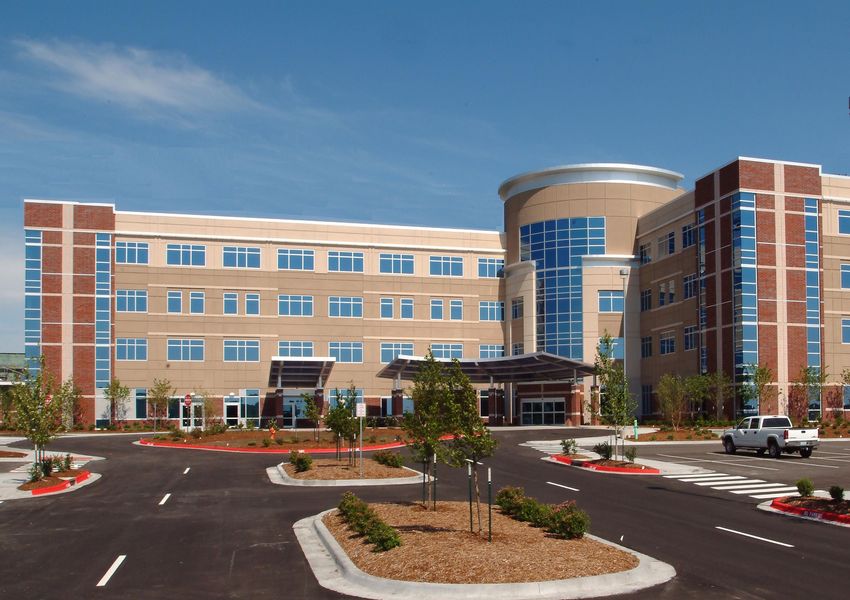
HCP, Inc. 39DEBT MATURITY SCHEDULE(1)
No material maturities in 2019
Well-laddered maturity profile provides flexibility
$1,500
$1,372
$1,200 $1,154
$938
($ in millions)
$900 $816 $807
$600
$392
$351
$300
$163
$10 $38
$4
$-
2019 2020 2021 2022 2023 2024 2025 2026 2027 2028 Thereafter
Senior Unsecured Notes Secured Debt (incl/pro rata JV) Revolver
___________________________
1. Balances exclude life care bonds ($56M) and the MLR note ($33M) that have no scheduled maturities, and HCP’s share of unconsolidated entrance fee deposits from CCRC JV ($171M).
HCP, Inc. 40COMMITMENT TO SUSTAINABILITY
• On the sustainability front, HCP has proven itself an industry leader and continues to build on progress made
since committing to focus on environmental, social and governance initiatives over a decade ago
DJSI North America Index for 6 consecutive years FTSE4Good Index Member
Sustainability Yearbook for 4 consecutive years for 7 consecutive years
Named to the 100 Best Corporate Leadership Band for 6 consecutive years GRESB Green Star rating for 7 consecutive years
Citizens list for the first time in Overall score of A- in 2018 Global Healthcare Sector Leader 3 times
2019
NAREIT Leader in the Light 8 times 2017 ENERGY STAR Partner of the Year
Healthcare Award 4 times
HCP, Inc. 41INSTITUTIONAL SHAREHOLDER SERVICES (ISS) QUALITYSCORES
Environmental, Social and Governance (ESG) Pillars
HCP is a leader with respect to ESG matters, as reflected in ISS’s QualityScores
QualityScores are used by investors to determine a company’s risk profile on various ESG topics on a scale
of “1” to “10”, with a score of “1” representing the lowest risk
Environmental Social Governance
Top 10% of companies ranked Top 20% of companies ranked Top 20% of companies ranked
(Ranks above all MD peers – avg. 6)
1 2 2
Low Risk High Risk Low Risk High Risk Low Risk High Risk
HCP, Inc. 42You can also read