INVESTOR PRESENTATION - May 2021 - TKH Group
←
→
Page content transcription
If your browser does not render page correctly, please read the page content below
INVESTOR PRESENTATION

May 2021
CONTENT

1   Profile

2   Reasons to invest in TKH

3   Strategic highlights

4   Business update & highlights 2020

5   Financial performance 2020

6   Outlook 2021 & Highlights Q1 2021

                                        2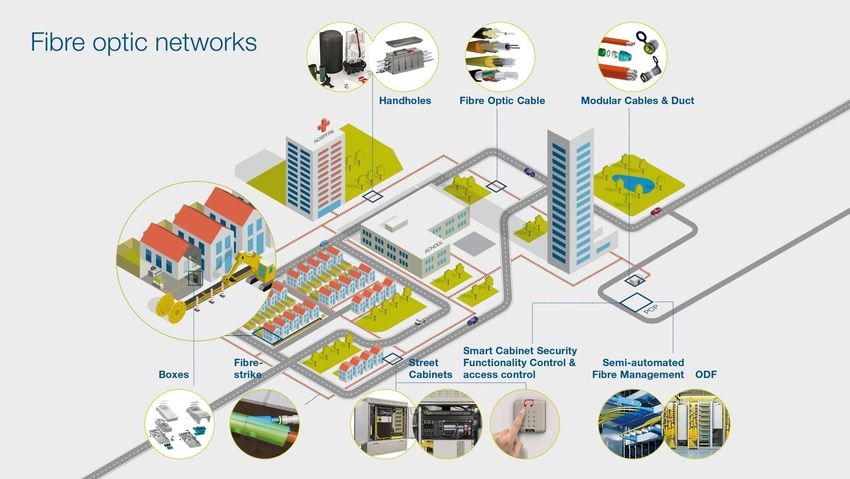
1   Profile

              3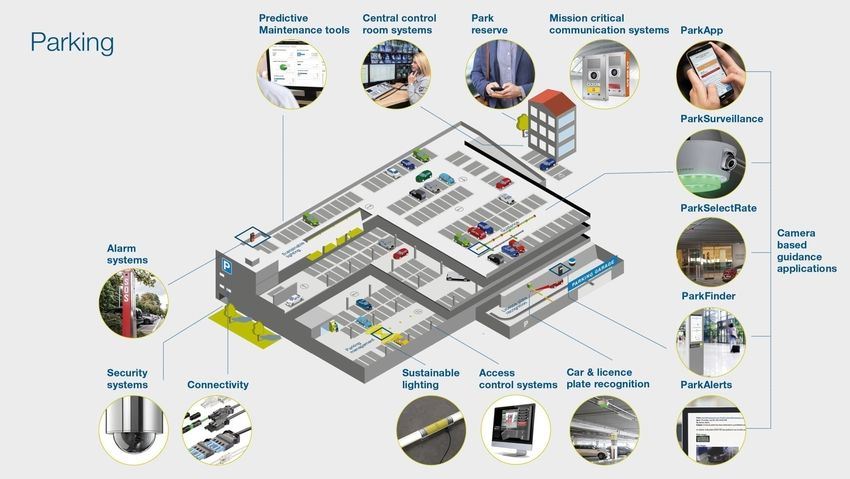
PROFILE
Technology firm TKH Group NV (TKH) is focused on high-end innovative technologies in high growth markets within
three business segments: Telecom, Building and Industrial Solutions.

Through a combination of technologies, TKH offers superior solutions that support to increase the efficiency, safety,
security and sustainability of its customers. The technologies are offered together with software to create smart
technologies and one-stop-shop solutions with plug-and-play integrated technologies.

TKH operates on a global scale. Its growth is concentrated in Europe, North America and Asia. Employing 5,583
people, TKH achieved a turnover of € 1.3 billion in 2020.

          TELECOM                                    BUILDING                                 INDUSTRIAL

                                                                                                                        4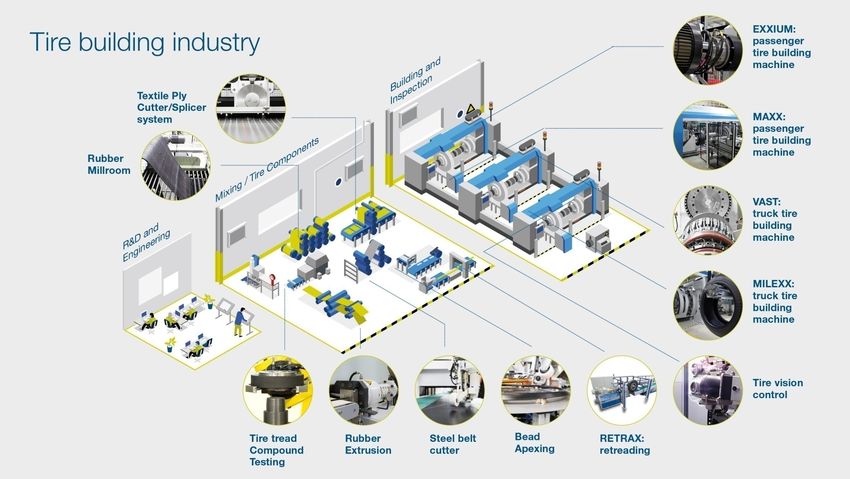
PROFILE
2020
 Turnover            FTE         TELECOM SOLUTIONS
                                 Indoor telecom & copper networks
                                                                    mln €   183   ROS 12.6%
  1.3              5,583         Fibre network systems

  € billion       employees

                                 BUILDING SOLUTIONS
 Net debt       Innovations      Connectivity systems               mln €   672   ROS 11.5%
                                 Vision & security systems
  1.6             21.1%
   ratio           of turnover
                                 INDUSTRIAL SOLUTIONS
                                 Smart manufacturing systems        mln €   434   ROS 10.9%
           Stocklisted
 Euronext Amsterdam (TWEKA)

                                                                                              5
TKH WORLDWIDE

                6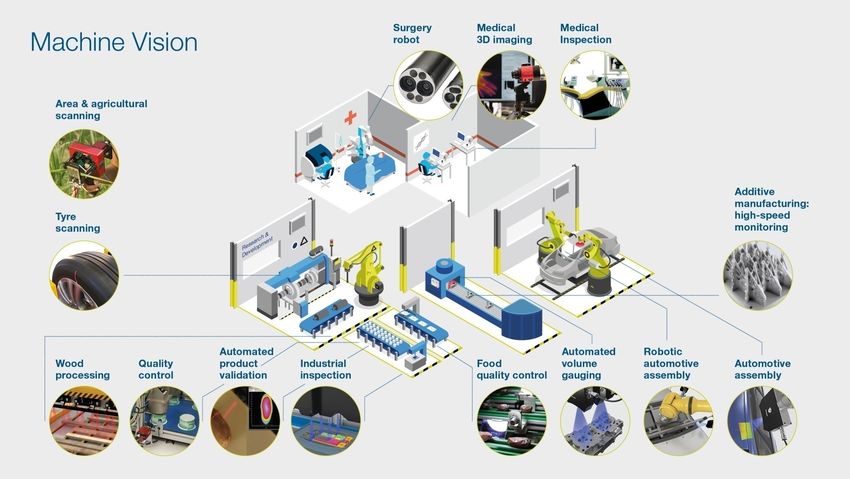
2   Reasons to invest in TKH

                               7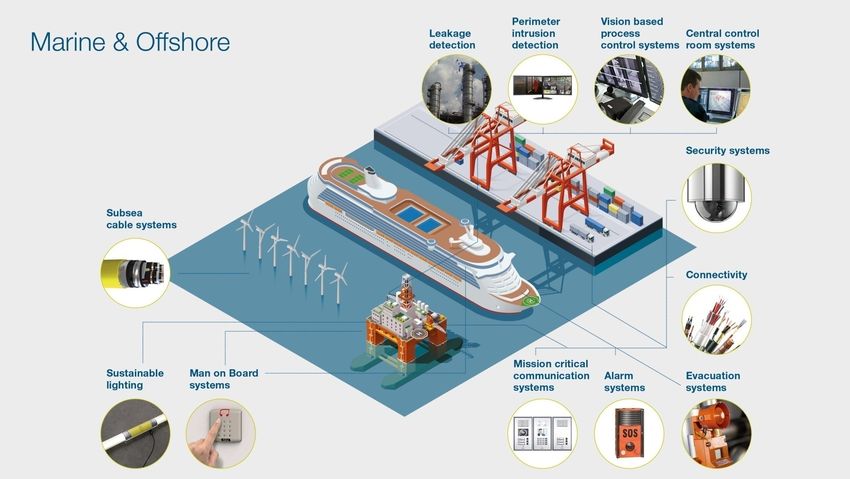
REASONS TO INVEST IN TKH

 Proven value creation with excellent positioning for future value           Strong focus on innovation with a high share of innovations in turnover
 creation in almost all segments in which TKH operates.                      with an efficient way in which investments in R&D are converted into
                                                                             successful market positioning of the developed technologies.
 Disruptive technologies that create market share growth in addition to
 the attractive growth potential of the market segments in which TKH         Unique positioning with a focus on total solutions consisting of several
 operates.                                                                   related technologies that respond to the wishes of customers to be
                                                                             relieved.
 Medium-term growth based on the 7 selected attractive growth
 verticals in the next 3-7 years amounts to € 600 million to € 900           About 70% of our turnover is related to ‘Sustainable Development
 million.                                                                    Goals’.

 Driven management that is able to take on challenges and has                High barriers to entry of competitors due to patented technologies,
 ambition for value creation with a realistic approach.                      system solutions, service and logistics services.

 Potential for a significant increase of the ROS and ROCE based on           Proven experience in bringing new business to maturity by being able
 strategic starting position with high added value of the activities and     to market new disruptive technologies on the basis of the built-up
 limited investments coupled with large defined revenue growth               reputation and strong organizational technical and commercial
 potential.                                                                  organization in the segments in which TKH operates.

 Limited capital intensity of the activities with sound capital allocation   Good incentive system to reward long-term value creation, with which
 decisions, in conjunction with high return on sales, leads to very high     the right talents can be attracted to organize an exceptional
 ROCE.                                                                       performance.

 The ROS and ROCE target of a minimum of 15% and 22-25%                      Risk profile in relation to value creation potential is low.
 respectively in conjunction with the high organic growth potential has
 the potential to reach an adjustment of the valuation multiple based on
 benchmark analysis.
                                                                                                                                                        8
3   Strategic highlights

                           9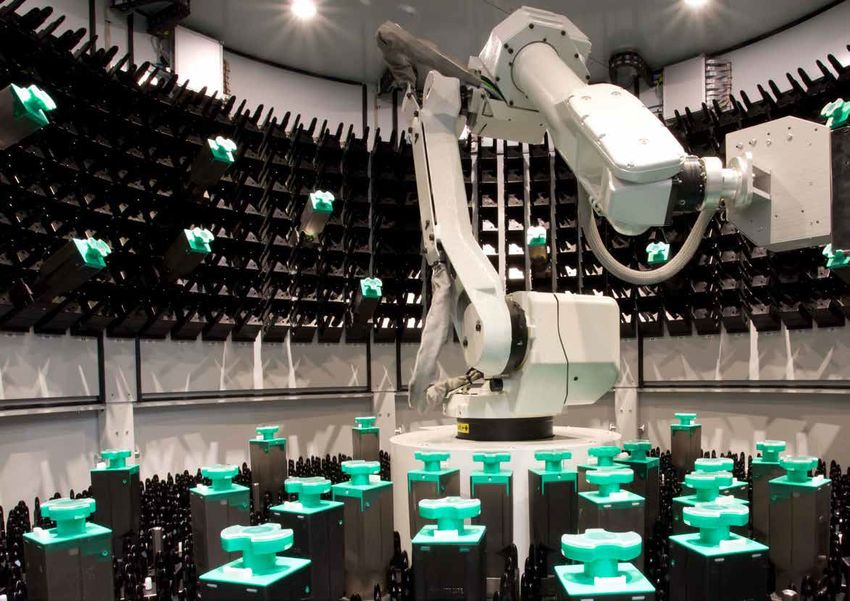
VALUE CREATION WITHIN TKH
                            TKH focuses on distinguishing potential for an above-average performance
                              Niche player strategy – focus on high-grade solutions and relatively small
                              markets with high margins
                              High pricing power due to innovative unique solutions
                              Selling high return on investment to customers
                              Besides entering into partnerships, we focus on the development of advanced
                              proprietary technologies
                              High added value through system integration, service and solutions
                              Commodity products used primarily as part of total solutions
                              Outsourcing more than 70% of capital intensive production - flexible capacity
                              is available and cost basis more variable
                              Focus on high-growth vertical markets or market share expansion potential
                              - optimal use of R&D-resources and investments to markets with largest
                              potential
                              Spreading risk across a large number of product/market combinations
                              Geographic focus for growth: Europe, Asia, North America; limited number of
                              export focus areas outside these territories
                              Acquisitions in defined growth verticals

                                                                                                              10
OPERATING MODEL
TKH focuses on the business segments Telecom, Building and
Industrial Solutions. Our core technologies are linked to each
other to total systems, which are positioned within these 3
business segments. TKH focuses on 7 vertical growth markets
where the (total) solutions are positioned as a ‘one-stop-shop’
for our customers
TKH has a decentralized organizational structure where
responsibilities are delegated deep within the organization
Operating companies are clustered in groups based on
activities / core technologies / markets. These clusters are
organized under one management, which facilitates the
realization of synergies within the cluster
Most managing directors are also incentivized on realized
synergies between the companies
11STRATEGY
MISSION STRATEGIC PILLARS STRATEGIC PRIORITIES STRATEGIC TARGETS medium-term
A leading innovative INNOVATIVE SIMPLIFY INNOVATIVE
technology (niche) A leading innovative technology Reduce activities that offer • Innovations: >15% of turnover
player that creates (niche) player that creates limited potential for value • At least 70% of turnover linked to SDGs
comprehensive best-in- comprehensive best-in-class creation. • Strengthening and expanding TKH brand
class solutions which solutions. • Increase brand awareness in vertical
constantly exceed Simplify business structure by growth markets
customer expectations. integrating operating
companies. FINANCIAL PERFORMANCE
FINANCIAL PERFORMANCE
• Vertical growth markets: at least 80% of
A solid investment for Create added value for all Develop a less complex total turnover
shareholders. stakeholders while at the same business and communication • ROS: >15%
time being a solid investment structure. • ROCE: 22-25%
for shareholders.
• Net debt/EBITDA: 16 hours/year
employer. average growth potential and • Employee satisfaction: >7.1
return contribution. • Illness rate: 7.8
• No reports of violations of code of conduct
12R&D SUPPORTS THE INCREASE IN GROSS MARGIN
in % of turnover
With our core technologies we can respond to these growth trends We are making a significant contribution to the Sustainable
and can offer innovative comprehensive systems by combining these Development Goals (SDGs) through our innovative product portfolio,
technologies. Investments in research and development and the roll- supporting our customers in achieving their sustainability criteria and
out of innovations are important areas of focus for growth. Our target simultaneously providing clear direction on how forward-looking our
is to generate at least 15% of turnover through innovations introduced company is in terms of sustainable development. We focus on
in the previous two years. As a result, the portfolio is in the early securing a leading position in niche markets.
stages of the product life cycle. We invest predominantly in our own
technological development, although we also work closely with other
parties on specialisms.
13SUSTAINABILITY GOALS ARE KEY IN THE STRATEGY
SDGs ESG
About 70% of our revenues is related to The Environmental, Social, and
‘Sustainable Development Goals’. Corporate Governance (ESG) themes
are for TKH the three central factors in
TKH has chosen six SDGs to act as a guide in its approach to measuring our sustainability and
sustainability. Four of these focus on the innovative product societal impact.
portfolio and two on internal operations and business practices.
14VERTICAL GROWTH MARKET FOCUS TO ACCELERATE GROWTH
Growth Business & markets
Turnover (in € millions) 2012 2019 2020 scenarios
Through its segmentation, TKH focuses on telecommunications,
Fibre Optics Network 80 137 122 175 200
building and industrial solutions. The TKH core technologies - vision &
Parking 20 59 37 150 200 security, connectivity and smart manufacturing - are linked together to
Infrastructure 30 133 131 150 200 form comprehensive systems, which are positioned within these three
business segments.
Marine & Offshore 20 54 55 150 200
Care 30 58 53 70 100 Within the business segments, TKH focuses on seven vertical growth
markets - Fibre Optic Networks, Care, Infrastructure, Parking, Marine
Machine Vision 95 143 173 250 300 & Offshore, Machine Vision and Tire Building Industry - in which the
Tire Building Industry 175 330 242 450 550 (comprehensive) solutions are positioned as a one-stop-shop for our
Growth verticals 450 914 813 1,395 1,750 customers. These are markets with favorable growth trends so we
can achieve above-average growth and high returns in them. With our
Other vertical markets 652 576 476 450 500 solutions, we offer customers clear added value in terms of efficiency,
Total 1,102 1,490 1,289 1,845 2,250 safety and sustainability. We also provide them with a high return on
their investment.
Growth scenarios for coming 3-7 years
Within the defined seven vertical growth markets, we expect to
achieve growth of € 300 to € 500 million over the next 3-5 years. We
aim to realize more than 80% of the turnover in these growth markets.
By 2020, this share was 63% of total turnover.
154 Business Update & Highlights 2020
16HIGHLIGHTS 2020
H2 H2 Turnover decreased by 13.4% (H2: -17.1%) – Organic -9.9%
(in million € unless stated otherwise) 2020 2019 Δ in % (H2: -12.5%)
Turnover 610.4 736.4 -17.1%
EBITA before one-off expenses 1, 2) 66.5 94.9 -29.9% EBITA before one-off’s decreased by 21.4% (H2: -29.9%)
1)
ROS 10.9% 12.9% Strong decline Industrial Solutions, increase Building Solutions
Net profit before amortization and one-off
ROS decreased to 10.5% (H2: 10.9%), but improved compared to
income and expenses attributable to 34.4 59.4 -42.2%
HY1 2020 from 10.2% to 10.9% in H2 2020 due to lower cost level
shareholders 1, 3)
Net profit before amortization and one-off income and expenses
(in million € unless stated otherwise) 2020 2019 Δ in % attributable to shareholders € 70.3 million (-33.2%), above
Turnover 1,289.4 1,489.6 -13.4% communicated bandwidth of € 65 - € 69 million
EBITA before one-off expenses 1, 2) 135.6 172.5 -21.4%
ROS 1) 10.5% 11.6% One-off expenses and impairments due to costs related to
Net profit before amortization and one-off restructurings and integrations
income and expenses attributable to 70.3 105.3 -33.2%
shareholders 1, 2, 3) Good order intake in Q4, partly due to high order intake in Tire
Earnings per ordinary share € 1.14 € 2.72 -58.1% Building
Dividend (proposal) per share € 1.00 € 1.50
Cash flow from operating activities strongly increased in H2 to
ROCE 14.0% 17.4%
€ 150.1 million (H2 2019: € 126.6 million and H1 2020: € 37.7
1) The one-off expenses in 2020 relate to costs for restructuring and integrations totaling € 8.9 million) – driven by strong working capital improvement in Q4
million and a book profit on a business property held for sale of € 2.0 million (2019: one-off
expenses of € 18.3 million). The one-off expenses for H2 amounted on balance to € 5.2 million
(H2 2019: € 18.3 million). Strong financial position year-end – net debt / EBITDA ratio of 1.6
2) For further specification, reference is made to the “Overview of alternative performance
indicators”, which is included after the financial statements.
Dividend proposal: € 1.00 per (depositary receipt of an) ordinary
3) Amortization of intangible non-current assets related to acquisitions (after tax).
share
17HIGHLIGHTS 2020
Progress realization of targets and strategy
Targets
Key financial targets (mid-term) 2020 2019 Good progress in strategic development, despite COVID-19, driven by
'Simplify & Accelerate' program – perspective of medium-term ROS
ROS > 15% 10.5% 11.6% target of at least 15% remains unchanged
ROCE 22% - 25% 14.0% 17.4% Innovations with 21.1% revenue share again at a high level –
NET debt / EBITDA < 2.0 1.6 1.5 breakthroughs and first orders for various innovations
Divestment program restarted in Q4
Financial impact COVID-19 Targeted divestment of activities with limited value creation in TKH
Lower demand because customers were hindered in realization of environment
projects. Investments were limited or postponed in markets like About € 260 million in turnover from intended € 300 to € 350 million
airports, parking garages, shipbuilding and industrial sector already realized – divestment of ZTC and Cruxin closed in 2020
Due to measures taken, aimed at providing a safe and healthy working Introduction of cost-ratio program, part of ‘Simplify & Accelerate’
environment, productivity in production companies was considerably program, with more short-term focus on financial returns
lower Integrations and actions for result improvement led to one-off
Government support (outside the Netherlands) led to a temporarily expenses of € 8.9 million – positive annual result effect of € 7 million
reduction of personnel costs of € 6.8 million Relocation of cable production in Ittervoort to Haaksbergen and
termination of poorly performing activities of industrial connectivity
Impairments related to COVID-19 of € 2.0 million portfolio
Increase of working capital due to delayed deliveries of € 10 million, Integration of Security and Parking activities and portfolio under TKH
opposite effect due to delayed tax payments of € 22 million Security-brand
Cost savings and synergies within 2D vision activities and portfolio and
further commercial cooperation between 2D and 3D Vision
Share buyback program progress – € 18 million of announced € 25
million shares repurchased
18‘SIMPLIFY & ACCELERATE’ PROGRAM
BANDWIDTH
BANDWIDTH ROS IMPROVEMENT REALIZED STEPS
AREA’S TURNOVER DEVELOPMENT TARGET >15% IMPACT ON TURNOVER AND ROS 1)
Industrial connectivity (2019) € -175 million
DIVESTMENTS - € 300 - 350 million 1.2 % - 1.6 % ZTC (2020) € -70 million
Cruxin (2020) € -10 million
Restructuring and integration (2019) +0.2%
INTEGRATION 0.8 % - 1.2 %
Restructuring and integration (2020) +0.5%
INNOVATIONS & Increase order book and sales funnel,
+ € 200 - 250 million 2.0 % - 3.0 %
FOCUS ON VERTICALS but costs in 2020 still ahead of benefits
Contribution of companies acquired in 2019
ACQUISITIONS + € 100 - 150 million turnover € +29 million in 2020
1) Turnover development and ROS improvement are compared to 2018 figures published in March 2019.
19VERTICAL MARKETS
Growth Turnover share of vertical growth markets increased to 63% (2019: 61%)
Turnover (in € millions) 2012 2019 2020 scenarios
Fibre Optics Network 80 137 122 175 200 Strategic developments offer strong basis for growth and value creation:
Fibre Optic Networks – Increased demand for bandwidth and 5G roll-out
Parking 20 59 37 150 200
hampered by COVID-19 restrictions
Infrastructure 30 133 131 150 200
Parking – Impacted by COVID-19 in 2020, but synergies expected due to
Marine & Offshore 20 54 55 150 200 integration with TKH Security
Care 30 58 53 70 100 Infrastructure – Strong growth in market for energy cables due to demand
from energy transition – additional investments in production capacity initiated
Machine Vision 95 143 173 250 300 and operational from Q3 2021 – substantial order for Airfield Ground Lighting
(CEDD / AGL technology)
Tire Building Industry 175 330 242 450 550
Growth verticals 450 914 813 1,395 1,750 Marine & Offshore – Order intake subsea cable systems that enable growth to
more than € 40 million turnover in 2021
Other vertical markets 652 576 476 450 500
Care – Successful breakthrough Indivion (high grade medicine dosage and
Total 1,102 1,490 1,289 1,845 2,250 dispensing system) in North America
Machine vision – First larger order for 2D embedded vision technology
(COVID-19 vaccine analysis) and expansion market share with 3D vision
Growth scenarios for coming 3-7 years technology and confocal inspection technology within consumer electronics
Tire Building – Breakthrough of UNIXX, new technology for tire manufacturing
Other vertical markets
with first serial production at customer launch
Divestments mainly in other vertical markets
Growth at GDP rate
Winning orders for our innovations gives confidence in realization of
medium-term turnover targets in vertical growth markets – willingness to
invest among customers is increasing again
20TURNOVER DISTRIBUTION
DEVELOPMENTS
PER SOLUTION
2020
2020
21TELECOM SOLUTIONS
(in million €) 2020 2019 Δ in % Fibre optic networks
Turnover 183.1 200.5 - 8.6% Significant negative impact on deliveries from COVID-19 restrictions in
Europe, particularly in France
EBITA 23.1 30.8 - 25.0%
Increased demand for bandwidth in combination with demand from 5G –
ROS 12.6% 15.4% Due to lockdown not yet translated into higher order intake – Production at
a lower level, which resulted in lower cost coverage
Price pressure on optical fibre in China due to lower market volumes –
Within TKH mainly offset by higher share of complementary connectivity
portfolio
Other markets
Growth in broadband products for home offices
Number of projects postponed due to COVID-19
Mid-2020, production of telecom copper cable portfolio was terminated –
Turnover already decreased to low level in recent years
22BUILDING SOLUTIONS
Machine Vision
(in million €) 2020 2019 Δ in %
Turnover 672.5 745.0 - 9.7% Strong organic growth was achieved in H1, despite restrictions caused by lockdowns
EBITA before one-off Strong growth in demand for our 3D vision technology for new applications in
expenses 1) 77.3 75.5 + 2.4% consumer electronics industry contributed significantly to growth in H1 – Growth
leveled off in H2
ROS 11.5% 10.1%
Achievement of cost efficiency through integration of 2D vision activities –
Contribution to EBITA and ROS-improvement
1) The one-off expenses concern costs of € 8.6 million for restructuring and
integration (2019: € 17.2 million).
Infrastructure
Turnover remained stable on balance
Increased investment needs for energy networks by network companies – Positive
effect on demand for energy cable systems, despite restrictions for installers to carry
out work – Expansion of our production capacity, operational from Q3 2021
Airfield Ground Lighting (CEDD / AGL) technology faced COVID-19 effects and
related investment constraints at airports – Increase in revenue in Q4 due to large
order for Istanbul Sabiha Gökçen Airport
Postponement of projects in traffic monitoring systems led to a decrease in turnover
Care
Increased market demand for communication technology for care alarms and elderly
care – Turnover decreased because of limited installation possibilities at care
institutions due to COVID-19
23BUILDING SOLUTIONS
(in million €) 2020 2019 Δ in % Marine & Offshore
Turnover 672.5 745.0 - 9.7% Sharp turnover growth due to orders for subsea connectivity systems acquired in
2019 – Depressed result caused by low occupancy and start-up costs due to new
EBITA before one-off
expenses 1) 77.3 75.5 + 2.4% cable types
New orders won with Kaskasi Offshore Wind Farm and Hollandse Kust Zuid –
ROS 11.5% 10.1% most will be produced in 2021
1) The one-off expenses concern costs of € 8.6 million for restructuring and Drop in demand from stagnation in construction of cruise ships – More than offset
integration (2019: € 17.2 million). by growth in subsea connectivity systems
Parking
Main market North America negatively impacted by shutdown of projects and
tenders at airports and shopping centers due to COVID-19
Significant reduction of operating costs in anticipation of lower investment level at
customers
Integration of parking and security organization started in Q3 – Optimization of
synergies
Other markets
Limitations in execution of projects in building & construction market
Effect from COVID-19 safety measures on production output
24INDUSTRIAL SOLUTIONS
Tire building
(in million €) 2020 2019 Δ in %
Turnover 433.7 544.2 - 20.3%
Postponement of completion of various projects due to lockdowns at customer
sites – Turnover decreased
EBITA before one-off
47.3 81.4 - 41.8% Drop in demand at tire manufacturers led to postponement of investments –
expenses 1)
Lower order intake in Q2 and Q3, recovery in Q4 with a relatively high share of
ROS 10.9% 15.0%
orders from China – Share of top 5 tire manufacturers still limited
1) One-off income and expenses due to a book profit on the sale of a
business property of € 2.0 million and restructuring costs of € 0.3 million
Development of UNIXX (new tire-building platform) progressing well –
(2019: expense of € 1.1 million). Completion delayed due to temporary closure of location of launching
customer
Decrease EBITA due to decline revenue in combination with lower productivity
level and limited reduction of operating expenses
Care
Breakthrough in North-America for large-scale roll-out of Indivion technology,
high-end automated medicine dosage and dispensing system
Turnover growth in H2
Other markets
Industrial sector is reluctant to invest, particularly machine builders and robot
industry – Negative impact on turnover in industrial connectivity activities,
mainly due to reduction of inventories
255 Financial performance 2020
26GEOGRAPHICAL DISTRIBUTION OF TURNOVER
Geographical distribution of turnover (in %)
27TURNOVER AND ADDED VALUE
(in € million) 2020 2019 Δ in % Organic turnover growth of -9.9%
Turnover 1,289.4 1,489.6 - 13.4%
Turnover growth from acquisitions of 1.9%
Raw materials and subcontracted work -651.8 -771.4
Commend AG (1 April 2019)
Added value 637.6 49.4% 718.2 48.2% - 11.2%
ParkEyes (1 April 2019)
SVS-Vistek (1 September 2019)
Change in turnover (in € million) FocalSpec (31 October 2019)
Turnover decline due to divestments of 5.2%
ZTC (1 January 2020)
Cruxin (1 April 2020)
Limited turnover impact from raw material prices
and foreign currencies (-0,3%)
Gross margin increased to 49.4% (2019: 48.2%)
mainly due to:
Acquisitions with higher added value
Divestments with lower added value
Higher turnover share of Machine Vision
28OPERATING EXPENSES AND EBITA
(in € million) 2020 2019 Δ in % Operating expenses decreased with 8.0%
Turnover 1,289.4 1,489.6 -13.4% Acquisitions (+1.3%)
Raw materials and Divestments (-2.2%)
-651.8 -771.4
subcontracted work Decrease of turnover related expenses
Added value 637.6 49.4% 718.2 48.2% -11.2% Cost-saving programs and integrations
Operating expenses 502.1 38.9% 545.7 36.6% -8.0% Working time reductions due to government support (-1.2%)
EBITA before one-off income FX-effect (-0.5%)
135.5 10.5% 172.5 11.6% -21.4%
and expenses
Cost to turnover ratio increased from 36.6% to 38.9%
Divestments
Lower productivity level at manufacturing companies
R&D expenditure
R&D expenditure decreased to € 60.6 million (2019: € 63.2
million)
Depreciation decreased with € 1.5 million to € 43.9 million due to
book profit on sale of assets of € 1.6 million (2019: € 0.3 million)
EBITA decreased by 21.4%
Telecom Solutions -25.0%
Building Solutions +2.4%
Industrial Solutions -41.8%
ROS: 10.5% (2019: 11.6%)
Improvement in H2 compared to H1 2020 from 10.2% to 10.9%
(H2 2019: 12.9%) due to a lower cost level
29ITEMS BELOW EBITA
(in € million) 2020 2019 Δ in % One-off expenses and impairments mainly related to 'Simplify
EBITA before one-off income & Accelerate‘ program and acquisitions – Part of impairment
135.5 10.5% 172.5 11.6% -21.4% linked to COVID-19 effects
and expenses
One-off expenses 6.9 18.3
Increase of amortization due to higher R&D investments in
Amortization 53.7 50.1 recent years
Impairments 4.0 5.0
Operating result 70.9 99.1 Interest expenses decreased by € 0.8 million, which was
offset by higher adverse currency effects of € 1.1 million
Financial expenses -10.4 -10.1
Result from associates -3.2 0.4 Result from associates decreased
Result from sale of companies 5.5 0.0 CCG: Amortization on ‘purchase price allocations’ of € 2.8
million, of which € 1.6 million relates to 2019, reduced results
Change in value financial liabilities 0.1 -0.1
Shin-Etsu: Lower volumes and prices of preforms at preform
Result before taxes 62.9 89.3 producer in China
Taxes 15.4 20.6
Book profit of € 5.5 million from divestment of ZTC
Net profit continuing operations 47.5 3.7% 68.7 4.6% -30.8%
Net profit discontinued operations 0.0 45.2 Effective tax rate increased to 24.5% (2019: 23.1%)
Lower profit contribution from low tax rate countries
Total net profit 47.5 3.7% 113.9 7.7% -58.3%
Partial capitalization of tax losses
Net profit before amortization Impact of change in Dutch tax rate
and one- off income and
70.3 5.5% 105.3 7.1% -33.2%
expenses attributable to Net profit from discontinued operations in 2019 related to
shareholders
divestment of majority of our industrial connectivity activities
(CCG)
30BALANCE SHEET 31 DECEMBER 2020
(in € million) 31-12-2020 31-12-2019 (in € million) 31-12-2020 31-12-2019
Intangible non-current assets 577.3 596.4 Shareholders' equity 661.8 704.5
Tangible non-current assets 219.9 230.9 Non-controlling interests 0.1 0.3
Right-of-use assets 77.4 80.8 Total group equity 661.9 704.8
Investment property Interest bearing loans and borrowings 409.5 415.8
Other associates 25.5 28.6 Deferred tax liabilities 55.1 65.5
Receivables 1.9 2.0 Retirement benefit obligation 5.9 5.8
Deferred tax assets 14.3 21.0 Financial liabilities 3.4 5.0
Total non-current assets 916.3 959.7 Provisions 5.7 6.3
Total non-current liabilities 479.6 498.4
Inventories 236.7 238.8
Receivables 157.4 182.1 Interest bearing loans and borrowings 57.1 58.1
Trade payables and other payables 258.8 259.8
Contract assets 124.2 115.7
Contract liabilities 73.9 49.2
Contract costs 3.3 1.9
Current income tax liabilities 11.0 11.8
Current income tax 1.8 1.6
Financial liabilities 4.5 3.7
Cash and cash equivalents 121.6 79.0
Provisions 19.1 19.1
Total current assets 645.0 619.1 Total current liabilities 424.4 401.7
Assets held for sale 4.6 38.7 Liabilities directly associated with assets held for sale 0.0 12.6
Total assets 1,565.9 1,617.5 Total equity and liabilities 1,565.9 1,617.5
Cash and cash equivalents includes € 56.0 million (2019: € 10 million) Financial covenants:
that are part of a balance and interest compensation schemes. Net debt, based on financial covenant as agreed with banks, of
€ 261.8 million (2019: € 300.6 million)
Assets held for sale decreased due to divestments of ZTC and Cruxin
Net debt/EBITDA of 1.6 (31 December 2019: 1.5)
Solvency of 42.3% (2019: 43.6%)
31WORKING CAPITAL
Changes in working capital (in € million)
200 Working capital as percentage of turnover
193.4 decreased to 12.1% (2019: 13.0%)
4.4
Use of non recourse factoring:
175 4.2 31-12-2020 € 43.6 million
- 20.2 - 0.4
- 2.0 30-06-2020 € 42.6 million
-3.6 -0.5
156.4 31-12-2019 € 38.7 million
150 -18.9
Use of supply chain finance:
31-12-2020 € 27.5 million
30-06-2020 € 25.3 million
125 31-12-2019 € 24.8 million
COVID-19 effects on working capital
netted under ‘Decrease’:
100
Decrease due to deferred tax payments
originated from H1 2020 of € 22 million –
payable in H1 2021
Increase due to postponement of delivery
and completion of various projects,
particularly in Industrial Solutions, due to
lock-down – impact of € +10 million
32NET DEBT DEVELOPMENT
Change in net debt (in € million) Strong positive cash flow from operations,
driven by a decrease in working capital
Net-investments in tangible and intangible
assets (€ 68.6 million), mainly:
Investments in R&D
Expansion, replacement and upgrade of
production capacity
Divestment of subsidiaries ZTC and
Cruxin in H1 2020
Cash dividend of € 1.50 paid per
(depositary receipt of) ordinary share in
2020
Purchased shares include € 7.1 million for
the share buyback program
33FREE CASH FLOW
(in € million) H1 2020 H2 2020 2020 2019 2018 Substantial growth in FCF compared to
previous years
Operating result from continued operations 35.9 35.0 70.9 99.1 129.2
Operating result from discontinued FCF-conversion improved due to relative
0.0 8.9 13.5
operations strong working capital decrease in H2 2020
Operating result 1) 35.9 35.0 70.9 108.0 142.7 combined with lower EBITDA.
Depreciation, amortization and impairment 52.4 50.7 103.1 100.6 70.0
EBITDA adjusted 88.3 85.7 174.0 208.6 212.7 Payments for acquisitions and proceeds
from divestments have not been included in
Change in working capital -40.2 82.7 42.5 0.1 -55.2
FCF
Taxes paid -11.5 -8.4 -19.9 -27.4 -28.0
Other 4.5 -4.6 -0.1 9.8 3.2 FCF-conversion is traditionally low in the
Cash flow from operations before first half year and strong in second half.
41.1 155.4 196.5 191.1 132.7
interest
Payment of lease liabilities -8.8 -7.2 -16.0 -15.8
Capital expenditure (tangible) -12.1 -17.3 -29.4 -30.6 -40.0
Capital expenditure (intangible) -17.7 -21.5 -39.2 -40.4 -35.2
Free Cash Flow (‘FCF’) 2.5 109.4 111.9 104.3 57.5
EBITDA to FCF conversion 2.8% 127.7% 64.3% 50.0% 27.0%
1) Including one-off expenses and impairments.
346 Outlook 2021 & Highlights Q1 2021
35OUTLOOK
Although the macroeconomic uncertainties resulting from COVID-19 will persist Care: Sales are expected to increase in 2021 due to normalization of COVID-
in the near future, we expect the global economy to gradually improve in 2021. 19 restrictions and increase in demand for health care domotic solutions.
However, we expect that the effects of COVID-19 will continue to be noticeable in In the other activities a partial recovery from the COVID-19-related revenue
H1 2021. Without escalation of the aforementioned circumstances and barring decline in 2020 is expected.
unforeseen circumstances, TKH expects the following developments per
‘Simplify & Accelerate’-program will also have a positive impact on result.
business segment for the year 2021:
On balance, an increase in both turnover and result is expected.
Telecom Solutions
Industrial Solutions
Fibre optics networks: Investments in Europe are expected to increase
further. Due to COVID-19 restrictions in H1 2021, sales will not yet reach pre- Tire Building: Due to very low order intake in Q2 and Q3 2020, sharp decline
COVID level. Current overcapacity in Chinese market can translate into is expected in both turnover and result in H1 2021. High order intake in Q4
margin pressure, but compensation expected through better product mix and 2020 and expected order intake in Q1 2021 provides good perspective for
focus on FTTH projects. increase in turnover and result in H2 2021.
On balance, an increase in both turnover and result is expected. Industrial Care: Increase in turnover is foreseen due to international roll-out of
Indivion.
Building Solutions The other Industrial activities are expected to recover in 2021.
Machine Vision: Further growth is expected, driven by new technologies such On balance, a decline in both turnover and result is expected within this
as Alvium 2D- and confocal 3D-visiontechnology. segment.
Infrastructure: Further increase in turnover is expected due to increased
investment need for energy networks by network companies. Growth is
Due in particular to the impact of the low order intake in Tire Building in Q2 and
expected for CEDD / AGL activities based on the contracted and identified
Q3 2020, the profit of TKH in H1 2021 will be lower than in H1 2020. For the full
projects.
year 2021, TKH expects to record a higher profit. As usual, TKH will express a
Marine & Offshore: Strong growth is expected for subsea cable systems concrete expectation for the profit for the whole of 2021 at the presentation of the
based on solid order intake 2020. This will more than compensate for drop in half-year figures in August 2021.
demand for cruise ship cable systems.
Parking: Limited recovery is expected as impact of COVID-19 are still
noticeable.
36HIGHLIGHTS Q1 2021
Developments in first quarter Infrastructure: Some negative effects of lockdowns, but good development of
demand for energy connectivity systems.
According to expectations, organic turnover decline of 4.7% compared to Q1
2020 – organic growth in Telecom and Building Solutions did not compensate Parking: Market circumstances continue to be difficult, with continuing low
substantial lower turnover in Industrial Solutions caused by low order intake in investment level.
Q2 and Q3 2020. Care: Strong turnover growth, driven by breakthrough of Indivion technology
EBITA decreased in line with turnover – substantial increase in Building as well as connectivity systems for medical equipment.
Solutions. Tire building: Continued recovery of order intake, including from tier 1
Following recovery of order intake in Q4, further increase order intake in Q1 – customers, expected to continue in Q2. Substantial lower turnover due to low
growth order book at 31 March 2021 compared to 31 December 2020 and 31 order intake in Q2 and Q3 2020. Order intake of past quarters will be
March 2020. translated in higher turnover in Q2 2021, earlier than originally expected with
positive effect on Q2-result.
Our innovations are getting further traction in the market. This strengthens our
confidence that TKH’s results will improve towards our medium-term ROS- Progress in share buy-back program
target of 15%.
Share buy-back program launched on 18 November 2020, with intention of
reducing issued share capital in due time, has been completed – TKH has
Developments per vertical market
purchased 623,334 depositary receipts of shares for an amount of € 25
Fibre Optic Networks: Good recovery of turnover due to high investment million.
priority for fibre networks in Europe and less negative impact from lockdowns Share buy-back program of 200,000 shares announced on 9 March 2021 to
on installation capacity. Some negative effect on margin due to overcapacity in meet obligations under shares and options schemes – TKH has purchased
Chinese market. 187,933 depositary receipts of shares up to 4 May 2021.
Machine Vision: Strong organic increase in turnover and order intake for Outlook
consumer electronic market segment. Also, factory automation, logistics,
automotive and wood sector show further growth. Improved market circumstances as well as our capability to increase our
manufacturing capacity utilization to a higher level in Q2 than originally expected,
Marine & Offshore: Good development of turnover, particularly due to subsea leads to an improved outlook for H1 2021. Current uncertainty with respect to
cable activities where turnover increased further with good perspective for new supply chain and on timely delivery of components has had limited effect on
orders. TKH’s activities so far. As usual, TKH will give a more specific indication of profit
outlook for full-year 2021 at presentation of interim results in August 2021.
37Disclaimer
Statements included in this press release that are not historical facts (including any statements The forward-looking statements are based upon our current expectations, plans, estimates,
concerning investment objectives, other plans and objectives of management for future operations or assumptions and beliefs that involve numerous risks and uncertainties. Assumptions relating to the
economic performance, or assumptions or forecasts related thereto) are forward-looking statements. foregoing involve judgments with respect to, among other things, future economic, competitive and
These statements are only predictions and are not guarantees. Actual events or the results of our market conditions and future business decisions, all of which are difficult or impossible to predict
operations could differ materially from those expressed or implied in the forward-looking accurately and many of which are beyond our control. Although we believe that the expectations
statements. Forward-looking statements are typically identified by the use of terms such as "may“, reflected in such forward-looking statements are based on reasonable assumptions, our actual results
"will", "should", "expect", "could", "intend", "plan", "anticipate", "estimate", "believe", "continue", and performance could differ materially from those set forth in the forward-looking statements.
"predict", "potential" or the negative of such terms and other comparable terminology.
38ANNEX I:
CORE TECHNOLOGIES &
VERTICAL GROWTH MARKETS
39BIJLAGE I:
TKH TECHNOLOGIEËN
40CORE TECHNOLOGIES
Vision & Security Connectivity Smart Manufacturing
• 2D and 3D camera sensor technology • Subsea & marine cable systems • Passenger & Truck tire assembling systems
• 3D laser scan technology • Optical fibre connectivity • Tire component production systems
• Video surveillance systems • Contactless energy & data connectivity • Vision inspection
• Video management and -analysis • Specialty cable systems • Medicine distribution systems
• Intelligent traffic systems • Drag chain cable systems • Product handling
• Parking guiding and control systems • Multi Media data cable connectivity • Production automation
• Access control & registration systems • Energy, building & Infra and installation
• Building management & monitoring connectivity
• (Personal) alarm systems
• Mission critical communication
41TKH – VERTICAL GROWTH MARKETS – FIBRE OPTIC
NETWORKS
Turnover developments and targets
Bandwidth growth
Turnover (in € millions) 2012 2019 2020 scenario
Fibre Optics Network 80 137 122 175 200
Growth drivers
Data use through the impact of information and communication technology on the way we live our lives continues to grow
Internet has become a basic service, like gas, water and electricity
Developments such as the 'Internet of Things', 'Industry 4.0' and 'Internet of Vehicles' will require a high (mobile) internet speed -
emergence of 5G internet
24-hour availability is becoming more established and accepted
Several European countries have announced investment plans for rollout of FttH projects to meet the strong increasing need for
bandwidth
Position
Integrated solutions – connectivity – security
High knowledge level of network requirements customers
Cost leadership
Strong innovative power
Resources prepared for growth with available and exiting capacity
4243
TKH – VERTICAL GROWTH MARKET – PARKING
Turnover developments and targets
                                                                              Bandwidth growth
Turnover (in € millions)                      2012       2019         2020        scenario
Parking                                          20         59           37      150        200

Growth drivers
    Frictionless parking is a key trend for the future of parking which needs new technology
    The addressable market for the TKH technologies is growing fast because technologies become efficient for smaller parking
    High priority for parking owners and operators to increase the in general low utilisation rate of parking garages
    High priority to work with revenue enhancing technologies related to differentiated and variable pricing per parking space
    Increased level of security to cope with the increased level of thefts – communication and video based monitoring systems
    Need to reduce the Co2 footprint – through efficient guiding systems that streamline the traffic in the parking garage
    Preparation for autonomous driving cars ask for sensor infra structure and guiding
    Demand for efficiency solutions to lower the OPEX – central control rooms and automatic call handling
    Demand for more comfort and convenience for parkers to improve the parking garage competitive position

Position
    Strong worldwide installed base with parking operators as well as hospitals, airports, shopping malls, retail and event locations
    Available disrupting technologies that meet the requirements of today and the future in parking
    Technologies available that drive efficiency through centralization, smart maintenance, yield management and modular parking solutions
    Strong worldwide sales organization – with especially strong position in the segment of bigger parking garages >2,000 spaces
                                                                                                                                             44
45
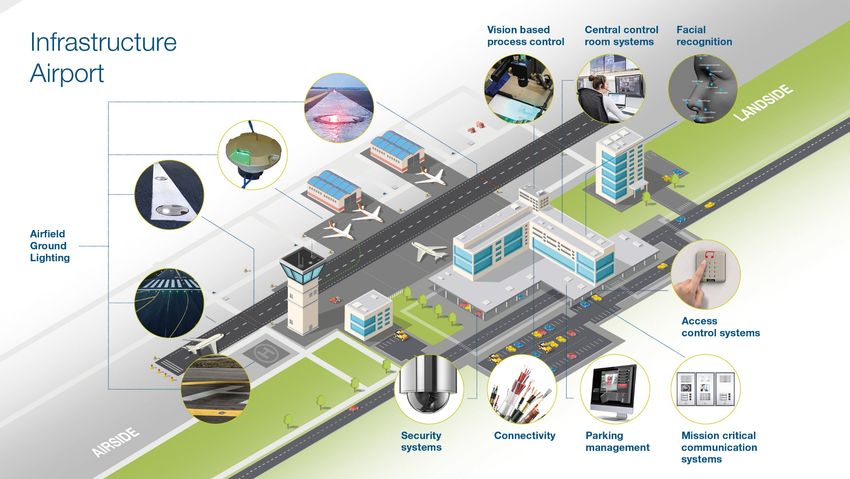
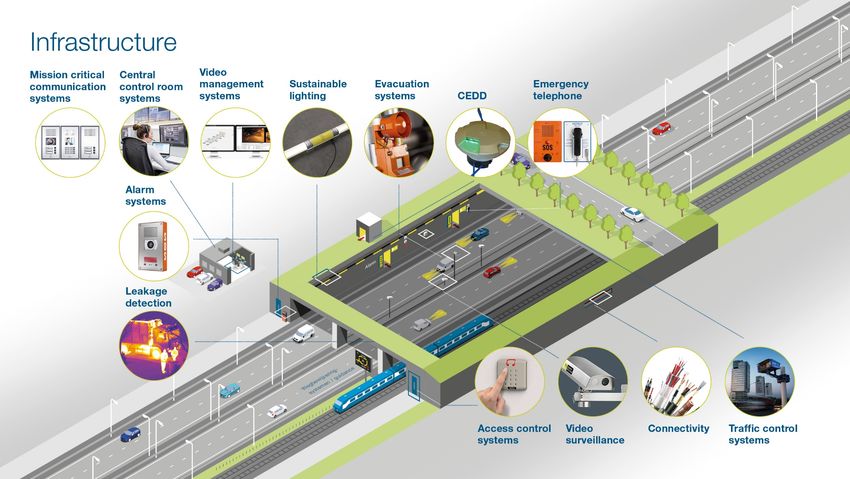
TKH – VERTICAL GROWTH MARKET – INFRASTRUCTURE
Turnover developments and targets
                                                                             Bandwidth growth
Turnover (in € millions)                      2012       2019         2020       scenario
Infrastructure                                  30        133          131         150     200

Growth drivers
   Sizable investment in tunnel technology in Europe for new and existing tunnels planned for the next few years
   Increasing demand for technologies due to strict legislation, regulations and requirements: evacuation - communication - detection - identification -
   security
   Principals are shifting responsibilities to the contractors - formation of alliances between principals and contractor so that parties have a common
   interest in cost control
   Availability is paramount (reduced down time) for infrastructure: tunnels, airports and roads.

Position
   Highly integrated security solutions, designed for infrastructure and tunnels
   Total security concepts (video and communication) – number 1 position in Benelux
   Disruptive airfield lighting solution based on CEDD technology
   TKH advanced technologies require less maintenance and deliver more efficiency

                                                                                                                                                           46
47
48
TKH – VERTICAL GROWTH MARKET – MARINE & OFFSHORE
Turnover developments and targets
                                                                                  Bandwidth growth
 Turnover (in € millions)                        2012        2019         2020        scenario
 Marine & Offshore                                  20         54            55      150       200

Growth drivers
   Large increase global generated power by wind power
   Demand for larger cargo ships and need for efficient external site management
   Increase in the building of quality ships, cruise liners and luxury yachts
   Increase of remote control and secure of unmanned operations on platforms
   A lot of attention for safety on platforms via special ‘zone’ certification.
   Modification of supply chain due to limited storage capacity on shipyards and platforms and high cost of downtime
   High demands on system availability under various environmental conditions, such as extreme temperatures, humidity, oil, salt water

Position
   Addressing Safety & Security in certification rich environment
   Vessel attendance system, smart camera solutions incl. thermal, leakage detection, ATEX housing and mission critical communication
   Subsea cable solutions - completing portfolio in data connectivity, power cables and safety
   Expanding in international large accounts

                                                                                                                                         49
50
TKH – VERTICAL GROWTH MARKETS – CARE
Turnover developments and targets
                                                       Bandwidth growth
Turnover (in € millions)         2012   2019    2020       scenario
Care                               30     58      53            70     100

Growth drivers
   Life expectancy is continually increasing and healthcare spending will increase sharply due to more and better, but also more expensive care –
   therefore, the demand for technologies for care solutions is increasing
   Changing healthcare funding: shifting from the government to the institutions and healthcare insurers
   Innovation in the field of domotics, diagnostics, e-health and self-testing for prevention and screening, provide new business in the sector.
   Shortage of skilled workers
   Informal caregivers play an important role and, together with the client and the healthcare professionals, are equal partners - technology support is
   necessary for the required information exchange
   The demand for medicines (volume) has been growing as a result of demographic developments, while the cost of care will have to be lowered
   Increase central task of preparing medicines in a remote location - acceptance of robotics in pharmacy wholesale

Position
   Smart Care concept with centralized management and community platform
   End to end, modular care platform including service concept with data hosting to increase care efficiency and quality
   Viedome is leading care concept in NL with increasing service model – selected international roll-out (Germany, France)
                                                                                                                                                           51
52
TKH – VERTICAL GROWTH MARKET – MACHINE VISION
Turnover developments and targets
                                                                             Bandwidth growth
Turnover (in € millions)                      2012       2019         2020       scenario
Machine Vision                                  95        143          173       250       300

Growth drivers
   Demand for vision technology is increasing due to trend towards industrial automation and robotics need
   Continued increased demand for more productivity and improvement of quality of products and manufacturing processes
   Vision technology is a superior alternative for the control of production systems and for detection, inspection and identification that cannot be seen
   by the human eye
   Strong increase of new applications where vision technology will be applied and adopted
   Data from the camera can be decentral stored and computed in real time through embedded technology
   Because of strict regulations to the quality of food and medicines, vision technology offers the solution because of the 100% traceability and ‘fail /
   pass’ application

Position
   Technology leadership in many application areas
   Market leader for high-end systems and one stop shop solutions
   Strong innovation and R&D competence with breakthrough technology for 3D inspection and embedded technology
   Strong worldwide sales organization with key account structure for individual customer management
   Recognized by leading Industrial application companies worldwide as key supplier
                                                                                                                                                            53
54
TKH – VERTICAL GROWTH MARKETS – TIRE BUILDING
Turnover developments and targets
                                                                             Bandwidth growth
Turnover (in € millions)                      2012       2019         2020       scenario
Tire Building Industry                         175         330         242        450       550

Growth drivers
   High priority of the tire manufacturing industry to replace existing technology with an emphasis on high productivity, efficiency, waste reduction, quality
   improvement and smaller batches
   The number of types of tire for passenger cars has increased more than tenfold in recent decades. This calls for more flexible production methods
   The trend towards ever larger tire dimensions and towards safer, better-quality tires requires technological developments
   Local production - innovations have become essential to reduce the working capital requirement in the supply chain of the tire manufacturing industry
   Over 70% of the existing tire manufacturing systems are older than 15 years
   Due to the high prices of raw materials, there is a need for a more efficient use of materials in the production of tires which asks for high tech
   manufacturing systems
   Due to rising labour costs, demands for manufacturing systems with higher productivity and high operator independence – ‘eyes & hands off’
   manufacturing

Position
   Market share TKH in outsourced market: > 70%
   Total market share including top five tire manufacturers: > 20% – target >50%
   Technology leadership through high level of R&D - protected with patents and high innovation level
   Proprietary vision technology strong differentiator for the technology leadership                                                                        55
56
ANNEX II:
INNOVATIONS

              57
FON - TOTAL SOLUTION
FOR MODERN FIBRE
OPTIC NETWORKS ROBOTIC MEASURING
SOLUTION
• Time efficiency
Fibre optic networks are expected to provide high reliability • Accuracy
• Ease of installation
and lower response times. For this purpose, TKH has its • Lowers OPEX
ACE solution for modern fibre optic networks which, in • Eliminates human
errors
addition to optical fibre cables, also includes connectors,
SMART CABINET
pipes, sleeves, fibre management systems, security and
CONTROL
robotic systems and other accessories. • Remote control tilt
and temperature
• Reliability,
efficiency and
safety
58SMART 3D MACHINE
VISION - FOR CONSUMER
ELECTRONICS CELL PHONE COVER GLASS
ASSEMBLY INSPECTION
INSPECTION • Deliver 3D shape data on both
specular and diffuse materials
in a single scan, with complete
Gocator® all-in-one 3D smart sensors are trusted worldwide scan, measure and control
for automated inline inspection. Gocator combines 3D inspection speed up to 10 kHz
scanning, measurement and control in a single device, with
no external PCs or controllers required. FIT AND FINISH
INSPECTION
• Generates 3D data of
specular and diffuse
targets at 8 μm X
resolution and 0.2 μm Z
repeatability
GEOMETRIC DIMENSIONING
AND TOLERANCING
• inspects mated
components like
transparent plastic and
metal
59TECHNOLOGY BENEFITS
• The ALVIUM® chip has a much higher feature
density than equivalent off-the-shelf FPGA,
which allows for high performance cameras to
come in a very small package.
• The on-board pre-processing performs image
ALVIUM 2D VISION – correction and optimization inside the camera,
which frees CPU on the host side for the
VISION PROCESSOR
actual image-processing, and host processing
application.
TECHNOLOGY VIA ‘SYSTEM- • ALVIUM® Technology is preconfigured to
support all current and upcoming image
ON-CHIP’ APPLICATIONS
sensors.
• The ALVIUM® SoC has a much more effective
power management than an equivalent. The
ALVIUM® is the combination of a unique, proprietary system on a ALVIUM® processor only consumes as much
as it needs to run the activated features. It
chip (SoC) designed for embedded and PC based computer vision optimizes the operating time of battery-
powered devices and reduces heating, which
and a dedicated image-processing library (IPL). ALVIUM®’s design makes ALVIUM® Technology particularly
is based on an Application Specific Integrated Circuit (ASIC), valuable for the embedded world.
which makes it possible to build high-performance, sophisticated • The ALVIUM® hardware is an Application
Specific Integrated Circuit (ASIC) designed
cameras in a smaller package and at a lower cost than ever before. specifically as a low-cost image sensing
processor and is mass produced to allow us to
cut the costs radically without cutting the
performance.
60CEDD/AGL -
REVOLUTIONARY
LIGHTING SYSTEM
FOR AIRFIELDS
CEDD/AGL is a unique connectivity technology for
the contactless distribution of energy and data,
further enriched with TKH’s technology and know-
how in the field of asset & site management INNOVATIVE CONNECTIVITY
CONCEPT
• Lower OPEX
• Energy reduction ~50%
• Preventive maintenance
CONTACTLESS DISTRIBUTION
• Easy & quick
installation
• High safety & efficiency
• Smart and smooth
maintenance
• Spark-free
61SUBSEA CONNECTIVITY –
A FUNDAMENTAL ROLE IN INNOVATIVE & SUSTAINABLE
CABLE CONCEPT
THE ENERGY TRANSITION • Good electro-magnetic shield - 3x800 mm2,
up to 72 kV
• Installation efficiency through innovative
sealing kit
A well-considered, distinguishing cable concept that connects • No lead and bitumen / 100% watertight
wind turbines in wind farms at sea with each other and that • No risk of leaching chemicals or metals
• Easy and clean recoveries possible
can be fully adapted to meet the challenges of array-wiring, • Good recyclability after clean recoveries
with complete focus on risk management and saving
INNOVATIVE MANUFACTURING
installation time. PROCES
• State-of-the-art
manufacturing facility
• Automatic quality control
production processes
• Long lengths - high
installation flexibility,
lowering risks and costs
62INDIVION - SMART
MANUFACTURING IN THE BENEFITS
HEALTHCARE MARKET • Maximum drop height for medications just
20 cm - prevents damage or cross-
contamination between medicines
TKH deploys smart manufacturing technology in response to
• Unique RFID tag in each canister to
the ever stricter quality measures set by the pharmaceutical
determine precisely which medications are
industry to reliably package different medications as a single in the machine, and how to control this
unit per sachet, per time of administration. In addition, stricter specific canister for the correct
rules apply with regard to materials that come into direct dispensation of medicines
contact with the medicines. With its smart manufacturing
• Unrivalled capacity - produces up to
technology TKH makes it possible to achieve a real step-by-
10,000 individual units per hour, while
step change in quality, speed, costs and, not least, accuracy providing an absolute minimum risk of
using a tried-and-tested industrial robot called INDIVION. cross-contamination and incorrect dosage.
• Dispensation accuracy of 99.97%
• Cost-effective solution available on the
market due to the reduction in manual
labour and a minimal number of errors that
equates to almost zero.
63UNIXX: A REVOLUTIONARY
DEVELOPMENT IN THE FIELD
OF TIRE BUILDING SYSTEMS BENEFITS
• Full track & trace
UNIXX offers an unprecedented solution, especially in • Fitting ‘Industry 4.0’
economic terms. The development is based on Industry 4.0
and the ‘Smart Factory’ principle. Combining this with a • Shorter new tire development process
very high level of automation, data-generation and data- • Global leadership in assembly used to
processing will result in a highly flexible and reliable new increase our scope to include component
generation of tire building machines. Thanks to ‘advanced manufacturing
building technology’, this could be described as a
• Flexible and straightforward logistics
pioneering development for the sector.
• Lower energy consumption & waste
• Ability to handle advanced high tech
components
• Extreme level of automation
• Unprecedented process control
• Increased tire quality by more accurate
components
64Disclaimer
Statements included in this press release that are not historical facts (including any statements The forward-looking statements are based upon our current expectations, plans, estimates,
concerning investment objectives, other plans and objectives of management for future operations or assumptions and beliefs that involve numerous risks and uncertainties. Assumptions relating to the
economic performance, or assumptions or forecasts related thereto) are forward-looking statements. foregoing involve judgments with respect to, among other things, future economic, competitive and
These statements are only predictions and are not guarantees. Actual events or the results of our market conditions and future business decisions, all of which are difficult or impossible to predict
operations could differ materially from those expressed or implied in the forward-looking accurately and many of which are beyond our control. Although we believe that the expectations
statements. Forward-looking statements are typically identified by the use of terms such as "may“, reflected in such forward-looking statements are based on reasonable assumptions, our actual results
"will", "should", "expect", "could", "intend", "plan", "anticipate", "estimate", "believe", "continue", and performance could differ materially from those set forth in the forward-looking statements.
"predict", "potential" or the negative of such terms and other comparable terminology.
65You can also read