IOM COVID-19 IMPACT ON POINTS OF ENTRY - BI-WEEKLY ANALYSIS 12 JANUARY 2022 - ReliefWeb
←
→
Page content transcription
If your browser does not render page correctly, please read the page content below

IOM COVID-19
IMPACT ON
POINTS OF ENTRY

       BI-WEEKLY ANALYSIS
         12 JANUARY 2022

                            0
PUBLISHER

The opinions expressed in the report are those of the authors and do not necessarily reflect the
views of the International Organization for Migration (IOM). The designations employed and the
presentation of material throughout the report do not imply the expression of any opinion
whatsoever on the part of IOM concerning the legal status of any country, territory, city or area,
or of its authorities, or concerning its frontiers or boundaries.

IOM is committed to the principle that humane and orderly migration benefits migrants and
society. As an intergovernmental organization, IOM acts with its partners in the international
community to assist in meeting the operational challenges of migration, advance understanding
of migration issues, encourage social and economic development through migration and uphold
the human dignity and well-being of migrants.

Please send any feedback, comments and suggestions related to the Covid-19 Mobility
Tracking dashboards and outputs to the DTM Covid-19 Team at dtmcovid19@iom.int

© 2021 International Organization for Migration (IOM)

All rights reserved. No part of this publication may be reproduced, stored in a retrieval
system, or transmitted in any form or by any means, electronic, mechanical, photocopying,
recording, or otherwise without the prior written permission of the International
Organization for Migration (IOM).

COVER PHOTO:
© Natalie Oren - IOM Nigeria 2021

Since July 2020, amid the COVID-19 pandemic, IOM has lead the provision of COVID-19 related
health services in 19 countries to United Nations staff and their families so that they can
continue to work where they are needed.

In Abuja, Nigeria, services provided include testing for COVID-19, management of COVID-19
patients and isolation facilities, mental health and psychosocial support and referral for a
higher-level of care, including hospitalization and medical evacuation where needed.

                                                               IOM COVID-19: Impact on Points of Entry Bi-Weekly Analysis | 2022

                                                                                                                                   1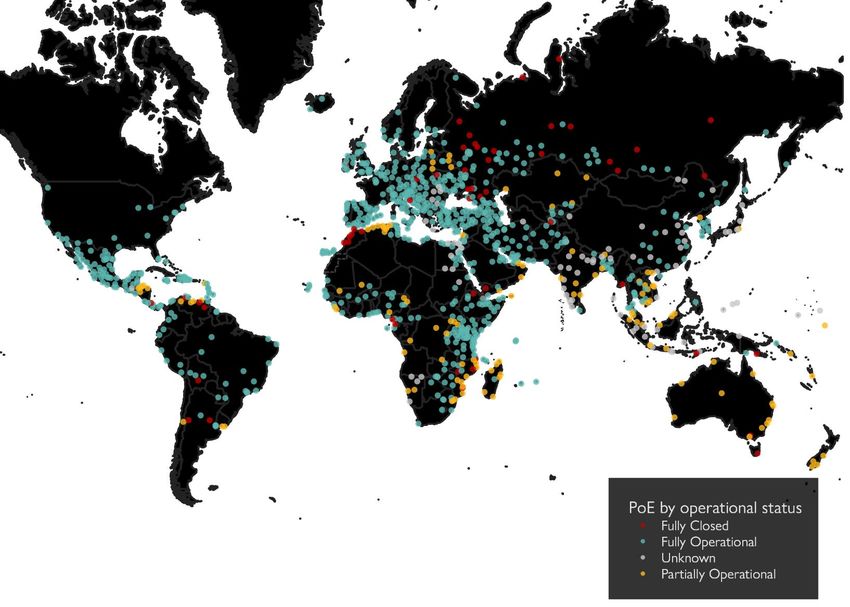
TABLE OF CONTENTS

EXECUTIVE SUMMARY                                                               3
METHODOLOGY & DEFINITIONS                                                       5

        1. PoE SCOPE AND COVERAGE: NUMBERS AT A GLANCE                          6
        2. OVERVIEW OF AIRPORTS                                                 7
        3. OVERVIEW OF BLUE BORDER CROSSING POINTS                              8
        4. OVERVIEW OF LAND BORDER CROSSING POINTS                              9

ANNEX                                                                         10

                                             IOM COVID-19: Impact on Points of Entry Bi-Weekly Analysis | 2022

                                                                                                                 2
Executive summary

The current COVID-19 pandemic has affected global mobility both in terms of international mobility restrictions and restrictive
measures on internal movement. To better understand how COVID-19 affects global mobility, IOM has developed a global mobility
database to gather, map and track data on these restrictive measures impacting movement. The information in this report relies on
a compilation of inputs from multiple sources, including from IOM staff in the field, DTM reports on flow monitoring and mobility
tracking.

Points of Entry (PoEs):

•   As of 6 January 2022, a total of 4,602 PoEs were assessed in 187 C/T/As: 1,087 (24%) airports, 2,730 (59%) land border crossing
    points and 785 (17%) blue border crossing points.

•   Overall, 10 per cent of the assessed PoEs were fully closed (no change compared to the previous reporting period), 22 per cent
    partially operational (no change compared to the previous reporting period) and 60 per cent fully operational (no change
    compared to the previous reporting period), however the operational status of PoEs varied across IOM Regions and PoE types:
          o The IOM Region with the highest share of fully closed PoEs was South-Eastern Europe, Eastern Europe and Central Asia
              (13%, i.e. no change compared to the previous reporting period), followed by European Economic Area (6%, i.e. a 4 p.p.
              decrease compared to the previous reporting period), Central and West Africa (15%, i.e. a 5 p.p. increase compared to
              the previous reporting period) and Asia and the Pacific (11%, i.e. no change compared to the previous reporting
              period);
          o Central and North America and the Caribbean was the IOM Region with the highest percentage of fully operational
              PoEs (91%, i.e. a 1 p.p. increase compared to the previous reporting period), followed by the European Economic Area
              (80%, no change compared to the previous reporting period), East and Horn of Africa (74%, no change compared to
              the previous reporting period), South-Eastern Europe, Eastern Europe and Central Asia (57%, i.e. no change compared
              to the previous reporting period), and Middle East and North Africa (56%, i.e. a 4 p.p. increase compared to the
              previous reporting period).
          o About 12 per cent of the assessed land border crossing points, globally, were fully closed (a 1 p.p. increase compared to
              the previous reporting period). For airports and blue border crossing points this percentage was reported as 6 and 8
              per cent, respectively (no change compared to the previous reporting period).
          o The share of fully operational locations remained stable for airports (71%, no change compared to the previous
              reporting period), while it slightly decreased for land border crossings points (56%, a 1 p.p. decrease compared to the
              previous reporting period) and slightly increased for blue border crossing points (54%, a 1 p.p. increase compared to
              the previous reporting period).

                                                                                 IOM COVID-19: Impact on Points of Entry Bi-Weekly Analysis | 2022

                                                                                                                                                     3
Methodology & Definitions
To better understand and capture how COVID-19 affects global mobility, IOM has developed a global database used to map, track
and analyse the impact the pandemic is having on Points of Entry (PoEs) and other key points and locations of internal mobility. This
system for data collection and analysis, which has been operational since March 2020, is called Mobility and Restrictions Mapping
(MRM) and was developed in phases responding to the evolution of the pandemic and the resulting restrictiveness at points of
entry and locations of internal mobility. Until the end of August the system was in phase two and was composed of components,
called modules, tailored to capture different information. This included modules for mapping PoE operational status and measures,
as well as other modules related to observations at key locations of internal mobility. Modules related to internal mobility captured
information on general COVID-19 measures within country contexts, internal mobility restrictions, the situation at in-country transit
points and areas such as cities and provinces that have specific COVID-19 measures in place which may differ from those imposed at
country level, and sites and locations with populations of interest (stranded foreigners/migrants and or internally displaced persons
whose mobility was impacted due to COVID-19 measures).
Since the beginning of September 2020, phase three of the MRM is based on gradual improvements as well as on recommendations
provided by users and key stakeholders. It is aimed at establishing a Global PoE Reference Database-master list, used as a baseline
for other assessments. This will be a comprehensive list of all official PoEs worldwide and will expand on the original PoE module to
capture information on the official and operational status of observed PoEs (airports, blue border crossing points and land border
crossing points). It will be implemented in all countries, territories and areas currently captured in the database but will aim to
reach every country in the world and all PoEs. All data collected through previous versions of the module since March 2020 will
continue to be updated regularly.
Through phase three, data collected for key locations of internal mobility (in countries, areas or sites with populations of interest)
will continue to be collected and processed through the existing modules and will continue to be functional in the improved version
of the MRM system.
The Points of Entry Bi-Weekly Analysis report and the Key Locations of Internal Mobility Monthly Analysis report serve to present an
overview of these COVID-19 related changes observed at the assessed airports, blue border crossing points, land border crossing
points, as well as at internal transit points, and other key locations of internal mobility.
The IOM COVID-19 Impact on Points of Entry Bi-Weekly Analysis is meant to serve IOM Member States, IOM, UN and voluntary
partner agencies, the civil society, including media, as well as the general population in analysing the impact of COVID-19 pandemic
on PoEs. It is particularly relevant when identifying and addressing specific needs faced by migrants and mobile populations,
disproportionately affected by the global mobility restrictions.
The report is based on information provided by IOM field staff, using resources available at the IOM country office level and is
accurate to the best of IOM’s knowledge at the time of compilation. All information is being constantly validated, including the geo-
location and attributes, and through regular assessments and triangulation of information. The updates depend on the time frame
within which the information becomes available and is processed by IOM. For this reason, the analysis is always dated and
timestamped in order to reflect the reality at a given time. However, as the situation continuously evolves and changes, despite
IOM’s best efforts, the analysis may not always accurately reflect the multiple and simultaneous restrictive measures being imposed
at a specific location.
This report provides an overview and analysis on the data from a global and regional perspective of PoEs. For more detailed
country-specific information and dataset used for the analysis please visit: https://migration.iom.int/
IOM COVID-19: Impact on Points of Entry Bi-Weekly Analysis | 2022
4Methodology & Definitions
As the situation of the COVID-19 pandemic continues to evolve, the resulting restrictive measures issued to mitigate the spread,
have become increasingly complex and varied. The IOM database monitoring the impact on points of entry has been updated in a
way which reflects the varied stages of measures issued at different times by countries, territories or areas. As such, the evolution
of global restrictive measures, has resulted in varied update timelines and can explain the difference in monthly updates. Data has
been collected between 13 March 2020 and 6 January 2022. Data for 57 per cent of the PoEs have been updated since the
beginning of December, with 32 per cent of the PoEs have been updated during the month of November, 1 per cent in October, 3
per cent in September and 4 per cent in August. For more information see Table 1.2 in the Annex.
For further information on the methodology, definitions and explanation please refer to the Methodology Framework.
Regional maps are available here.
Data is collected on the following location types:
• Airports (currently or recently functioning airport with a designated International Air Transport Association (IATA) code)
• Blue Border Crossing Points (international border crossing point on sea, river or lake)
• Land Border Crossing Points (international border crossing point on land, including rail)
The following operational status is captured for each assessed PoE:
• Fully operational:
• Open for entry and exit: all travelers can use the PoE.
• Partially operational:
• Open for commercial traffic only: only transport of goods is permitted, travelers are not allowed to cross;
• Closed for entry: travelers cannot use this location to enter the country, territory or area;
• Closed for exit: travelers cannot use this PoE to leave the country, territory or area;
• Open for returning nationals and residents only: the PoE is open to returning nationals and residents only, including
military and humanitarian personnel and other special groups for whom entry and exit is permitted according to
national procedures in place.
• Fully closed:
• Closed for both entry and exit: no one is permitted to use the PoE.
• Unknown
List of acronyms used throughout the report
• C/T/As: countries, territories or areas
• DTM: Displacement Tracking Matrix
• IBM: Immigration and Border Management
• IDPs: Internally Displaced Persons
• MRM: Mobility and Restrictions Mapping
• PoE: Point of Entry
• p.p.: Percentage Point1
• SOPs: Standard Operating Procedures
Data is geographically aggregated by IOM Regional Offices. The list of countries under each IOM Regional Office can be found
here: https://www.iom.int/regional-offices
1. Not to be confused with per cent, percentage point (p.p.) refers to an increase or decrease of a percentage rather than an increase or decrease in the raw number.
IOM COVID-19: Impact on Points of Entry Bi-Weekly Analysis | 2022
51. PoE Scope and Coverage: Numbers at a glance
4,602 187
Assessed Points of Entry Assessed C/T/As
To better understand how COVID-19 has affected the various travel restrictions and disruptions hampering global mobility, this report
looks at IOM’s global mobility database to map and gather data on the locations, status and different restrictions at PoEs globally,
including airports, blue border crossing points and land border crossing points.
The IOM COVID-19 Impact on Points of Entry Bi-Weekly Analysis report provides an overview and analysis on the data from a global
and regional perspective, using data updated as of 6 January 2022.
IOM has assessed 4,602 total PoEs in 187 countries, territories and areas, so far. Of these PoEs, 2,730 (59%) were land border
crossing points, 1,087 (24%) were airports and 785 (17%) were blue border crossing points (sea-, river and lake ports). More details
can be found in Table 1 in the Annex.
Of all assessed PoEs, 10 per cent were reported as fully closed and 59 per cent were reported to be fully operational. Another 22 per
cent were partially operational. At the regional level, Central and West Africa was the region with the highest percentage of fully
closed assessed PoEs (15% out of 587), followed by South-Eastern Europe, Eastern Europe and Central Asia (13% out of 910).
Conversely, Central and North America and the Caribbean (3% out of 434), East and Horn of Africa (6% out of 381), and South America
(6% out of 127) were the regions with the lowest percentage of fully closed assessed PoEs. More details can be found in the Annex, in
Table 1 and 2.
Global map of assessed PoEs and their operational status
Disclaimer: This map is for illustration purpose only. The boundaries and the names shown and
the designations used on this map do not imply official endorsement or acceptance by IOM.
IOM COVID-19: Impact on Points of Entry Bi-Weekly Analysis | 2022
62. Overview of Airports
IOM assessed 1,087 airports in 183 countries, territories and areas. Of the assessed airports, 6 per cent or 64 airports were
reported to be fully closed (no change compared to the previous report). Airports with partially operational status were reported
for 14 per cent or 150 airports (a 2 p.p. increase compared to the previous report). For 71 per cent (774 airports) of the assessed
airports, the operational status was reported to be fully operational (no relative change compared to the previous report).
Information was not available for the remaining 9 per cent (no change on a fortnightly basis) of assessed airports (for more details,
see Table 3 in the Annex).
Operational status at assessed airports
The IOM region that reported the highest percentage of fully closed
airports was South-Eastern Europe, Eastern Europe and Central Asia (31 out Fully closed Partially operational
of 202, 15% of the total, no change over the previous update), followed by Fully operational Unknown
South America (6 out of 48, 13% of the assessed airports in the region, no
change compared to the previous report) and Middle East and North Africa
(7 out of 80, 9% of the total, i.e. a 1 p.p. decrease compared to the previous
9% 6%
report).
14%
Conversely, the European Economic Area (93% of the total or 188 out of
203 fully operational airports, no change compared to the previous report
and the East and Horn of Africa (91% of fully operational airports, 73 out of
80, no change over the previous update), and Central and North America
and the Caribbean (91% of fully operational locations, 115 out of 126 i.e. no
71%
change compared to the previous report) remained the regions with
the highest proportion of fully operational airports.
Global map of assessed airports and their operational status
Disclaimer: This map is for illustration purpose only. The boundaries and the names shown and the
designations used on this map do not imply official endorsement or acceptance by IOM.
IOM COVID-19: Impact on Points of Entry Bi-Weekly Analysis | 2022
73. Overview of Blue Border Crossing Points
(sea-, river and lake ports)
IOM assessed a total of 785 blue border crossing points in 124 countries, territories and areas. The operational status of the
assessed blue border crossing points varied slightly in the past two weeks. Eight per cent were reported to be fully closed (no
change compared to the previous report), while the portion of partially operational blue border crossing points was reported at
30 per cent (a 1 p.p. increase compared to the previous reporting period). Finally, 54 per cent of the locations were reported as
fully operational (a 1 p.p. increase compared to the previous report). Information was not available for eight per cent of the
locations (for more details, see Table 3 in the Annex).
Operational status at assessed blue border
The European Economic Area was the IOM region with the highest share of crossing points
fully closed blue border crossing points (32 out of 149, 21% of the total, i.e.
no change on a fortnightly basis), followed by Central and North America
and the Caribbean (6 out of 45, 13% of the total, no change compared to Fully closed Partially operational
the previous report) and Southern Africa (4 out of 49, 8% of the total, i.e. no Fully operational Unknown
change compared to the previous reporting period). East and Horn of Africa
represented the IOM region with the highest share of fully operational blue
border crossing points with 77 fully operational locations out of the 88 8% 8%
assessed blue border crossing points in the region (88% of the total, no
change compared to the previous report). The region with the second
highest share of fully operational blue border crossing points was Central 30%
and West Africa, with 75 per cent or 63 out of 84 ports reported as fully
operational, followed by European Economic Area (111 out of 149, 74% of
the total, i.e. no change compared to the previous report) and Central and 54%
North America and the Caribbean (28 out of 45, 62% of the total, i.e. a 2
p.p. increase compared to the previous report).
Global map of assessed blue border crossing points and their operational status
Disclaimer: This map is for illustration purpose only. The boundaries and the names shown and the
designations used on this map do not imply official endorsement or acceptance by IOM.
IOM COVID-19: Impact on Points of Entry Bi-Weekly Analysis | 2022
84. Overview of Land Border Crossing Points
Among the 2,730 assessed land border crossing points in 139 countries, territories or areas, the fully closed and partially
operational made up 12 and 24 per cent of the total, respectively, while 56 per cent of the assessed locations were fully
operational without any restriction. The operational status of the remaining eight per cent was unknown. Compared to the
previous report, a decrease of 1 p.p. was recorded in fully operational land border crossing points, with a contemporaneous
increase of 1 p.p. recorded in both partially operational and fully closed land border crossing points (for more details, see Table 3
in the Annex).
Asia and the Pacific (54 out of 244, 22%, i.e. no change compared to the Operational status at assessed land bord
previous reporting period) and Central and West Africa (79 out of 449, 18%, crossing point
a 6 p.p. increase over the previous report), South-Eastern Europe, Eastern
Europe and Central Asia (87 out of 584, 15%, i.e. no change compared to
the previous report) were the IOM regions reporting the highest share of Fully closed Partially operational
fully closed land border crossing points. Other IOM regions with a
Fully operational Unknown
significant proportion of fully closed land border crossing points include
Middle East and North Africa (13 out of 128, 10% of the total, i.e. a 3.p.p
decrease compared to the previous report) and European Economic Area
(54 out of 553, 10%, no change compared to the previous reporting period).
8% 12%
The highest percentage of fully operational land border crossing points
among IOM regions was recorded in Central and North America and the
Caribbean (251 out of 263, 95% of the total, i.e. no change compared to the 24%
previous report), followed by the European Economic Area (426 out of 553,
77%, no change compared to the previous reporting period), East and Horn
of Africa (132 out of 213 locations, 62% of the total, i.e. no change 56%
compared to the previous report), and Middle East and North Africa (72 out
of 128, 56%, i.e. a 3 p.p. increase compared to the previous report).
Global map of assessed land border crossing points and their operational status
IOM COVID-19: Impact on Points of Entry Bi-Weekly Analysis | 2022
9Annex: Tables
Table 1: Number (#) and percentage (%) of assessed Points of Entry by type and IOM region
Land border Blue border No. of
Total Airports
Region crossing points crossing points C/T/A
# % # % # % # % #
Asia and the Pacific 657 100% 232 35% 244 37% 181 28% 39
Central and North America and
the Caribbean
434 100% 126 29% 263 61% 45 10% 23
West and Central Africa 587 100% 53 9% 450 77% 84 14% 23
East and Horn of Africa 381 100% 80 21% 213 56% 88 23% 9
European Economic Area 905 100% 203 22% 553 61% 149 16% 31
Middle East and North Africa
263 100% 80 30% 128 49% 55 21% 17
South America 127 100% 48 38% 69 54% 10 8% 10
South-Eastern Europe, Eastern
Europe and Central Asia 910 100% 202 22% 584 64% 124 14% 20
Southern Africa 338 100% 63 19% 226 67% 49 14% 15
Total 4602 100% 1087 24% 2730 59% 785 17% 187
*Table 1.2: Percentage of update of PoE data by month
August August 2021 September September October 2021
Location Type October 2021
2021 (%) 2021 2021 (%) (%)
Airport 26 2% 29 3% 2 0%
Blue border crossing point 21 3% 87 11% 14 2%
Land border crossing point 147 5% 24 1% 34 1%
Total 194 4% 140 3% 50 1%
November November December December
Location Type Total Total (%)
2021 2021 (%) 2021 2021 (%)
Airport 399 37% 614 56% 1087 100%
Blue border crossing point 208 26% 452 58% 785 100%
Land border crossing point 880 32% 1575 58% 2730 100%
Total 1487 32% 2641 57% 4602 100%
*For illustration and readability purposes, the columns for the period June 2020 – June 2021 were not included as all of them did
not had a PoE update, except 10 Land border crossing points (Annex: Tables
Table 2: Number (#) and percentage (%) of assessed PoEs by operational status and IOM region
Partially
Fully closed Fully operational Unknown Total
operational
Region
# % # % # % # % #
Asia and the Pacific 71 11% 278 42% 140 21% 168 26% 657
Central and North America and the
Caribbean 13 3% 20 5% 394 91% 7 2% 434
West and Central Africa 87 15% 183 31% 306 52% 11 2% 587
East and Horn of Africa 22 6% 34 9% 282 74% 43 11% 381
European Economic Area 89 10% 10 1% 725 80% 81 9% 905
Middle East and North Africa 23 9% 75 29% 147 56% 18 7% 263
South America 8 6% 63 50% 54 43% 2 2% 127
South-Eastern Europe, Eastern Europe
and Central Asia 119 13% 225 25% 523 57% 43 5% 910
Southern Africa 26 8% 142 42% 166 49% 4 1% 338
Total 458 10% 1030 22% 2737 59% 377 8% 4602
Table 3: Number (#) and percentage (%) of assessed PoEs by operational status and type
Partially
Fully closed Fully operational Unknown Total
operational
Location Type
# % # % # % # % #
Airport 64 6% 150 14% 774 71% 0 0% 1087
Blue border crossing point 65 8% 234 30% 423 54% 0 0% 785
Land border crossing point 329 12% 646 24% 1540 56% 0 0% 2730
Total 458 10% 1030 22% 2737 59% 0 0% 4602
IOM COVID-19: Impact on Points of Entry Bi-Weekly Analysis | 2022
11You can also read