Jemena Electricity Networks (Vic) Ltd - 2021-26 Electricity Distribution Price Review - Revised Proposal
←
→
Page content transcription
If your browser does not render page correctly, please read the page content below

Jemena Electricity Networks (Vic) Ltd
2021-26 Electricity Distribution Price Review -
Revised Proposal
Attachment 04-01
Response to the AER's draft decision - Capital expenditure

Public—3 December 2020
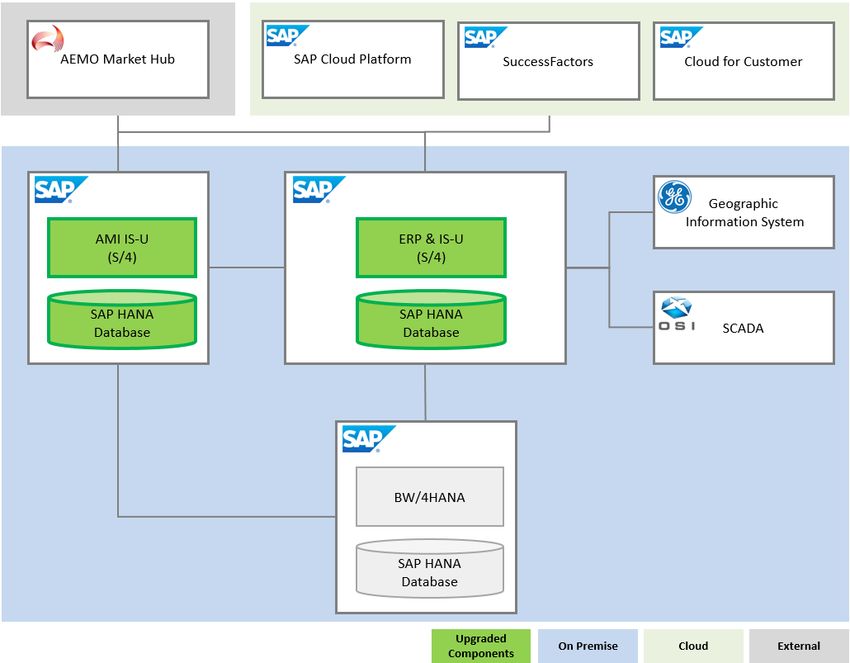
TABLE OF CONTENTS

Table of contents

Glossary.................................................................................................................................................................... iii
Abbreviations ........................................................................................................................................................... iv
Overview ....................................................................................................................................................................v
1.        Replacement expenditure ...............................................................................................................................1
2.        Connections expenditure ...............................................................................................................................4
          2.1       Effect of COVID-19 on connections expenditure ......................................................................................5
3.        Augmentation expenditure ........................................................................................................................... 12
          3.1       Effect of COVID-19 on traditional augmentation expenditure.................................................................. 14
          3.2       Compliance with REFCL obligations for Coolaroo zone substation ......................................................... 20
          3.3       Compliance with REFCL obligations for Kalkallo zone substation........................................................... 22
4.        DER integration expenditure ........................................................................................................................ 24
5.        Non-network expenditure ............................................................................................................................. 32
6.        Capitalised overheads .................................................................................................................................. 34

List of appendices
Appendix A SAP IS-U (AMI) strategy overview

                                                                                  Public—3 December 2020 © Jemena Electricity Networks (Vic) Ltd                                   ii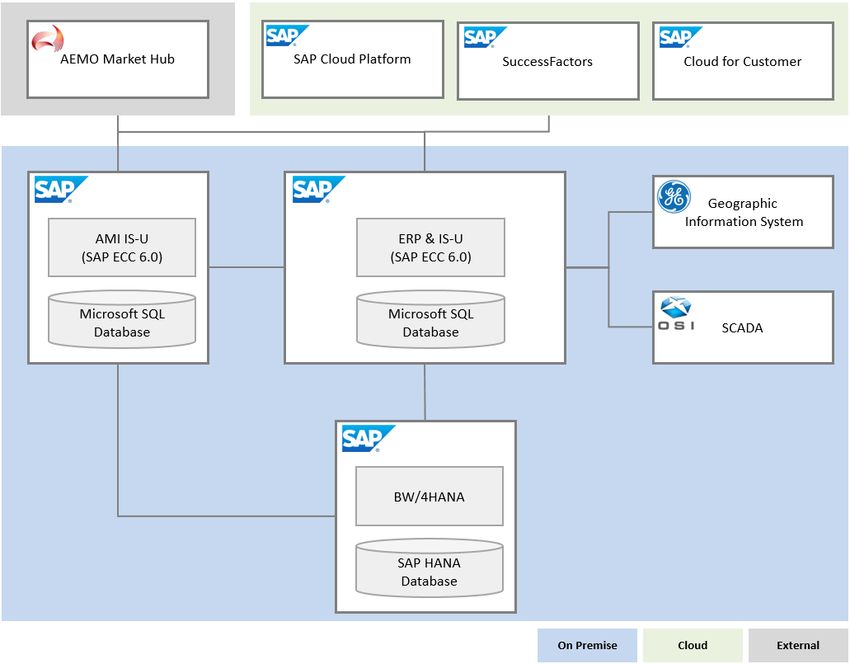
GLOSSARY

Glossary
ES Act                   Electricity Safety Act 1998
ES Regulations           Electricity Safety (Bushfire Mitigation) Regulations 2013
Initial proposal         JEN’s initial regulatory proposal to the AER submitted on 31 January 2020 for
                         the setting of regulated prices for the next regulatory period
Jemena                   Jemena is the corporate group entity that owns Jemena Electricity Networks
                         (Vic) Ltd.
Next regulatory period   The regulatory period commencing 1 July 2021 and concluding 30 June 2026
Required capacity        The prescribed performance standards of polyphase electric lines for bushfire
                         mitigation purposes, as defined in the Electricity Safety (Bushfire Mitigation
                         Duties) Regulations 2017

                                                Public—3 December 2020 © Jemena Electricity Networks (Vic) Ltd   iii
ABBREVIATIONS
Abbreviations
ACIF Australian Construction Industry Forum
AER Australian Energy Regulator
AMI Advanced Metering Infrastructure
CCP17 Consumer Challenge Panel - Sub-panel 17
COO Coolaroo zone substation
CPI Consumer Price Inflation
CRM Customer Relationship Management
CSIRO Commonwealth Scientific and Industrial Research Organisation
DELWP Department of Energy, Land, Water and Planning
ERP Enterprise Resource Platform
ESC Essential Services Commission of Victoria
ESV Energy Safe Victoria
FY Financial Year1
GVE Greenvale zone substation
HBRA Hazardous Bushfire Risk Area
HIA Housing Industry Association
HV High Voltage
ICT Information & Communications Technology
IS-U Industry Specific – Utility
JEN Jemena Electricity Networks (Vic) Ltd
JGN Jemena Gas Networks (NSW) Ltd
KLO Kalkallo Zone Substation
LBRA Low Bushfire Risk Area
LV Low Voltage
MEC Major Electricity Company
NSP Network Service Provider
REFCL Rapid Earth Fault Current Limiter
WPI Wage Price Inflation
1
When expressing the financial year, we follow the initials with a two year digit code. The two digits represent the latest year that straddled
the annual period. For example, the financial year 1 July 2021 to 30 Jun 2022 is represented as FY22.
Public—3 December 2020 © Jemena Electricity Networks (Vic) Ltd ivOVERVIEW
Overview
This document sets out our response to the Australian Energy Regulator’s (AER) draft decision on Jemena
Electricity Networks (Vic) Ltd’s (JEN) forecast capital expenditure for Standard Control Services during the 2021-
26 regulatory period (next regulatory period). It also sets out our revised capital expenditure forecast.
We welcome the AER’s draft decision on our capital expenditure. The AER was generally satisfied that our
forecast reflected the capital expenditure criteria.2 The AER’s top-down and bottom-up category analysis taken
together found our proposed capital expenditure in aggregate to be prudent and efficient, subject to adjustments
to connections and cost escalation due to the unforeseen impacts of COVID-19 and an adjustment to our Rapid
Earth Fault Current Limiter (REFCL) program.3
We also welcome the acknowledgement in the draft decision of the preferences and concerns of our customers
and stakeholders in relation to our capital expenditure.4 This reinforces the central role our customers’ feedback
and preferences played in the development of our capital expenditure forecast—which we designed to respond
to four objectives, shown below.
Objectives for our capital expenditure forecast
Meet customers’ expectations that we should maintain our current levels of network reliability (including the
frequency and duration of outages) at the most efficient cost over the long term
Manage safety, environmental, physical security and cybersecurity risks to as low as practicable and comply with
all applicable regulatory obligations at the most efficient cost over the long term
Connect new customers to our network and meet the changing energy needs of existing customers, ensuring we
can meet or manage expected demand for all customers at the least cost over the long term
Efficiently minimise any constraints on grid exports from distributed energy resources (DER) to the extent
possible.
Our revised forecast
Our revised capital expenditure forecast substantially adopts the draft decision’s amounts in most areas, while
also incorporating new information for a small number of specific matters. Our forecast capital expenditure for the
next regulatory period is $626M net ($769M gross), which represents a 3.9 per cent increase from the draft
decision and a 0.2 per cent decrease from our 2021-26 initial regulatory proposal (initial proposal). Key changes
between our initial proposal, the draft decision and our revised proposal capital expenditure forecasts are shown
in Figure OV–1.
2
AER, Draft decision: Jemena Distribution determination 2021 to 2026, Attachment 5 – Capital expenditure, September 2020, p. 5-6.
3
AER, Draft decision: Jemena Distribution Determination 2021 to 2026, Overview, September 2020, p. 8.
4
AER, Draft decision: Jemena Distribution determination 2021 to 2026, Attachment 5 – Capital expenditure, September 2020, pp. 5-10
– 5-11 and AER, Draft decision: Jemena Distribution determination 2021 to 2026, Attachment 5 – Capital expenditure, September 2020,
p. 5-24.
Public—3 December 2020 © Jemena Electricity Networks (Vic) Ltd vOVERVIEW
What our revised proposal means for our customers
Our revised proposal’s capital expenditure forecast reflects the prudent and efficient expenditure we require to deliver
the services and outcomes that our customers have told us they expect, both now and over the long-term. Specifically,
this includes:
allowing us to maintain our current network service levels at an efficient cost over long term
efficiently addressing and minimising DER constraints in line with the clear expectations of our customers
responding to customers’ affordability concerns by reflecting lower costs of complying with mandatory bushfire
mitigation obligations in the Coolaroo area under our revised approach.
Figure OV–1: How our revised proposal capital expenditure compares (5 years, $ June 2021, millions)
The draft decision raised two main issues in relation to our capital expenditure forecast—the potential effects of
COVID-19 and changes to our REFCL program—both of which we have addressed in our revised proposal.
Our initial proposal was prepared before COVID-19 emerged and accordingly did not factor in its impacts. We
have since considered the potential effects of COVID-19 on our connections and demand-driven augmentation
capital expenditure. We found that, aside from the reduction to connections expenditure reflected in the draft
decision, COVID-19 is unlikely to lead to any further material changes in aggregate to our forecast connections
or augmentation expenditure. Our revised proposal forecast therefore accepts the draft decision’s forecasts for
these categories.
Additionally, we have updated our capital expenditure forecast to:
• reflect the outcomes of an exemption we pursued in relation to bushfire mitigation (including REFCL)
obligations at Coolaroo zone substation, allowing for a lower cost solution for this project.
Public—3 December 2020 © Jemena Electricity Networks (Vic) Ltd viOVERVIEW
• incorporate externally-driven changes to our approach to complying with bushfire mitigation obligations for
Kalkallo zone substation
• make relatively minor updates to our non-network and DER integration forecasts to reflect matters noted in
the draft decision
• reflect the AER’s standard approach to real cost escalation, consistent with our operating expenditure
forecast.5
The key decision items outlined in the AER’s draft decision and our responses to each of these are summarised
in Table OV–1, with Table OV–2 and Table OV–3 presenting our revised capital expenditure forecast. The
remainder of this document details our responses to the draft decision and our revised capital expenditure
forecasts in relation to the six capital expenditure categories set out in the draft decision. Unless otherwise stated,
dollar figures throughout this document are expressed in real June 2021 dollars, exclusive of overheads.
Table OV–1: Key elements of the AER’s draft decision
Issue AER positions JEN response
Replacement Accept initial proposal Accept draft decision
expenditure
Connections Accept initial proposal, subject to negative Accept draft decision’s adjustment
expenditure adjustment for impact of COVID-19 methodology with data to be updated; no
further material downward impact on net
expenditure
Augmentation Traditional augmentation expenditure – Traditional augmentation expenditure –
expenditure accept initial proposal, with COVID-19 accept draft decision, aggregate impacts of
impacts to be reconsidered COVID-19 on our forecast are not material
REFCL augmentation expenditure – REFCL augmentation expenditure – new
information to be updated information and forecast provided
DER integration Accept initial proposal, noting stakeholder We have considered the impacts of a wide
expenditure concerns around distributed energy range of DER benefit values, and confirm
resources valuation our program is in customers’ long-term
interests. We have accepted the draft
decision forecast, with two minor additions to
reflect some of the activities previously
included in our operating expenditure step
change
Non-network expenditure Accept initial proposal, noting one non- Accept draft decision, along with addition of
network IT project was excluded from our one previously omitted non-network IT
initial proposal forecast project
Capitalised overheads Accept JEN’s methodology, forecast updated Maintain methodology, forecast updated for
for changes in direct capital expenditure changes in direct capital expenditure
Real cost escalation Modelling adjustments to real cost escalation Updated to reflect AER’s standard approach
to reflect Deloitte forecasts, consistent with by including average of Deloitte and BIS
the AER’s operating expenditure draft Oxford Economics forecasts, consistent with
decision. Final decision to adopt AER’s our approach used in our operating
standard approach (average of two expenditure forecast
consultant forecasts)
5
Our updates to real price escalation are discussed further in section 3.1.1.2 of Attachment 05-01 to our revised proposal.
Public—3 December 2020 © Jemena Electricity Networks (Vic) Ltd viiOVERVIEW
Table OV–2: How our revised proposal capital expenditure forecast compares (5 years, $ June 2021, millions)
Capital expenditure category Initial Proposal Draft Decision Revised Proposal
Replacement 210.9 208.4 211.1
Connections 218.0 198.0 199.1
Augmentation 133.7 124.0 131.8
DER integration 28.5 28.2 30.4
Non-network 98.2 97.7 106.6
Capitalised overheads 91.2 89.0 90.1
Gross capital expenditure 780.5 745.4 769.1
Capital contributions (153.0) (142.6) (142.6)
Asset disposals (0.5) (0.5) (0.5)
Net capital expenditure 627.1 602.3 625.9
Table OV–3: Our annual revised proposal capital expenditure forecast by category ($ June 2021, millions)6
Capital expenditure category FY22 FY23 FY24 FY25 FY26 Total
Replacement 46.1 41.1 40.3 41.1 42.5 211.1
Connections 26.9 41.6 43.9 45.3 41.4 199.1
Augmentation 35.4 49.6 24.8 15.0 6.9 131.8
DER integration 5.6 4.0 8.5 7.1 5.2 30.4
Non-network 34.0 22.8 19.6 19.7 10.4 106.6
Capitalised overheads 17.8 19.1 18.1 17.8 17.3 90.1
Gross capital expenditure 165.8 178.2 155.2 146.0 123.9 769.1
Capital contributions (22.0) (29.8) (30.7) (30.6) (29.5) (142.6)
Asset disposals (0.2) (0.1) (0.1) (0.1) (0.1) (0.5)
Net capital expenditure 143.6 148.4 124.4 115.3 94.3 625.9
6
Equity raising costs are not shown in this table. Equity raising costs are transaction costs that we incur when we raise equity. JEN
recognises equity raising costs as capital expenditure within the Post Tax Revenue Model (PTRM) and amortises these costs over the
life of the assets that they are used to fund. The AER has applied a benchmark approach in its recent regulatory decisions for determining
costs for raising equity through dividend reinvestment plans and seasoned equity offerings. These costs have been forecast using the
AER’s approach contained in the PTRM included in our revised proposal.
Public—3 December 2020 © Jemena Electricity Networks (Vic) Ltd viiiOVERVIEW
Supporting material
Additional information provided in support of JEN’s revised proposal capital expenditure forecast is outlined in
Table OV–4.
Table OV–4: Additional documents supporting this submission
Document reference Document title
Attachment 04-01 Response to the AER's Draft Decision - Capital Expenditure
Attachment 04-02 Future Grid Investment Proposal (Addendum)
Attachment 04-03 Network Development Strategy – Comply with Bushfire Mitigation Obligations at
Coolaroo Zone Substation
Attachment 04-04 Coolaroo and Greenvale Bushfire Mitigation Obligation Compliance Works Cost
Estimate
Attachment 04-05 Network Development Strategy – Comply with Bushfire Mitigation Obligations on
JEN KLO 22kV Feeders
Attachment 04-06 Kalkallo Bushfire Mitigation Obligation Compliance Works Cost Estimate
Attachment 04-01M Capital Expenditure Model
Public—3 December 2020 © Jemena Electricity Networks (Vic) Ltd ixREPLACEMENT EXPENDITURE — 1
1. Replacement expenditure
We need to replace existing parts of the network which have reached the end of their economic lives with their
modern equivalents (or a lesser capacity asset if possible) so that we can maintain our current levels of network
services, consistent with our customers’ expectations. We developed our replacement expenditure forecast
around the objectives set out below, as set out in our initial proposal.7
Meet customers’ expectations that we should maintain our current levels of network reliability (including the frequency
and duration of network outages) at the most efficient cost over the long term.
Manage safety, environmental, physical security and cybersecurity risks to as low as practicable and comply with all
applicable regulatory obligations at the most efficient cost over the long term.
JEN welcomes the AER’s finding that our forecast replacement expenditure reasonably reflects the capital
expenditure criteria in the context of our overall capital expenditure forecast.8 In making its draft decision on our
replacement expenditure, the AER has given appropriate consideration to a range of information and assessment
techniques, including top-down (such as Repex Modelling and trend analysis) and bottom-up (detailed business
case analysis) methodologies. Consistent with the continuous improvement attribute of our asset management
system, we acknowledge the AER’s comments in its draft decision on matters such as risk quantification and will
take these into account during the next regulatory period.
Noting the impact replacement expenditure has on our ability to meet these expectations, our customers
reaffirmed through our recent engagement that they expect us to continue to maintain our current levels of network
reliability over the long-term—and even that the COVID-19 pandemic had caused some customers to think about
their reliance on the electricity network differently:
‘It did impact on my electricity as there were often outages during the evening and I was stuck inside
with no power. I couldn't get my car out of the garage because of the electric garage door lift.’
‘My reliance on the network was even more critical at this time as I was unable to attend the office to
perform my work.’ 9
Our revised proposal’s replacement expenditure forecast is shown in Figure 1–1 and Table 1–1. Our revised
proposal for this category is unchanged from our initial proposal and the AER’s draft decision, with the exception
of minor movements due to changes in real price escalation (and which are applicable throughout our capital and
operating expenditure forecasts).
We note that our customer-initiated asset relocation expenditure during the next regulatory period may be higher
than our forecast, due to an increase in road, rail and other infrastructure projects driven by government stimulus
measures supporting the economic recovery from COVID-19—as explained in Appendix A of our 2021-26 Revised
Regulatory Proposal Overview. However, consistent with our revised proposal’s approach to connections and
augmentation capital expenditure, we do not consider that these changes are likely to be material in the context
of our aggregate net capital expenditure forecast. We have therefore accepted the AER’s draft decision values.
7
JEN, 2021-26 Electricity Distribution Price Review Regulatory Proposal – Attachment 05-01, 31 January 2020, p. 21.
8
AER, Draft decision: Jemena Distribution determination 2021 to 2026, Attachment 5 – Capital expenditure, September 2020, p. 5-16.
9
Feedback from our People’s Panel, as discussed further in Attachment 01-02.
Public—3 December 2020 © Jemena Electricity Networks (Vic) Ltd 1REPLACEMENT EXPENDITURE — 1
Figure 1–1: How our replacement expenditure compares (5 years, $ June 2021, millions)
Public—3 December 2020 © Jemena Electricity Networks (Vic) Ltd 2REPLACEMENT EXPENDITURE — 1
Table 1–1: Forecast replacement expenditure by asset group (5 years, $ June 2021, millions)
Replacement expenditure by asset group Initial Proposal Draft Decision Revised proposal
Poles 18.6 18.4 18.6
Pole top structures 25.9 25.4 25.9
Overhead conductors 12.1 11.9 12.1
Underground cables 9.4 9.3 9.5
Service lines 20.7 20.6 20.8
Transformers 13.2 13.2 13.3
Switchgear 26.0 25.7 26.0
SCADA, network control & protection systems 29.1 28.8 29.1
Protection systems 23.2 22.9 23.2
Communications 4.5 4.4 4.5
Other 1.5 1.5 1.5
Other 55.7 55.2 55.8
Customer initiated asset relocations 36.7 36.4 36.8
Emergency recoverable works 11.8 11.7 11.8
Other assets 7.2 7.1 7.2
Gross replacement capital expenditure 210.9 208.4 211.1
Capital contributions1 (35.6) (35.8) (35.8)
Net replacement capital expenditure 175.3 172.7 175.3
(1) Capital contributions apply to customer-initiated asset relocation works.
Public—3 December 2020 © Jemena Electricity Networks (Vic) Ltd 3CONNECTIONS EXPENDITURE — 2
2. Connections expenditure
We need to connect new customers to our network and augment or alter existing network connections to meet
specific customers’ needs. We developed our connections expenditure forecast to meet the objective set out
below, as set out in our initial proposal.10
Connect new customers to our network and meet the changing energy needs of existing customers, ensuring we can
meet or manage expected demand for all customers at the least cost over the long-term.
JEN welcomes the draft decision’s finding that, prior to the effects of COVID-19, our net connections capital
expenditure is reasonable from a top-down perspective. The AER’s draft decision adopted our forecast and
applied an adjustment to reduce net connections expenditure by nine per cent to account for the expected impact
of COVID-19 on forecast construction activity.11 The AER noted it would, in making its final determination, consider
whether any new information would materially affect our connections forecast.12
Although we have some reservations regarding the analysis and methodology used in the draft decision, we note
the decision was made at a time of heightened uncertainty and in a period that lacked robust external
macroeconomic forecasts which could reliably quantify the impacts of the COVID-19 pandemic. Having conducted
a detailed analysis and re-run our forecasting methodologies using recently available information, we consider
that a forecast using an alternate methodology would not be materially different from the draft decision. We
discuss this further in section 2.1.
Consistent with our approach to augmentation expenditure, our revised proposal aligns with the draft decision
except for adjustments to account for real price escalation. However, due to the timing of our revised proposal,
we were unable to update the AER’s adjustment to reflect the latest the Housing Industry Association (HIA)
forecasts,13 and we therefore request that the AER apply this updated data in its final determination. Figure 2–1
and Table 2–1 compare our initial proposal, the AER’s draft decision and our revised proposal connections
expenditure forecasts.
10
JEN, 2021-26 Electricity Distribution Price Review Regulatory Proposal – Attachment 05-01, 31 January 2020, p. 65.
11
AER, Draft decision: Jemena Distribution determination 2021 to 2026, Attachment 5 – Capital expenditure, September 2020, p. 5-28.
12
AER, Draft decision: Jemena Distribution determination 2021 to 2026, Attachment 5 – Capital expenditure, September 2020, p. 5-29.
13
Released on 19 November 2020.
Public—3 December 2020 © Jemena Electricity Networks (Vic) Ltd 4CONNECTIONS EXPENDITURE — 2
Figure 2–1: How our connections expenditure compares (5 years, $ June 2021, millions)
Table 2–1: Forecast connections expenditure by connection subcategory (5 years, $ June 2021, millions)
Customer category Initial Proposal Draft Decision Revised proposal
Residential 51.2 47.0 47.1
Commercial/industrial 111.0 99.9 100.8
Subdivision 55.8 51.1 51.3
Embedded generation - - -
Total gross connections expenditure 218.0 198.0 199.1
Capital contributions1 (117.4) (106.9) (106.9)
Net connections expenditure 100.7 91.1 92.3
(1) Does not include capital contributions for asset relocation works, which are replacement expenditure – refer to section 1.
(2) Standard control services only.
2.1 Effect of COVID-19 on connections expenditure
While expressing comfort with our underlying methodology and outputs of our connections expenditure forecast,
the draft decision reduced our forecast to account for the expected impacts of COVID-19. This adjustment was
based on HIA’s April 2020 forecasts of residential dwelling commencements. In the draft decision, the AER stated
that it would consider any new information which may materially change our connections expenditure forecast,
including updated construction forecasts for Victoria, (including those that allow distinctions to be made between
types of connection).14
As outlined in this section, our actual connections expenditure during the next regulatory period will likely be higher
than the amount reflected in the draft decision. However, consistent with our approach to augmentation and
customer-initiated asset relocations expenditure, we do not consider that an alternate forecasting approach is
likely to represent a material increase in our net capital expenditure from the draft decision, and accordingly we
have adopted the draft decision’s forecast in our revised proposal. We do, however, request that the AER update
14
AER, Draft decision: Jemena Distribution determination 2021 to 2026, Attachment 5 – Capital expenditure, September 2020, p. 5-29.
Public—3 December 2020 © Jemena Electricity Networks (Vic) Ltd 5CONNECTIONS EXPENDITURE — 2
its adjustment methodology using HIA’s November 2020 forecasts when making its final determination, as we
were unable to incorporate these into our revised proposal due to the submission timeframes.
As discussed further in Appendix A of our 2021-26 Revised Regulatory Proposal Overview, the Australian and
Victorian Governments have implemented significant measures to support the economic recovery from
COVID-19. These measures will underpin construction activity, which in turn will drive continued customer
demand for electricity connections. Key programs include:
• stimulus to encourage private residential construction investment—such as the Federal Government’s
HomeBuilder program15
• direct investment in public housing—such as the Victorian Government’s $5.3B Big Housing Build program16
• direct investment in commercial and industrial facilities—through the Federal Government’s Modern
Manufacturing Strategy17
• fast-tracking approvals for private investment—such as under the Victorian Government’s Development
Facilitation Program.18
In the months leading up to the publication of the draft decision, there was considerable uncertainty and reduced
availability of robust macroeconomic forecasts. Generally, we would consider that the HIA data used in the draft
decision may only be relevant to the residential and subdivision parts of our connection expenditure—noting that
these comprise only 29 per cent of our initial proposal’s net connections expenditure. As illustrated in Figure 2–2,
the majority of our forecast net connections expenditure relates to non-residential connections, and there is,
therefore, a risk that applying an adjustment based on residential data across our entire connections program
may not be fully reflective of the drivers of this category of expenditure. We discuss how we have separately
considered the effects of COVID-19 on our major customer and general connections expenditure forecasts in the
sections below.
15
https://treasury.gov.au/coronavirus/homebuilder
16
https://www.budget.vic.gov.au/place-call-home-victorias-big-housing-build
17
https://www.minister.industry.gov.au/ministers/karenandrews/media-releases/2020-21-budget-manufacturing-australias-future
18
https://www.planning.vic.gov.au/policy-and-strategy/development-facilitation-program
Public—3 December 2020 © Jemena Electricity Networks (Vic) Ltd 6CONNECTIONS EXPENDITURE — 2
Figure 2–2: Composition of our initial proposal’s net connections expenditure forecast
2.1.1 Major customer connection projects
Our major customer connection projects (20 per cent of our net connections expenditure) are forecast on a bottom-
up basis using the most recent information available directly from the proponents of these specific projects. As
this part of our forecast reflects specific and known customer requirements, it would not ordinarily be appropriate
to apply a top-down adjustment to these major projects based on a change in residential construction sector
outlooks. Rather, any changes to our major projects should instead reflect a change in these individual customers’
requirements.
When developing our revised proposal, we considered the impact of the most recent available customer
information on our bottom-up forecasts for our major customer connection projects. Largely due to expanded
requirements of a major government infrastructure project and the addition of a large new traction (rail) supply
project, we expect a significant increase in our gross connections expenditure from the amount we forecast in our
initial proposal. However, after accounting for the customer contributions associated with these projects, the
increase in our net connections expenditure is relatively small. We therefore consider that the amount for major
customer connection project expenditure included in the AER’s draft decision—and accepted by us—represents
a minimum level of net capital expenditure that we are likely to incur during the next regulatory period.
2.1.2 General connections
As outlined in our initial proposal, we forecast our general connections expenditure on a top-down basis using
macroeconomic and other trend data.19 While our commercial and industrial general connections projects are
forecast using the same modelling approach as residential categories, the drivers of this expenditure can differ
from the drivers of residential connections. To reflect this difference, our long-standing forecasting methodology
for general commercial and industrial connections uses forecasts of building and construction activity for certain
non-residential sectors, sourced from the Australian Construction Industry Forum (ACIF). We note that the usual
publication cycle for these forecasts was disrupted during 2020 and that ACIF forecasts incorporating the impacts
of COVID-19 only became available after the AER made its draft decision. We have considered ACIF’s updated
forecasts and their potential impact on our general connections forecast when developing our revised proposal.
19
JEN, 2021-26 Electricity Distribution Price Review Regulatory Proposal – Attachment 05-01, 31 January 2020, p. 68.
Public—3 December 2020 © Jemena Electricity Networks (Vic) Ltd 7CONNECTIONS EXPENDITURE — 2
Residential and subdivision general connections
For residential (including subdivision) construction activity in Victoria, ACIF’s November 2020 forecasts show a
rebound in activity between FY21 and FY22, followed by a period of strong growth. We also note that the recovery
timeframe shown in ACIF’s November 2020 residential forecast is broadly consistent with the assumption outlined
in the draft decision that the effects of COVID-19 on construction will have ended by July 2022.20 ACIF’s residential
construction forecasts for Victoria are illustrated in Figure 2–3.
Figure 2–3: ACIF Victorian residential sector building and construction activity
(1) Based on Australian Construction Industry Forum, Australian Construction Market Reports May 2019 and November 2020.
(2) May 2019 data has been adjusted for inflation.
Although JEN’s residential and subdivision general connections expenditure has previously been forecast using
trends in our customer numbers, we note that the similarities in the trends shown between ACIF’s pre-pandemic
(May 2019) and post-pandemic (November 2020) forecasts. These trends suggest that any further negative
adjustments to our forecast expenditure for these categories would likely lead to a material underestimation of the
efficient expenditure required to meet residential connection requests during the next regulatory period. This is
further supported by the increase in residential building approvals in Victoria seen recent months—a leading
indicator of future connections activity—as illustrated in Figure 2–4.
20
AER, Draft decision: Jemena Distribution determination 2021 to 2026, Attachment 5 – Capital expenditure, September 2020, p. 5-29.
Public—3 December 2020 © Jemena Electricity Networks (Vic) Ltd 8CONNECTIONS EXPENDITURE — 2
Figure 2–4: Victorian house dwellings approved (all sectors)
(1) Based on Australian Bureau of Statistics, Building Approvals, Australia, September 2020, ABS Cat. No. 8731.0, 1 December 2020.
Finally, we note that the August and November 2020 iterations of HIA’s dwelling start forecasts issued since the
April 2020 data used in the draft decision appear to indicate a slight softening of the impact of COVID-19 on
residential construction in Victoria, as illustrated in Figure 2–5. Taken together with the trends suggested by the
data above, we consider that the adjustment applied in the draft decision is more likely to overstate the negative
impacts of COVID-19 than to understate these effects.
Public—3 December 2020 © Jemena Electricity Networks (Vic) Ltd 9CONNECTIONS EXPENDITURE — 2
Figure 2–5: HIA Victorian total dwelling starts
(1) Based on HIA Economics, Long Term Housing Projections.
(2) Calendar years shown.
Commercial and industrial general connections
ACIF’s updated forecasts for non-residential construction subsectors continue to show a similar trend to the May
2019 forecasts we used to develop our initial proposal. These show growth plateauing (without a significant
decline in activity) from FY20, albeit at an even higher level of activity than was forecast pre-pandemic. ACIF’s
outlook for selected non-residential subsectors, which we use in our forecast, is illustrated in Figure 2–6.
Public—3 December 2020 © Jemena Electricity Networks (Vic) Ltd 10CONNECTIONS EXPENDITURE — 2
Figure 2–6: ACIF Victorian non-residential sector building and construction activity
(1) Subsectors shown are Industrial, Other Commercial and Non-residential Miscellaneous
(2) Based on Australian Construction Industry Forum, Australian Construction Market Reports May 2019 and November 2020
(3) May 2019 data has been adjusted for inflation.
Similar to residential connections, the consistency in trends between this updated outlook of non-residential
construction activity and the pre-pandemic forecasts we used to develop our initial proposal, show that COVID-19
is likely to have a very limited impact on this category of expenditure. This strongly suggests that further reductions
for COVID-19, beyond those made in the draft decision, are likely to result in our non-residential general
connections expenditure forecast being materially understated.
2.1.3 Aggregate effects
The above section shows broad consistency in forecast construction trends between ACIF’s pre-pandemic and
updated forecasts, and also notes that updated major customer connection information will have minimal impacts
on our net connections expenditure. We therefore consider that an alternative forecasting approach to reflect the
aggregate effects of COVID-19 would likely not result in a material change to our net connections expenditure
from that which the AER applied in the draft decision.
Furthermore, the results of our alternative forecasting using updated data and consideration of leading indicators
such as building approvals strongly suggest that our actual net connections expenditure during the next regulatory
period will be at or above the level included in the draft decision. This provides further support for the position that
any further reduction to our connections expenditure forecast would not be appropriate, as it would likely result in
an amount which is materially lower than the expenditure we will need to meet customer requirements next period.
In light of our similar approach to not incorporating immaterial changes to our augmentation and asset relocation
expenditure, we have therefore reflected the draft decision’s amounts in our revised proposal, with only minor
updates for real cost escalation. However, we request that the AER update its adjustment method to reflect HIA’s
November 2020 forecasts in the final determination.
Public—3 December 2020 © Jemena Electricity Networks (Vic) Ltd 11AUGMENTATION EXPENDITURE — 3
3. Augmentation expenditure
Augmentation enlarges our network and its capacity to distribute electricity or otherwise improves the quality or
capability of the distribution network. We developed our augmentation expenditure forecast21 to meet the
objectives below, as set out in our initial proposal.22
Meet or manage changes in energy demand from our customers, allowing us to maintain our current levels of network
reliability (including the frequency and length of network outages) at the most efficient cost over the long term.
Manage safety, environmental, physical security and cybersecurity risks to as low as practicable at the most efficient
cost over the long term and comply with all relevant safety and environmental obligations.
We welcome the AER’s overall conclusion that our non-DER augmentation expenditure forms part of a capital
expenditure forecast that reasonably satisfies the capital expenditure criteria, noting adjustments for our REFCL
program due to changes in our approach to these external obligations.23 The AER’s draft decision separated our
augmentation expenditure forecast into two sub-categories—‘traditional augmentation’ and ‘REFCL
augmentation’. We have adopted these sub-categories in this document for consistency with the draft decision.
For traditional augmentation, although the AER considered demand forecasts produced by the Australian Energy
Market Operator (AEMO) in 2019 as being more reasonable than JEN’s forecasts from ACIL Allen, it found our
forecast expenditure in this category was reasonable, based on high-level trend analysis.24 The AER did, however,
note the potential for COVID-19 to impact demand forecasts and augmentation expenditure, and that it would
consider this further in its final decision.25 Accordingly, in developing our revised proposal, we have assessed the
likely effects of COVID-19 on our traditional augmentation expenditure and discuss this in section 3.1.
In relation to our REFCL program, the draft decision acknowledged JEN’s application for an exemption for the
Coolaroo zone substation which would enable us to pursue a lower-cost technical solution, and therefore included
a ‘placeholder’ value (based on an indicative estimate JEN provided through the AER’s information request
process) in the draft decision, and noting that we would provide further information in our revised proposal.
Consistent with the draft decision and our ongoing engagement with the AER, we have updated our revised
proposal to reflect an amended compliance approach to Coolaroo following the granting of exemptions to JEN—
this is discussed in section 3.2.
Our revised proposal also includes expenditure necessary for JEN to comply with bushfire mitigation obligations
associated with Kalkallo zone substation, discussed in section 3.3. Additionally, we have made minor movements
to our forecast expenditure due to changes in real price escalation, consistent with the broader changes across
our capital and operating expenditure forecasts.
Figure 3–1 and Table 3–1 compare our initial proposal, the AER’s draft decision and our revised proposal
augmentation expenditure forecasts.
21
The values shown up to and including section 3 of this document exclude augmentation expenditure relating to DER integration. To
align with the categorisations used in the AER’s draft decision capital expenditure document, all DER integration expenditure is
discussed in section 4.
22
JEN, 2021-26 Electricity Distribution Price Review Regulatory Proposal – Attachment 05-01, 31 January 2020, p. 73.
23
AER, Draft decision: Jemena Distribution determination 2021 to 2026, Attachment 5 – Capital expenditure, September 2020, p. 5-26.
24
AER, Draft decision: Jemena Distribution determination 2021 to 2026, Attachment 5 – Capital expenditure, September 2020, p. 5-27.
25
AER, Draft decision: Jemena Distribution determination 2021 to 2026, Attachment 5 – Capital expenditure, September 2020, p. 5-27.
Public—3 December 2020 © Jemena Electricity Networks (Vic) Ltd 12AUGMENTATION EXPENDITURE — 3
Figure 3–1: How our augmentation expenditure compares (FY22-26, $ June 2021, millions)
Table 3–1: Forecast augmentation expenditure by driver and asset type (5 years, $ June 2021, millions)
Initial Draft Revised
Augmentation expenditure by asset type
Proposal Decision proposal
Subtransmission Substations, Switching Stations, Zone Substations 8.8 8.8 8.9
Traditional augmentation
Subtransmission Lines 15.2 15.1 15.2
HV Feeders 48.6 48.1 48.6
Distribution Substations 17.0 16.7 17.0
LV Feeders 1.0 1.0 1.0
Other assets - - -
Sub-total – traditional augmentation 90.6 89.7 90.7
Subtransmission Substations, Switching Stations, Zone Substations 35.8 28.5 17.9
REFCL augmentation
Subtransmission Lines 6.0 4.7 4.0
HV Feeders 1.3 1.0 19.2
Distribution Substations - - -
LV Feeders - - -
Other assets - - -
Sub-total – REFCL augmentation1 43.1 34.3 41.2
Total augmentation expenditure 133.7 124.0 131.8
(1) The ‘REFCL augmentation’ sub-category reflects expenditure related to JEN’s compliance with REFCL and related bushfire mitigation
obligations.
Public—3 December 2020 © Jemena Electricity Networks (Vic) Ltd 13AUGMENTATION EXPENDITURE — 3
3.1 Effect of COVID-19 on traditional augmentation expenditure
Although accepting our forecast of traditional augmentation expenditure, the draft decision states that AEMO’s
forecasts of maximum demand are more reasonable than JEN’s forecasts, developed by consultant ACIL Allen.
The AER further considers that AEMO’s updated 2020 terminal station forecasts are likely to be lower due to
COVID-19, and that it will assess whether COVID-19 would lead to a material reduction in JEN’s augmentation
expenditure when making its final decision.26
For completeness, we note that of our program assessed by the AER as traditional augmentation expenditure,
only $55 million27 relates to projects where growth in forecast maximum demand is the major driver.28 The
remaining $35 million of our traditional augmentation forecast relates to projects where growth in forecast
maximum demand is not the sole driver of the investment—these projects have a mix of drivers, some of which
are unrelated to changes in demand, such as asset condition, voltage standard conversions, supply quality and
environmental compliance.
Given the draft decision’s commentary on the potential impact of COVID-19 on forecast demand is primarily
relevant to projects where the major driver is demand, the remainder of the discussion in this section focusses on
our proposed $55 million of demand-driven augmentation expenditure.
Our revised proposal does not make any changes to our demand-driven augmentation expenditure from our initial
proposal.29 We consider that, in aggregate, COVID-19 will not lead to a material reduction in our augmentation
expenditure during the next regulatory period. We outline the importance of spatial demand diversity—which is
not shown in AEMO’s forecasts—as a driver of our augmentation expenditure in section 3.1.1, and then further
explore the potential impacts of COVID-19 on spatial demand and our augmentation program in section 3.1.2.
3.1.1 Spatial demand diversity must be considered when assessing augmentation
expenditure
Forecasts of maximum demand are typically discussed and compared at a network-wide level. However, it is
critical to recognise that we apply our probabilistic planning methodology to assess the customer supply risks and
costs of distribution network level constraints at specific locations—and therefore it is the forecast of maximum
demand at a specific location (spatial forecasts) which drive our augmentation expenditure. Our proposed
augmentation program, which covers assets at all levels of our network, cannot be assessed solely based on a
system-level forecast of demand, such as AEMO’s terminal station forecasts.
3.1.1.1 Our demand forecasting process
To inform the development of our network augmentation plans, we undertake a comprehensive demand
forecasting process, which balances top-down and bottom-up methodologies. Our forecasting process comprises
several phases involving building up spatial forecasts and then reconciling these to our externally sourced (from
ACIL Allen Consulting) top-down system forecast. These phases are summarised in Figure 3–2 and explained
further below.
26
AER, Draft decision: Jemena Distribution determination 2021 to 2026, Attachment 5 – Capital expenditure, September 2020, p. 5-27.
27
Representing approximately seven per cent of our initial proposal’s gross capital expenditure forecast.
28
AER, Draft decision: Jemena Distribution determination 2021 to 2026, Attachment 5 – Capital expenditure, September 2020, p. 5-26.
29
With the exception of minor adjustments to real cost escalation.
Public—3 December 2020 © Jemena Electricity Networks (Vic) Ltd 14AUGMENTATION EXPENDITURE — 3
Figure 3–2: Summary of our demand forecasting process
Phases 1 to 3 use local information about our customers and communities to develop spatial forecasts.
Phase 1 involves developing forecasts for each high voltage (HV) feeder, capturing recent trends in local usage
and significant additions or reductions in load based on information about changes in local customer demand,
such as new residential subdivisions and commercial and industrial development projects. During this phase, we
also consider committed load transfers resulting from feeder reconfigurations or other network projects.
Phase 2 translates information at a feeder level into zone substation demand forecasts. In this process, we
reconcile feeder demand to historical maximum demand at zone substations (including weather normalisation)
and then apply diversity factors to convert non-coincident feeder demand forecasts into zone substation peak
demand forecasts. We then adopt a similar approach in phase 3 to translate zone substation demand forecasts
into terminal station forecasts.
Phases 4 and 5 then focus on reconciling terminal station forecasts to our externally sourced system-wide
forecasts. These phases utilise diversity factors to translate terminal station forecasts into system forecasts, and
then scaling our bottom-up spatial forecasts to match the system level forecasts in aggregate. This ensures our
spatial forecasts are aligned with the macro factors—such as the economic outlook for Victoria—which are inputs
to the top-down system forecast.
Spatial demand forecasts at different levels of our network are subject to different degrees of influence by network-
wide (macro) factors and local (micro) factors. For spatial forecasts which relate to HV feeders, the influence of
local factors is greater, and the influence of the network-wide (top-down) forecast is lesser when compared to
forecasts at a zone substation or transmission connection point level, as illustrated in Figure 3–3.
Public—3 December 2020 © Jemena Electricity Networks (Vic) Ltd 15AUGMENTATION EXPENDITURE — 3
Figure 3–3: Demand forecasts are influenced differently throughout the network
3.1.1.2 Implications of spatial demand variance for augmentation expenditure
This distinction between network-wide maximum demand forecasts and spatial maximum demand forecasts is
particularly relevant for a distribution network such as JEN, given our network area covers a diverse range of
suburbs and customer types. Over the past decade, our network has seen divergent demand trends in different
locations of our network. This includes fast-growing residential and commercial loads associated with greenfield
developments in Melbourne’s north growth corridor, growth in inner suburbs due to infill or brownfield
developments, and falling maximum demand in some industrial areas as some large manufacturing customers
have shut down.
Notably, these positive and negative changes in maximum demand at a zone substation level have occurred
simultaneously—meaning that although maximum demand may appear to be flat at a network-wide level, this is
a function of offsetting increases and decreases of the same magnitude in maximum demand at a lower spatial
level within our network. Although increasing maximum demand at a particular location is a driver of augmentation
expenditure, decreases in maximum demand at another location do not result in ‘negative’ augmentation
expenditure. For this reason, the comparison of system-level demand growth and the corresponding
augmentation expenditure across regulatory control periods may underestimate required augmentation
expenditure, and should not be used as the basis for any negative adjustments to forecast expenditure. This is
because the relationship they seek to analyse may not account for changes in spatial diversity within a network
over time.
Over the next regulatory period, we expect to continue to see contrasts in maximum demand growth between
different supply areas (zone substations). In our initial proposal, we showed both areas of low growth or decline
(such as Broadmeadows and Thomastown) and areas of strong growth (such as Fairfield and North Essendon).30
Our forecast augmentation expenditure reflects this spatial diversity, with a large portion of our growth-related
augmentation relating to localised assets such as HV feeders—more so than in the current regulatory period as
is illustrated in Figure 3–4. As noted above, when compared to assets such as sub-transmission lines, the spatial
demand forecasts that determine the need for HV feeder augmentation are:
• subject to a greater degree of spatial variation than the network-wide average (i.e. they are more heavily
influenced by location-specific factors)
• subject to a lesser degree of influence by the top-down network maximum demand forecast (i.e. they are less
sensitive to changes in the top-down maximum demand forecast).
30
JEN, 2021-26 Electricity Distribution Price Review Regulatory Proposal – Attachment 05-01, 31 January 2020, pp. 79-80.
Public—3 December 2020 © Jemena Electricity Networks (Vic) Ltd 16AUGMENTATION EXPENDITURE — 3
Figure 3–4: JEN’s historical and forecast traditional augmentation expenditure by network level
Furthermore, the draft decision notes that the AER will consider whether AEMO’s 2020 transmission connection
point forecasts for JEN’s network materially differ from its 2019 forecasts.31 Even though these forecasts do not
reflect any of the spatial diversity in our network, we note that AEMO’s 2020 forecasts for JEN’s transmission
connection points32 show a material shift upward compared to its 2019 forecasts. This is likely due to the
forecasting process AEMO employs where state-wide demand is apportioned to transmission connection points
based on most recently available actual information. In addition to the issues associated with spatial diversity
discussed previously, such volatility in this forecast is a further illustration of why this information should not be
solely used to determine our distribution network augmentation requirements. As an aside, we also note that
AEMO’s 2020 forecast for our connection points shows a small positive growth trend over ten years, compared
to a small negative growth trend shown in its 2019 forecast.
Therefore, due to the significance of spatial demand diversity in driving our forecast augmentation program, and
the other limitations associated with AEMO’s transmission connection point forecasts, any top-down adjustments
to our program on the basis of system-wide or transmission connection point forecasts are unlikely to reflect an
efficient forecast of the augmentation expenditure we require to meet expected demand.
3.1.2 COVID-19 is not forecast to materially reduce our augmentation expenditure
Consistent with the draft decision, we have considered the potential effects of COVID-19 on our augmentation
expenditure when developing our revised proposal. Overall, we consider that COVID-19 will not have a material
impact on our aggregate level of augmentation expenditure during the next regulatory period. Therefore, we have
not changed our forecast from the draft decision except for minor updates to real cost escalation.
To assess the potential impacts of COVID-19 on our portfolio of demand-driven augmentation projects, we
updated our demand forecasts in line with the process outlined in section 3.1.1.1. We then used our probabilistic
network planning methodology to apply these updated demand forecasts to reassess (by considering the
individual value of load at risk in relation to each network constraint) the 18 augmentation projects contained in
31
AER, Draft decision: Jemena Distribution determination 2021 to 2026, Attachment 5 – Capital expenditure, September 2020, p. 5-27.
32
Provided by AEMO to JEN in October 2020.
Public—3 December 2020 © Jemena Electricity Networks (Vic) Ltd 17AUGMENTATION EXPENDITURE — 3
our forecast which could be sensitive to changes in forecast demand growth, consistent with the network planning
process we undertake annually.
Through this process, we found that the optimal investment timing for two of our HV feeder projects was no longer
within our next regulatory period. These projects are the reconfiguration of feeder SBY24 (Sunbury area) and the
construction of new feeder TMA15 (Tullamarine area), with a combined cost of $3.3M. Both of these projects were
planned for the later part of our next regulatory period (with the majority of expenditure to be incurred in FY24 and
FY25), and both were designed to accommodate some load from existing adjacent feeders, alleviating and
providing a greater balance in the energy at risk across these feeders. Reassessing these projects using our
updated spatial forecasts shows that although a material amount of energy at risk will continue to exist for these
local areas throughout the next regulatory period, there is likely to be a marginal lessening in the growth of these
localised risks, therefore we are able to reschedule the optimal timing of the augmentation works to FY27. We do
not consider that these two projects represent a material reduction in our demand-driven augmentation
expenditure.
Our re-assessment of the remaining 16 projects did not result in any reductions to our forecast augmentation
expenditure, with our analysis confirming that undertaking each of these projects during the next regulatory period
provides a net benefit to customers. The optimal timings of augmentation projects later in a planning period are
inherently more sensitive to changes in spatial demand forecasts (as changes in growth may compound over
time) than those planned for the near-term. However, our analysis did confirm that our other demand driven
augmentation projects planned for the second half the next regulatory period remain prudent. These projects
relate to areas such as Coolaroo, Somerton, Flemington, Fairfield and North Essendon. We have a high degree
of certainty around growth in customer loads in these areas due to major property developments and other
customer projects for which we are already seeing corresponding connections expenditure—a leading indicator
of future (shared network) augmentation requirements, as new residential loads usually take several years to fully
ramp up. This includes, for example, the commencement of construction for the redevelopment of Moonee Valley
Racecourse33 (further contributing to the significant energy at risk associated with the Brunswick Terminal Station-
North Essendon subtransmission line) and the continuation of the YarraBend development34 (a key driver of our
projects to mitigate supply risks in the Fairfield and Alphington areas).
Furthermore, we have considered the potential that structural changes in customer behaviour—and therefore
demand—may emerge throughout the next regulatory period during the recovery from COVID-19, and that these
changes could place upward pressure on our augmentation expenditure. Although there is uncertainty associated
with these changes, and their precise implications for our network augmentation program are currently difficult to
quantify, COVID-19 has already caused us to have to consider a range of new scenarios, factors and customer
behaviours as part of our network operational planning for summer 2020-21, as shown in the case study below.
Case study – Factoring COVID-19 into our distribution substation planning for summer 2020-21
Peak demand occurs for the majority of our distribution substations on days of extreme ambient temperature during
the summer period (October to March). In line with our customers’ expectations around maintaining current outage
lengths and frequency over the long-term, we routinely evaluate and assess the customer loads at risk for our
distribution substation population to ensure we have adequate operational plans and holdings of spare equipment in
place ahead of summer, and to aim to avoid an increase in the proportion of these assets which are ‘overloaded’ (i.e.
maximum demand above cyclic rating).
In previous summers, we have typically seen some residential customers reduce their demand as they travel during
the holiday period, and likewise for some businesses as they may close during the summer holiday period. Both of
these influences can have the effect of offsetting some of the upward pressure on maximum demand for certain
distribution substations, and are already factored into our demand forecasts and distribution substation augmentation
program.
However, when we undertook this exercise in preparation for summer 2020-21, we had to adopt a new scenario-
based approach, as we had no historical data on the impacts of a widespread pandemic (or the associated
government health directives) on our customers’ electricity demand. The analysis we undertook recognised that some
33
Herald Sun, Construction starts on new mini suburb in the heart of iconic sporting locale, 4 September 2020.
34
Burbank Urban, Burbank Urban Appointed at Yarra Park, Alphington, July 2020.
Public—3 December 2020 © Jemena Electricity Networks (Vic) Ltd 18You can also read