JUNE 16, 2022 - Coca-Cola FEMSA
←
→
Page content transcription
If your browser does not render page correctly, please read the page content below
JUNE 16, 2022
DISCLAIMER
FORWARD-LOOKING STATEMENTS
This presentation contains “forward-looking statements”. These forward-looking statements relate to Coca-Cola FEMSA, S.A.B. de C.V., its Subsidiaries (“KOF”), and their businesses
and are based on KOF management’s good faith expectations regarding KOF and its businesses. Forward looking statements involve known and unknown risks, uncertainties and other
factors, many of which are beyond KOF’s control and which may cause the actual results, performance or achievements of KOF and its businesses to be materially different from those
expressed or implied by the forward-looking statements contained herein or in oral statements made by members of KOF’s management. There can be no assurance that the results
and events contemplated by the forward-looking statements in this presentation will in fact occur. These forward-looking statements are based on numerous assumptions regarding
KOF’s present and future business strategies and the environment in which KOF operates and are not a guarantee of future performance. Therefore, recipients should not place undue
reliance on them. Forward-looking statements speak only as of the date they are made. KOF undertakes no obligation to update or revise any forward-looking statement, whether as a
result of new information, future events or otherwise.

The content of this presentation is intended for informational purpose only and does not constitute a representation and/or warrant made by KOF and/or any of its affiliates and
subsidiaries. The use in any manner of the information contained herein is of the sole responsibility of the recipient and/or attendant, therefore, recipient and/or attendant does not
reserve any action or claim of any nature against KOF or any of its subsidiaries or affiliates, for any damage or harm that recipient and/or attendant may suffer due to the use that they
give to the information contained in this presentation. Recipient and/or attendant to this presentation expressly and irrevocably acknowledges to have read and understood, in its
integrity, the content and extent of this disclaimer, therefore, their permanence in this presentation constitutes their express and irrevocable acceptance to the terms contained herein.

CONFIDENTIALITY
The nature of all the information in this presentation is privileged and confidential and belongs to KOF. By electing to view this information, you represent, warrant and agree that you will
not disclose, release, copy, take away, record or otherwise attempt to re-transmit this information, in whole or in part, directly or indirectly to any other persons (whether within or outside
your organization/firm). Distribution of this information to any persons other than the person to whom this information was originally delivered and such person’s advisors is unauthorized
and any disclosure, release and/or reproduction of these materials, in whole or in part, or the divulgence of any of its contents is prohibited, directly or indirectly. By attending this
presentation, you are expressly and irrevocably agreeing to be bound by the foregoing restrictions and to maintain absolute and strict confidentiality regarding the information disclosed
in these materials and any other oral and/or written information given during this presentation.

ADDITIONAL INFORMATION AND WHERE TO FIND IT
Documents filed electronically by KOF with the Securities and Exchange Commission’s (“SEC”) are available to the public on the Internet at the SEC’s website at www.sec.gov and at
our website at www.coca-colafemsa.com. Free copies of all of KOF’s filings with the SEC may also be obtained by directing a request to:

COCA-COLA FEMSA
Mario Pani # 100, Col. Santa Fé Cuajimalpa 05348, México City, México

                                                                                                                                                                                                   2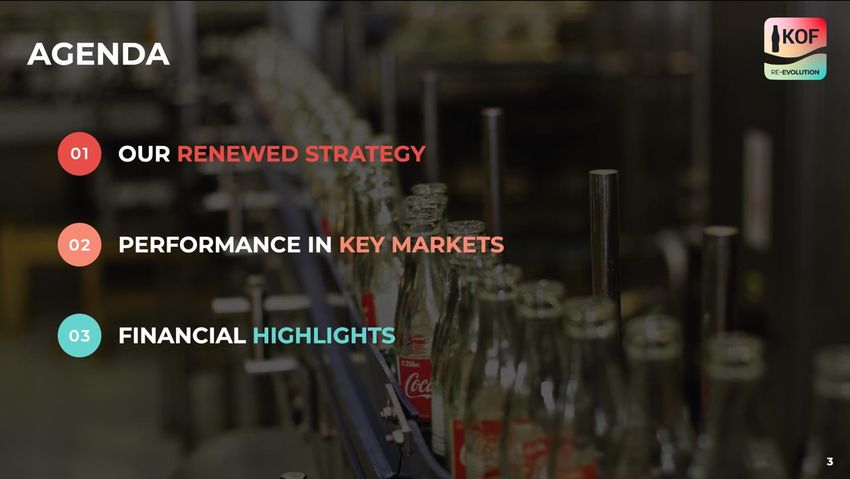
AGENDA

 01   OUR RENEWED STRATEGY

 02   PERFORMANCE BY COUNTRY

 03   FINANCIAL HIGHLIGHTS

                               3
AGENDA

 01   OUR RENEWED STRATEGY

                             4
COCA-COLA FEMSA AT A GLANCE
                                                                                     OPERATING FIGURES (FY21)

           +266 million                                                 2 million                                      49                              260
                  people served                                          points of sale                           bottling plants                distribution centers

                              FINANCIAL HIGHLIGHTS (LTM 1Q22)                                                                             OUR FOOTPRINT(3)

                  +3.5 billion(1)                                         +US$1.9 billion
                          volume                                          Operating Cash Flow(2)

                +US$9.9 billion                                                     19.8%
                         revenues                                   Operating Cash Flow margin (2)

                                     OUR BROAD PORTFOLIO

                                                                                                                  Largest franchise bottler
                                                                                                                   of Coca-Cola trademark
                                                                                                                  beverages in the world in
                                                                                                                       terms of volume
                                                                                                                   (representing ~11% of
                                                                                                                  TCCC volume worldwide)

(1) Unit Cases
(2) Operating Cash Flow = operating income + depreciation + amortization & other operating non-cash charges
(3) As of December 31, 2017, Venezuela is reported as an investment in shares, as a non-consolidated operation.
                                                                                                                                                                        5
RESILIENT BUSINESS MODEL
      We have effectively navigated volatile environments maintaining a high profitability base.

                     SOLID OPERATING CASH FLOW MARGIN(1)                                                                        KEY STRENGTHS

         21.00%

                                                                    20.3%
                  19.8%                                                              19.9%
                                19.4%             19.1%
         18.25%

                                                                                                                                S TRO NG MA RK E T
                                                                                                                                    P O S I TION
         15.50%

         12.75%

                                                                                                            E X TRE ME LY S O L ID           E X E CUTIO N
                                                                                                                 FI NA NCI AL S            FUNDA ME NTA LS
         10.00%

                  2017            2018             2019              2020              2021

(1)   Consolidated, full year. Operating Cash Flow = operating income + depreciation + amortization & other operating non-cash charges                       6
VAST GROWTH OPPORTUNITIES IN OUR
INDUSTRY
             LATAM BEVERAGE CATEGORIES BY %                                                                  LATAM INDUSTRY TOTAL VOLUME
                      OF VOLUME MIX                                                                                             IN LITERS, 2021
                                                                                                                                                                           ’22 - ’26
                                                                                                                                                                            CAGR

                                                                                            Carbonated
                                                                                            Soft Drinks                                                          50, 216     2.0%
                                                                           Cold Beverages
                                                                                35%
                                                                                            Bottled water
                                                                                                                                         29, 289                             3.4%

Non-commercial
     48%
                                 US$ 250+ bn                                                      Juices
                                 commercial beverages                                                                  9, 935                                                3.1%
                                     whitespace

                                                                                                     Tea     736                                                             4.1%

                                                                                               Energy &
                                                                                                  sport       2, 104                                                         5.6%
                                                           Hot Beverages                                                                              2.6%
                                                 Alcohol        10%
                                                                                                                                                   total soft drinks
                                                   7%
                                                                                                                                                   expected CAGR

   Source: IHS, Global Data, Internal Analysis                                                 Source: Euromonitor                                                                     7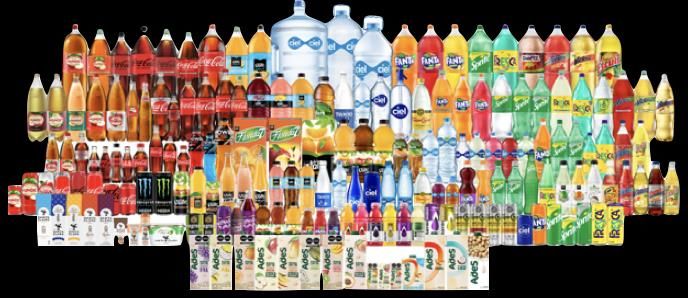
To accelerate our transformation into the growth model of the future, we refreshed our purpose and vision

Purpose                                    Vision
Refresh the world anytime,                 Become the world’s preferred and
anywhere                                   most sustainable commercial
                                           ecosystem

                                                                                                            8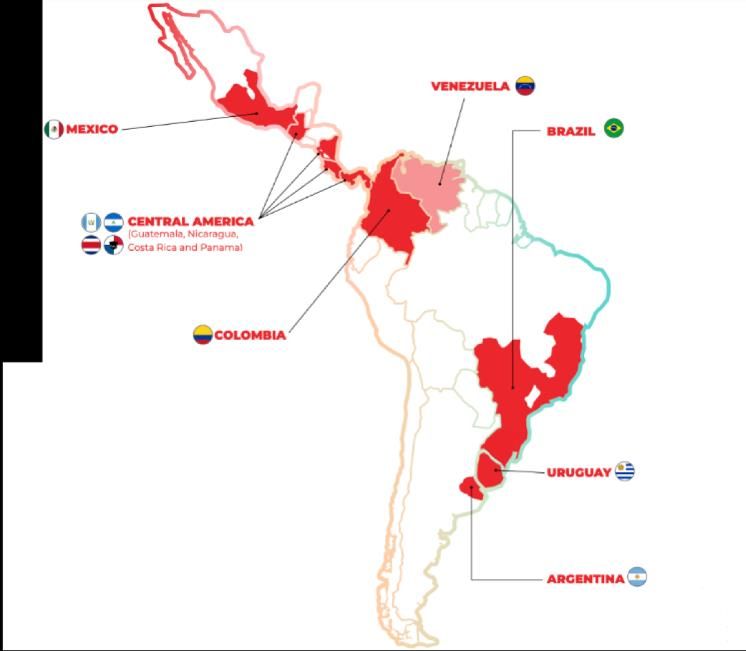
VALUE CREATION JOURNEY
This revamped vision is the result of a continuous value creation journey within Coca-Cola FEMSA.

                                              O MNI CHA NNE L &                   FUL L
                   DI G I TA LIZE D
                                              MUL TI -CA TE GORY              CO MME RCI AL
                     B O TTL E R
                                                   P L A YE R                 E CO S YS TE M

              • Sales force automation     • Digital platforms           • Digital ecosystem
              • Picking operations         • Multi-category (products)   • Multi-category (products
                                                                          and services)
              • Route optimization         • Digital payments
                                                                         • Data & information

                                                                                                      9
SIX STRATEGIC CORRIDORS

                  Sustainability    Winning Portfolio

     Value enhancing
                                            Omnichannel Platform
         acquisitions

   Agile, digital savvy, people     Digitize our core
                  centric culture
                                                                   10
BUILDING A WINNING PORTFOLIO
NCB s G RO W TH A ND
A FFO RDA B ILITY MI X E NHA NCE ME NT MUL TI -CA TE GORY
I NNO V A TION
+US$500m 62% mix Currently pilot
testing with
of zero or reduced calories in
invested in refillable capacity
CSDs. Substantial progress in our leading brands to increase
over the past 2 years our value proposition in the
sugar-reduction efforts Leveraging the
popularity of traditional channel
focus in high-
multipacks
+32% growth
returnable mix
profitable NCBs
Distribution
Successful launch of agreements in Brazil
the new formula of already signed with
Coca-Cola
Capturing new
consumption Zero Sugar
Successful roll- occasions through
out of the
the ARTD
Universal
Bottle segment
NCBs: non carbonated beverages CSDs: carbonated soft drinks ARTD: Alcoholic ready to drink 11OMNICHANNEL MULTI-CATEGORY COMMERCIAL PLATFORM
B2B PLATFORM D2C PLATFORM
Developing a D2C business model to market our Company’s products
For an improved customer experience, anytime, anywhere
directly to consumers’ homes
+1 M Web
clients
Chatbot Contact
~600k
digitalized households
Conversational Center
~60% commerce text & voice in Mexico
Consumer
Sales and
Customers SFA device delivery
App route
mobile Pre-sale
face 2 face
Website +400k
desk experience digital
Chatbot
monthly
purchasers
12PRE SELLER CHATBOT
APP WEBSITE 13EVOLUTION OF OUR OMNICHANNEL PLATFORM
MONTHLY DIGITAL PURCHASERS (1) MONTHLY DIGITAL REVENUE (1)
(K) (US$ MM)
+400
~US $300 +80
YTD April ‘22
+60
+265
~US $360
FY 2021
+130
+13
Jan '21 Dec '21 Mar '22 Jan '21 Dec '21 Mar '22
(1) Omnichannel Digital Platforms (web, chatbot, app) 14PERFORMANCE BY COUNTRY
% digital monthly purchasers
total clients
0.625
+50%
0.5
0.375
+35%
+30%
+26%
0.25
+15%
+8%
0.125
+1% +1%
0
Mar '21 Mar '22 Mar '21 Mar '22 Mar '21 Mar '22 Mar '21 Mar '22
15DIGITIZING OUR CORE
W E A RE E NA B L I NG
O UR DI G I TA L
TRANS FO RMATION
Our digital and analytics hub
is transforming our
advanced analytics and
data management
• Implementing a robust capabilities.
architecture from the
core
• Automating processes
• Adapting enablers to
scale our initiatives
16DIGITAL-SAVVY PEOPLE CENTRIC CULTURE
We functionalized our organization, ensuring agility and nimbleness.
TRANSFORMING KOF THROUGH TALENT
Our talent is the competitive Enabling key organizational Developing key initiatives through
advantage to reach our strategic capabilities to meet evolving Agile cells improving time to
goals business needs market
17ACTIVELY PURSUING VALUE-ENHANCING
ACQUISITIONS
FOOTPRINT CATEGORY-
CAPABILITIES
CONSOLIDATI ON EXPANDING
INTEGRATION
ACQUISITIONS
• Exploring opportunities to shape our Company’s
portfolio and footprint of the future. With a very disciplined approach to
• Prioritizing adjacent categories and capabilities to capital allocation.
enhance our value proposition.
18We are on track to meet our The percentage of women in leadership
sustainability targets, on the back of a 14% in
positions has increased from
US$114.6 million
robust sustainable financing strategy invested in projects in circular economy,
2020 to 20% in 2021. water stewardship, and climate action.
+100k benefited 1st Mexican Company 4th consecutive year
in neighboring communities with the funds to secure approval of the Science Based
that Coca-Cola FEMSA is part of the
we operate in collaboration with Fundación Targets Initiative (SBTi) for our GHG
Bloomberg Gender Equality Index.
FEMSA. emissions reduction targets.
191st Green Bond issuance within the
Coca-Cola System
1st sustainability-linked bond in Mexico
20SUSTAINABILITY GOALS
CL E A N E NE RG Y I N
W A TE R E FFI CIE NCY % RE CYCL E D CO NTE NT
MA NUFA CTURING
2026 GOAL: 2030 GOAL: 2030 GOAL:
1.26 lt of water used per liter of 50% of recycled resin (rPET) in Reduce 50%* absolute GHG
beverage produced our PET bottles emissions from our operation
1.77 31%
1.72 85%
1.65 29%
1.58 80%
1.52 1.49 1.47
71%
23%
21%
20%
52%
16%
15%
38%
29%
19%
2015 2016 2017 2018 2019 2020 2021 2015 2016 2017 2018 2019 2020 2021
2015 2016 2017 2018 2019 2020 2021
* vs 2015 21BETTER ALIGNED THAN EVER WITH THE
COCA-COLA COMPANY
Driven by our enhanced cooperation framework we are now:
ACCELERATING OUR
MORE ALIGNED EXPLORING NEW VENTURES
DIGITAL STRATEGY
Aligned growth plans, business As the system continues to Develop a joint digital strategy
economics and management evolve, we agreed to explore across strategic corridors
incentives towards long-term potential new businesses and
system value creation ventures
22AGENDA
02 PERFORMANCE BY COUNTRY
23STRONG PERFORMANCE IN ALL OF OUR MARKETS
VOLUME GROWTH OPERATING CASH FLOW GROWTH BY DIVISION(1)
LTM 1Q22 VS 1Q21 LTM 1Q22 VS 1Q21(2)
Mexico 3% +5% Mexico and
vs pre-
pandemic Central America
Mexico 11%
Brazil 9%
South America
Brazil 22%
Colombia 21%
0 0.055 0.11 0.165 0.22 0.275
Guatemala 13%
Consolidated
Mexico 14%
Argentina 12%
0 0.05 0.1 0.15
KOF 8%
(1) Operating cash flow
(2)
0 = operating
0.055income + 0.11
depreciation0.165
+ amortization0.22
& other operating non-cash charges 24
Figures in USDMEXICO: SUPERIOR EXECUTION CAPABILITIES
A F F O R D A B I L I T Y, NCBS GROWTH O MN I C H A N N E L VOLUME EVOLUTION
R GM & C OOLERS & INNOVAT I ON ACCELERATION
427.5
(MM UC)
+4%
424
+30% clients 422
-1% -3%
are monthly
active purchasers
420 419
85%
coverage
412.5
408
~600K 405
households in
+45K Mexico with
coolers D2C
placed YTD
397.5
1Q19 1Q20 1Q21 1Q22
25BRAZIL: CONSISTENT VOLUME GROWTH
LTM VOLUME EVOLUTION
(MM UC) (1) COCA-COLA B E E R A N D MU L T I - O MN I C H A N N E L
ZERO SUGAR & CATEGORY EXPANSION
1000
5% 945 D U A L P A C KS
866
840 +50% clients
805
770 are monthly
750
active purchasers
500
250
0
2018 2019 2020 2021 2022
(1) Last twelve months volume performance to first quarter of each year 26COLOMBIA: A SOLID TURNAROUND
VOLUME EVOLUTION
100
FOCUS ON AFFORDABILITY SIGNIFICANTLY (MM UC)
C LI EN T C R EAT IO N T HROU GH I MPR OVI N G +19%
R E T U R N A B I LI T Y SERVICE
LEVELS 80
80 +4%
+8%
Recognized as 68
+100K best supplier 65
clients created in over the past 60
60
2021 three years by
Colombia’s
leader retailer
40
Universal
returnable
bottle boosting
affordability
20
and RGM
0
1Q19 1Q20 1Q21 1Q22
27GUATEMALA: CAPTURING ALL OPPORTUNITIES
175
LTM VOLUME EVOLUTION
(MM UC)(1) DRIVING EXECUTION ACHIEVED
+13 AFFORDABILITY E MB E D D E D I N MA R K E T
I N MU L T I - S E R V E OUR CULTURE LEADERSHIP IN
140
% 134
AN D SI N GLE - N AR T D
CAGR SERVE
119
107
105 + 10pp
93 SOS in NARTD
category from
2017 to 2021
70
35
Market
makeover:
4x cooler
placement
0
2019 2020 2021 2022
(1)
Last twelve months volume performance to first quarter of each year
NARTD: Non alcoholic ready to drink 28AGENDA
03 FINANCIAL HIGHLIGHTS
29PROTECT THE SHORT TERM WITH A LONG-TERM VIEW
A disciplined raw material and currency hedging … substantially mitigating margin pressures and ensuring solid
strategy… financials
LTM YEAR OVER YEAR
Raw Material Hedge Position 2022 Operating
Volume Revenue
Cash Flow(1)
7.3% 7.5% 9.2%
PET ~70%
AS OF MARCH 31, 2022
Aluminium ~40%
Solid cash position Net debt ratio
+US $2.5bKEY TAKEAWAYS
K O F TO DA Y K O F I N THE FUTURE
Renewed strategy… to achieve long-term ambitions.
while accelerating towards a very promising long-term.
Right capabilities to protect the short term…
Omnichannel strategy showing results and rapidly positioning us better than ever to capture exponential
accelerating across markets… growth.
New phase in the relationship with TCCC aligning our model for the long term.
31Jorge Collazo | jorge.collazo@kof.com.mx
Lorena Martin | lorena.martinl@kof.com.mx
3233
STRONG FINANCIAL RESULTS
      Figures in USD millions(2)

                   TOTAL REVENUES (1)                                                       GROSS PROFIT (1)                                                  OPERATING INCOME (1)
                             VOLUME
                                                                                                        % margin                                                     % margin
                                                                    6000.                                                              1.
       3,330           3,366                           3,539
                                                                                                                                              1500.
                                                                                                                                                                                     1,394        1.

                       9,977           3,291           9,865                                    4,501                                                 1,281      1,311
        9,567                                                                    4,393                                         4,474
                                                                    4500.                                                                                                  1,175
                                       8,499                                                                    3,809
                                                                                                                                       0.75

                                                                                                                                                                                                  0.75

                                                                                 45.9%          45.1%           44.8%          45.4%
                                                                    3000.                                                              0.5
                                                                                                                                                                                                  0.5

                                                                    1500.                                                              0.25

                                                                                                                                                      13.4%                13.8%     14.1%
                                                                                                                                                                                                  0.25

                                                                                                                                                                 13.1%

                                                                        0.                                                             0.        0.                                               0.

       LTM19           LTM20           LTM21           LTM22                    LTM19           LTM20           LTM21          LTM22                  LTM19      LTM20     LTM21     LTM22

(1)   Figures are for the Last Twelve Months as of March 2022, 2021, 2020 and 2019.
(2) Figures   calculated in USD using an exchange rate of 20.33 for 2022, 21.60 for 2021, 19.42 for 2020 and 19.35 for 2019.                                                                 34
SOLID BALANCE SHEET
Figures in USD millions(2)
(1) (3) 8400. (1) (4) (1)
CAPITAL EXPENDITURES TOTAL DEBT CASH AND CASH EQUIVALENTS
1600.
% OF REVENUES
2600. 2,351 2,476
7.9%
5.9% 5.1% 4,162 4,187 1,677
5.6% 776 4200. 3,881 3,618
800.
567 511 1,219
472
0.
0. 0.
LTM19 LTM20 LTM21 LTM22
LTM19 LTM20 LTM21 LTM22 LTM19 LTM20 LTM21 LTM22
(1) Figures are for the Last Twelve Months as of March 2022, 2021, 2020 and 2019.
(2) Figures calculated in USD using an exchange rate of 20.33 for 2022, 21.60 for 2021, 19.42 for 2020 and 19.35 for 2019.
(3) Includes acquisitions of long-lived assets minus proceeds from sale of long-lived assets plus acquisitions of intangible assets.
(4) Includes Bank loans and notes payable, current and non-current portion.
35DEBT PROFILE 1Q22
Others
4%
BRL Floating
17% 20%
DEBT MIX BY MXN DEBT MIX BY
CURRENCY 53% RATE
USD
27% Fixed
80%
36INCOME STATEMENT SUMMARY
Figures in millions of USD 1Q22 1Q21 Δ% LTM 2022 LTM 2021 Δ%
Total Revenues 2,495 2,199 13.4% 9,865 8,499 16.1%
Gross Profit 1,101 980 12.3% 4,474 3,809 17.5%
Gross Margin (%) 44.1% 44.6% -50 bps 45.4% 44.8% +60 bps
Operating Income 334 290 14.9% 1,394 1,175 18.6%
Operating Margin (%) 13.4% 13.2% + 20 bps 14.1% 13.8% + 30 bps
Comprehensive Financing Result 107 56 92.1% 260 259 0.5%
Consolidated Net Income 154 153 0.5% 805 508 58.4%
Net income attributable to equity holders of
141 155 -9.2% 759 505 50.3%
the Company
37BALANCE SHEET SUMMARY
Figures in millions of USD Mar 2022 Dec 2021 Δ%
Total Current Assets 4,201 3,905 8%
Total Assets 14,200 13,196 8%
Total Current Liabilities 3,035 2,246 35%
Total Liabilities 8,027 6,997 15%
Total Equity 6,173 6,199 0%
Total Liabilities and Equity 14,200 13,196 8%
38You can also read