Nuchev Limited HY21 Half Year Results - February 2021
←
→
Page content transcription
If your browser does not render page correctly, please read the page content below

Nuchev Limited
HY21 Half Year Results
February 2021

                         1
Food for a better life

         2           2
Today’s presenters
                                               Agenda

                                               Business strengths                  4
                                               Financial and business highlights   5
                                               Financial Performance               6
                   Ben Dingle
         CEO, Executive Director and Founder   Outlook                             8
                                               Appendix                            10

              Chantelle Pritchard
            CFO and Company Secretary

                                                                                        3
Business strengths remain in place

         Significant global market opportunity                                                                     Premium, differentiated product,                                                                        Oli6® is a premium, trusted,
                                                                                                                        supported by science                                                                            Australian made and owned brand
 ▪        Goat milk based infant formula (GIF) is a rapidly
          growing segment of the infant formula (IF) market                                           ▪        GIF offers natural health benefits to infants
                                                                                                                                                                                                             ▪        Oli6® is Australian made and has demonstrated
                                                                                                      ▪        Attractive to health conscious end consumers (key                                                      success in domestic Australian and Chinese markets
 ▪        Global GIF market is forecast to grow at an                                                          group is Chinese mothers) prepared to pay a premium
          estimated CAGR of 16.6% to A$13.6 billion by 2023,                                                   for differentiated products                                                                   ▪        Oli6® brand benefits from the premium position of
          predominantly driven by the Chinese market1                                                                                                                                                                 GIF, with growing awareness of GIF health benefits
                                                                                                      ▪        RMIT University published scientific laboratory studies
                                                                                                                                                                                                             ▪        Brand positioning attractive to Chinese mothers and
                                                                                                               supporting the potential health benefits of Oli6®2
                                                                                                                                                                                                                      channel partners

      High quality, established supply chain &                                                                       Proven management and board                                                                              Significant volume and
               distribution network                                                                                   with deep industry expertise                                                                        revenue growth in key channels
 ▪        Quality, secure and scalable supply chain - capital
                                                                                                        ▪       Founded and led by Ben Dingle, co-founder of Synlait                                          ▪       Nuchev continues to achieve significant sales volume
          light model, with significant excess capacity
                                                                                                                Milk, processing partner of a2 Milk                                                                   and revenue growth in key strategic channels
 ▪        Utilises leading manufacturing partners with
          necessary certifications and expertise                                                        ▪       Supported by experienced management team and
                                                                                                                Board, with deep knowledge of the IF sector and                                               ▪       Potential upside from sales of China-specification
 ▪        Supply chain expertise supported by Nuchev’s                                                          channels to market                                                                                    product (subject to SAMR brand registration)
          significant in-house experience & capability

Sources
1. For the period from 2018 to 2023, based on Frost & Sullivan, The Infant Formula Market, October 2019.
2. Leong, A., Liu, Z., Almshawit, H., Zisu, B., Pillidge, C., Rochfort, S., & Gill, H. (2019). Oligosaccharides in goats’ milk-based infant formula and their prebiotic and anti-infection properties. British Journal of Nutrition, 122(4), 441-449.

                                                                                                                                                                                                                                                                             4
H1 FY21 Financial & Business Performance
Volumes (Metric Tonnes)                                                                                   Encouraging signs of recovery from challenging market conditions caused by
                           265.7
                                                                                                          COVID-19
                                                                                                          ▪ Revenue declined 33% on prior corresponding period due to impacts of ongoing COVID-19
                                                                                      171.0                 restrictions and broader economic uncertainty
                                                                                                          ▪ However, sales have rebounded strongly in Q2 FY21 by 118% following a challenging Q1 FY21
                                                                                                          ▪ Strong performance delivered through partnership with strategic distributor Blue Ocean
                                                                                                            International in the Cross Border channel, particularly during key selling periods including
                            HY20                                                      HY21
                                                                                                            “11/11” Singles Day

Revenue ($ millions)                                                                                      Oli6® brand continues to build momentum, achieving market share growth
                                                                                                          across all channels
                             8.1
                                                                                                          ▪ Strong market share growth achieved in the Cross Border E-Commerce (CBEC) channel during H1
                                                                                       5.4
                                                                                                          ▪ Performance in Coles supermarkets continues to gain momentum with 16% volume growth in H1
                                                                                                            FY21 offtake versus the prior year, as well as achieving the highest monthly market share on
                                                                                                            record in the last quarter of the calendar year.
                                                                                                          ▪ Oli6® also continues to grow in the Australian pharmacy channel, delivering significant share
                            HY20                                                      HY21                  gains in this channel during H1 FY21.
                                                                                                          ▪ Nuchev continues to invest in category innovation as well as strategic marketing and sales
Cash Balance ($ millions)                                                                                   initiatives involving key influencers and key opinion leaders (KOLs) to continue to drive
                                                                                                            engagement and loyalty to the brand, particularly through online platforms.
                                                                                       17.6

                                                                                                          Nuchev remains well positioned for growth, retaining strong cash position
                            15.2                                                                          ▪ Ending cash position of $17.6M with no debt, following successful capital raise in Q1 FY21.
                                                                                                          ▪ Nuchev remains well positioned to capitalise on future growth opportunities.

                            HY20                                                      HY21                ▪ Goat Infant Formula (GIF) category remains an attractive and fast-growing segment.
Note:
1. Revenue / volume reflects the sale of GIF, other goat nutritional products and raw ingredient sales.

                                                                                                                                                                                                            5
Key financial and operational metrics

                                                  1H21                        1H20                 % Change         Commentary
                                                                                                                    ▪   Strong revenue growth in CBEC channel following successful transition to new strategic
  Volume (MT)1                                      171                         266                    (33%)            distribution partner Blue Ocean International.
  Revenue ($ million)1                               5.4                        8.1                    (33%)        ▪   Orders through the Export channel resumed during Q2 with Daigou activity recovering
  ASP/MT ($ thousands)2                             31.8                       30.5                      4%             slowly from the industry wide contraction driven by COVID-19 restrictions.
  Gross Margin%3                                    36%                        38%                    (2) p.p       ▪   Average Selling Price improved on the prior corresponding period, representing brand
                                                                                                                        strength and a strong business model.
  Marketing % of Revenue                            47%                        49%                    +2 p.p        ▪   Normalised Gross Margin improved on prior corresponding period, as FY20 included a full
                                                                                                                        year adjustment to reflect the sale of free goods, which is now being reflected on a
  EBITDA                                            -4.7                       -7.0                     33%             quarterly basis.
  Cash on hand                                      17.6                       15.2                     16%         ▪   Marketing % Revenue slightly improved on prior corresponding period as we focus on
                                                                                                                        investment efficiency and effectiveness balanced with continued investment in building
                                                                                                                        brand equity for Oli6®.
 Notes:
 1. Revenue / volume reflects the sale of GIF, other goat nutritional products and raw ingredient sales and
                                                                                                                    ▪   EBITDA performance $2.3m favourable on the prior corresponding period due to the IPO
      excludes goat milk sales.                                                                                         costs incurred in December 2019.
 2. Average selling price per MT represents the total revenue of Australia-specification GIF and Goat Milk Powder
      sold divided by the total volume of Australia-specification GIF and Goat Milk Powder sold.                    ▪   Net cash position remains strong with cash on hand of $17.6M following successful capital
 3. Gross Margin is calculated as core revenue, less costs of sales divided by core revenue, expressed as a             raise early in H1 FY21
      percentage.

                                                                                                                                                                                                                 6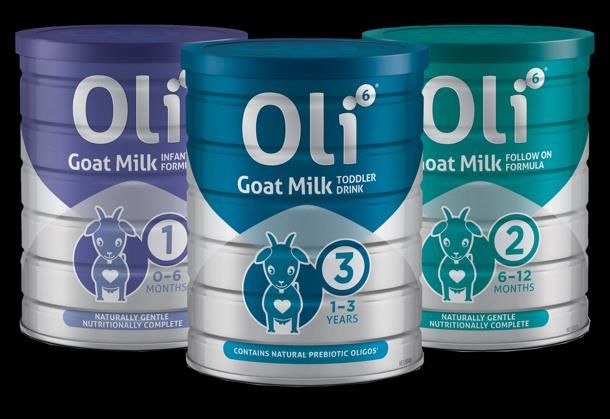
Outlook

          7
Outlook for H2 FY2021
Executive Leadership Team changes enable stronger focus on domestic and international
growth
▪   Given Nuchev’s growth aspirations in both the domestic and international markets, the company has
    confirmed a number of changes to its’ Executive Leadership Team to ensure it has the capabilities and
    structure in place that are fit for purpose and will support strong sales delivery.
▪   To enable CEO Ben Dingle to focus on building and growing the business, Chantelle Pritchard has been
    appointed to the role of Chief Operations Officer, which will involve responsibility for the day-to-day running of
    business operations, alongside her current roles of Chief Financial Officer and Company Secretary.
▪   Lisa Saunders has been appointed Chief Marketing Officer; responsible for Nuchev’s long term marketing and
    innovation planning. Lisa is a commercial and strategic marketing leader, with more than 20 years’
    international and domestic marketing experience across Asia, UK, USA and Europe.

Nuchev retains a positive outlook and expects to achieve strong revenue and volume growth in
H2 FY21 in the CBEC channel. This, however, may be offset by continued uncertainty in the
Export channel, the contraction of the Daigou channel, and restrictions on international flights.

The company continues to explore further avenues for growth through greater market
diversification and expansion of existing channels.

Given Nuchev’s strong cash position, capital light business model, and with recent changes to
the Executive Leadership Team, the company continues to be well positioned to advance its
market diversification and growth plans.

                                                                                                                         8
                                                                                                                         9

Appendix

           10
Statutory profit and loss (HY21 and HY20)
Statutory Results for the 6 months ending: Commentary
▪ H1 Distribution related expenses 7% of Revenue up on FY20
$ millions
Notes H1 FY21
% of
H1 FY20
% of mainly due to the reduction in sales base and therefore
Revenue Revenue lower economies of scale, however, overall spend lower
(FY20: 6%)
Revenue 1 5.4 8.1
▪ H1 Marketing expenses 47% of Revenue with spend focused
Cost of sales 2 (3.6) (5.2)
on strategic marketing initiatives that deliver an appropriate
Gross profit 1.9 2.9
ROI
35% 36%
(FY20: 49%)
Other income 3 0.3 0.1
▪ H1 Employment expenses 39% of Revenue in line with
Distribution, warehouse and logistics expectations and reflecting an increase due to new in
7% 6%
expenses (0.4) (0.5)
employee share based payments issued.
Marketing and selling expenses (2.6) 47% (4.0) 49%
(FY20: 23%)
Employment expenses (2.1) 39% (1.8) 23%
General and administration expenses 4 (1.0) 18% (3.0) 37% ▪ H1 G&A expenses 18% of Revenue also in line with
Other expenses 5 (0.8) 15% (0.6) 8% expectations, and significantly down on FY19 which included
EBITDA (4.7) (7.0) IPO costs
Livestock fair value adjustments 6 (0.2) - (FY19: 37%)
Depreciation and Amortisation (0.4) (0.1) Notes
1. Revenue reflects the sale of GIF, other goat nutritional products, goat milk sales and raw ingredient sales.
Finance income 0.1 0.1 2. Cost of sales include the costs to produce GIF and other goat products sold.
Finance costs 7 (0.0) (0.8) 3. Other income comprises grants received, sundry income and interest income.
4. General and administration expenses include travel and accommodation, consultancy, insurance,
Profit/(loss) before tax (5.3) (7.8) accounting, the incremental public company costs and other general and administration costs. FY20 includes
IPO costs of $2.1 million.
Income tax benefit 8 - - 5. Other expenses include product related testing, quality, obsolescence, provisions and development.
(5.3) (7.8) 6. Livestock fair value relates to movements in fair value of Nuchev’s goat herd.
(Loss) for the period
7. Finance costs principally related to the interest on debt from ADM Capital, which was fully repaid at the time
of the IPO in FY20.
8. Income tax - Nuchev has incurred tax losses historically, with the income tax losses carried forward not
recognised as a deferred tax asset on the basis that it is not yet probable future taxable profits will be
available against which the losses can be utilised.
11Consolidated statement of financial position as at 31/12/20 and 31/12/19)
Consolidated statement of financial position as at: Commentary
$ millions 31 Dec 2020 31 Dec 2019
▪ Nuchev has $17.6 million cash as at 31 December 2020
Cash and short term deposits 17.6 15.2
with successful capital raise in August 2020
Trade and other receivables 2.4 2.4
Prepayments 0.9 0.8
Inventories 12.7 7.4
▪ Working capital increased due to timing of inventory
Other current assets 0.1 - production and receipt of goods in transit (2.2m) compared
Biological assets - livestock 0.8 - to prior year
Current assets 34.5 25.8
Property, plant and equipment 0.2 0.2 ▪ As at 31 December 2020 Nuchev’s has revalued its goat
Intangible assets 1.6 1.9 herd, inline with prevailing market prices. It has also been
Right of use assets 0.3 0.4 reclassified as a current asset during the period.
Other non-current assets 0.1 0.1
Biological assets - livestock - 1.4 ▪ Issued capital increased $14.4 million reflecting the capital
Non-current assets 2.2 4.0 raise in August 2020 net of transaction costs
Total assets 36.7 29.8
Trade and other payables 1.5 0.9 ▪ Significant net current asset cover of $32.6 million
Government grants - 0.1
Provisions 0.2 0.1
Lease liabilities 0.2 0.1
Other current liablities - 0.1
Total current liabilities 1.9 1.3
Provisions 0.1 0.1
Lease liabilities 0.2 0.3
Total non-current liabilities 0.3 0.4
Total Liaibilities 2.2 1.7
Net assets 34.5 28.1
Issued capital 96.0 81.6
Other capital reserves 1.5 1.1
Accumulated losses - 63.0 - 54.6
Equity 34.5 28.1
12Disclaimer This presentation is provided by Nuchev Limited (ACN 163 225 090) (Nuchev) to provide summary information about Nuchev and its respective subsidiaries (together, the Group). Statements in this presentation are made as at the date of the presentation and the information in this presentation remains subject to change without notice. The information in this presentation is of a general nature and does not purport to be complete, is provided solely for information purposes and should not be relied upon by the recipient. This presentation is not, and does not constitute, or form any part of, an offer to sell or issue, or the solicitation, invitation or recommendation to purchase any securities. No representation or warranty, express or implied, is made as to the fairness, accuracy, completeness or correctness of the information, opinions and conclusions contained in this presentation. This presentation does not purport to summarise all information that a recipient should consider when making an investment decision, and should not form the basis of any decision by a recipient. Recipients should carry out their own investigations and analysis of the Group and verify the accuracy, reliability and completeness of the information contained in this presentation or any other form of communication to which the recipient is permitted access in the course of evaluating an investment in Nuchev. No liability: To the maximum extent permitted by law, none of Nuchev, the Group or their respective affiliates or related bodies corporate or any of their respective officers, directors, employees and agents (Related Parties), nor any other person, accepts any responsibility or liability for, and makes no recommendation, representation or warranty concerning, the content of this presentation, Nuchev, the Group or Nuchev securities including, without limitation, any liability arising from fault or negligence, for any loss arising from the use of or reliance on any of the information contained in this presentation or otherwise arising in connection with it. Not financial product advice: Reliance should not be placed on the information or opinions contained in this presentation. This presentation is for informational purposes only and is not a financial product or investment advice or recommendation to acquire Nuchev securities and does not take into consideration the investment objectives, financial situation or particular needs of any particular investor. You should make your own assessment of an investment in Nuchev and should not rely on this presentation. In all cases, you should conduct your own research of Nuchev and the Group and analysis of the financial condition, assets and liabilities, financial position and performance, profits and losses, prospects and business affairs of Nuchev, the Group and its business, and the contents of this presentation. You should seek legal, financial, tax and other advice appropriate to your jurisdiction. Past performance: Past performance information given in this presentation is given for illustrative purposes only and should not be relied upon as an indication of future performance. Future performance: This presentation contains certain forward-looking statements with respect to the financial condition, operations and business of the Group and certain plans and objectives of the management of Nuchev. Forward-looking statements can be identified by the use of forward-looking terminology, including, without limitation, the terms “believes”, “estimates”, “anticipates”, “expects, “predicts”, “intends”, “plans”, “goals”, “targets”, “aims”, “outlook”, “guidance”, “forecasts”, “may”, “will”, “would”, “could” or “should” or, in each case, their negative or other variations or comparable terminology. These forward-looking statements include all matters that are not historical facts. Such forward-looking statements involve known and unknown risks, uncertainties and other factors, which because of their nature may cause the actual results or performance of the Group to be materially different from the results or performance expressed or implied by such forward-looking statements. Such forward-looking statements are based on numerous assumptions regarding the Group’s present and future business strategies and the political and economic environment in which the Group will operate in the future, which may not be reasonable, and are not guarantees or predictions of future performance. No representation is made that any of these statements or forecasts will come to pass or that any forecast result will be achieved, or that there is a reasonable basis for any of these statements or forecasts. To the full extent permitted by law, Nuchev, the Group and their respective affiliates and related bodies corporate and each of their respective Related Parties and intermediaries disclaim any obligation or undertaking to release any updates or revisions to information to reflect any change in any of the information contained in this presentation (including, but not limited to, any assumptions or expectations set out in the presentation). Financial data: All figures in the presentation are Australian Dollars unless stated otherwise. 13 13
You can also read