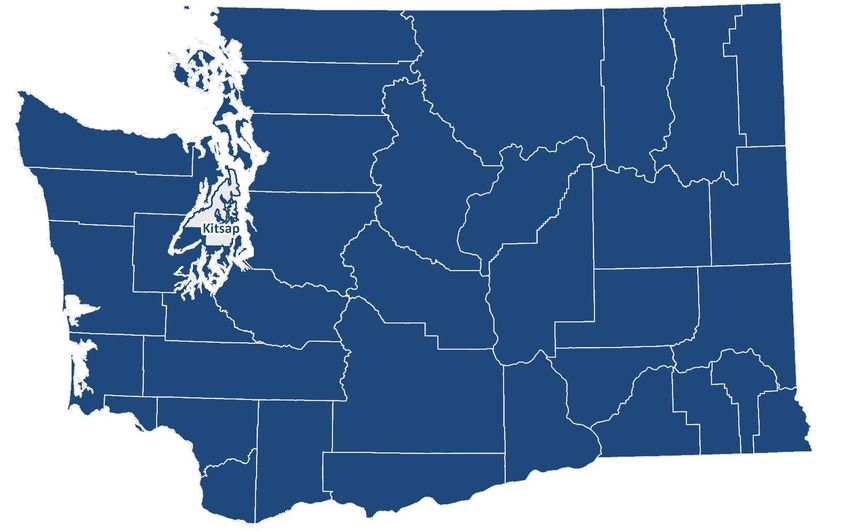
Kitsap County Risk and Protection Profile for Substance Abuse Prevention in - Washington State Department of Social and ...
←
→
Page content transcription
If your browser does not render page correctly, please read the page content below
Risk and Protection Profile
                         for Substance Abuse Prevention in
                                             Kitsap County
Getty Images/Purestock

                                                                                 Jan 2021

                                                                        4.47-18:2020

                                                                              4.47-18:2020

                                      Aaron Starks, MA, Irina V. Sharkova, PhD
                                               David Mancuso, PhD
                                               In conjunction with the
                                      Washington State Health Care Authority
                                     Division of Behavioral Health and Recovery
                                           Michael Langer, Deputy Director

                                        Research and Data Analysis Division
These tables provide a comprehensive update of data published in previous Profiles . They are among the timeliest data available to planners for understanding the
risks of substance abuse among youth in their counties. Community, family, peer, and school-related factors are presented within the Hawkins and Catalano risk and
protective factor framework that is used by many substance abuse prevention planners across the country.
For more information about the data, framework, definitions, and other topics, see the 1997 Profile on Risk and Protection for Substance Abuse Prevention Planning
in Washington State, (Report 4.15-40). That report and subsequent years’ Profiles are available on the RDA website at: https://www.dshs.wa.gov/ffa/rda/core-
profile-archive.

                  Kitsap County
Table of contents:

                  Cover page
                  Introduction
                  Interpreting Indicator Profiles:
                  Interpreting Annual Trend Charts:

                  Indicator Comparison Profiles: (A comparison of standardized five-year rates at county
                                                             and 'county like us' levels by domain, factor, and indicator)
                               1. Indicator Profile 1
                               2. Indicator Profile 2
                               3. Indicator Profile 3
                               4. Indicator Profile 4
                  Community:
                                    5. Availability of Drugs
                                    7. Extreme Economic & Social Deprivation
                                    11. Transitions & Mobility
                                    14. Antisocial Behavior of Community Adults
                                    19. Low Neighborhood Attachment and Community Disorganization
                  Family:
                                    22. Family Problems
                  Schools:
                                    24. Academic Achievement
                                    35. School Climate
                  Individual/Peer:
                                38. Early Criminal Justice Involvement
                  Problem Outcomes:
                              41. Child and Family Health
                              49. Criminal Justice
                              55. Substance Use
                  Appendices
                                    59. Technical Notes
                                    71. Populations Subtracted for Police Agencies not Reporting Arrests to UCR
                                    72. Police Agencies that did not Report Arrests to UCR

                  January, 2021 Notes:
                  Unexcused Absences is included in this report through 2017 but is no longer being updated.
                  Regular Attendance replaces Unexcused Absences moving forward. Five years of data are now available.

                                                                                                                                                                     i
How to Interpret Indicator Profiles
The Indicator Profile compares rates for your County, and Counties Like Us to the state. The Profile displays standardized scores
to allow comparison between indicators. See Technical Notes for a definition of a standardized score and of
Counties Like Us. To see all 39 counties ranked from the highest to the lowest for each indicator, go to
https://www.dshs.wa.gov/data/research/research-4.47-state.pdf
Domain/Factor Indicators VALUES ON THIS PAGE ARE EXAMPLE DATA
USED FOR DISPLAY PURPOSES ONLY
Standardized Scores for Cascadia County Counties Like Us
Community Domain
-0.43
Availability of Drugs Alcohol Retail Licenses
-0.46
Tobacco Retail And Vending -0.58
Availability of Drugs
Machine Licenses -0.57
Extreme Family Economic Food Stamp Recipients 0.27
Deprivation (All Ages) 0.46
Temporary Assistance to Needy
Extreme Family Economic 0.00 Zero rates are
Hyperlinked titles Families (TANF), Child
Deprivation
will take you to 0.30 labeled.
Recipients
the annual
indicator
Extreme data.
Family Economic Unemployed Persons (Age Suppressed rates
(Excel only)
Deprivation 16+) 0.20 are blank.
1.94
Transitions and Mobility Net Migration
0.20
-0.82
Transitions and Mobility Existing Home Sales
-1.43
Transitions and Mobility New Residence Construction 1.18
0.15
Antisocial Behavior of Alcohol- Or Drug-Related How to read this chart: -0.05
Community Adults Deaths The center line represents the
-0.11
state rate for each measure.
The bars show the difference
Clients Of State-Funded Alcoholabove or below the state rate. 0.08
AOD Problems
or Drug Services (Age 18+) 0.72
Each risk factor is State rate Interpretation: Cascadia County
Arrests, Alcohol-Related (Age -0.83
AODdescribed
Problemsby 1 to Our County has a lower rate of Alcohol-
8 indicators 18+) Counties Like Us -0.53 Related Arrests(18+) than the
state as a whole and similar
Arrests, Drug Law Violation (Age -0.42 counties.
AOD Problems While our rate of Arrests for
18+) -0.74
Drug Law Violations (18+) is
lower than the state rate,
Arrests, Violent Crime counties like us have an even
0.03
(Age 18+) 0.51
lower state rate higher
Washington State Department of Social and Health Services
Research and Data Analysis, Standardized Scores ii
Community Outcome and Risk Evaluation Geographic Information System (CORE-GIS). County Reports, Jan 2021.How To Interpret County Trend Charts
Understanding the CORE Trend Charts and Tables
The presentation of risk factor data in the CORE reports is organized by domain (Community, Family, School, and Individual/Peer)
and by risk factor within domains. Each risk factor may include one or more indicators.
Knowing that your county has a particular rate for one of the indicators does not help you evaluate the importance of that
indicator to your risk profile. You do not know if it is higher or lower than you could reasonably expect. It is more useful to
compare your county rate to the state rate, which is the average for the whole state, and to other counties, especially counties
that have some characteristics in common with your county. This is especially important when urban rates differ substantially
from rural rates. The comparison we present is for a group of counties that are similar in characteristics related to prevention
planning: population of young people (aged 10-24), the percentage of deaths in the county that are alcohol and drug-related, and
a simple geographic division into Eastern and Western Washington. For each indicator the Counties Like Us rate is the average
rate across all of the counties in the cluster. For more information on Counties Like Us see the Technical Notes.
Please note these IMPORTANT ISSUES:
If viewing the report as an XLSX, the worksheet tabs are labeled with the name of the risk factor. Each risk factor may in turn
include several indicators. Be sure to scroll down the worksheet page to review all of the available indicators for a given risk
factor. The workbook is designed to print with one indicator on each page.
If viewing the report as a PDF, the risk factor is listed in the page heading. Each indicator is displayed on a seperate page. There
may be several pages of indicators for a given risk factor.
Understanding the chart scales:
Users should be careful to interpret the chart scales correctly. The chart scales are automatically adjusted to enhance differences
between the indicators at each geographic level. Users should consider whether the differences they observe between
geographic areas or across years are significant. The unit of measurement is displayed at the left of each chart scale. Often the
unit of measurement is a rate expressed as the number of events or a count of individuals per 100 population (or, "percent"), or
sometimes per 1,000 or 100,000 population.
Review the example:
On the following page (below, scroll down) is an example indicator for Alcohol Retail Licenses in "Cascadia County". The number
of alcohol retail licenses is expressed as a rate per 1,000 population.
iii
Washington State Department of Social and Health Services
Research and Data Analysis,
Community Outcome and Risk Evaluation Geographic Information System (CORE-GIS). County Reports, Jan 2021.How To Interpret County Trend Charts
Each risk factor is on its separate page. Each risk factor may include several indicators, so remember to scroll down. For
example, the risk factor Availability of Drugs has two indicators: Alcohol Retail Licenses (shown below) and Tobacco Retail And
Vending Machine Licenses.
Back to Table of Contents
Hyperlinks will take you back to the Table of
Contents or to the Indicator Profile page.
(Excel only)
Go To Standardized Five-Year Rate Indicator Comparison Profile
Alcohol Retail Licenses
7.0
Pay close attention to these scales. The differences between the rates
6.0 may appear more or less important depending on the scale used.
5.0
Rate Per
4.0
1,000
3.0
This is the factor.
Different rates use 2.0
different factors-
some per 100 1.0
(percent), 1,000 or
0.0
100,000.
Cascadia County State Counties Like Us
2002 2003 2004 2005 2006 2007 2008 2009 2010 2011 2012 2013
National Comparable National Data Not Available
State 2.12 2.06 2.03 2.01 2.01 2.01 2.00 1.98 1.96 1.91 1.91 1.91
Counties Like Us 3.27 3.12 3.11 3.08 2.98 3.00 2.96 2.88 2.77 3.17 3.17 3.17
Cascadia County 5.08 5.23 5.22 5.22 5.29 5.35 4.86 4.99 4.32 5.93 5.93 5.93
Licenses 32 34 35 36 37 38 35 35 31 43 43 43
All Persons 6,295 6,497 6,703 6,899 7,000 7,103 7,198 7,012 7,177 7,250 7,250 7,250
Note: The State and County rate are the annual number of alcohol retail licenses active during the year, per Each indicator
1,000 persons (all ages). Retail licenses include restaurants, grocery stores, and wine shops but do not graph is followed by
include state liquor stores and agencies. Retail alcohol facilities on military bases and reservations are not data source and
licensed by the State and therefore are not included in these data. rate definitions as
well as any special
State Source: Washington State Liquor Control Board, Annual Operations Report information for the
Population Estimates: Washington State Office of Financial Management, Forecasting Division data.
Rate Formula
Rate = (numerator / denominator) x factor
When the data source for this
measure was last updated. Example in 2002: (32 / 6,295) x 1,000 = 5.08
Read the rate as 5.08 licenses per 1,000 people.
Updated
1/27/2015
iv
Washington State Department of Social and Health Services
Research and Data Analysis,
Community Outcome and Risk Evaluation Geographic Information System (CORE-GIS). County Reports, Jan 2021.Standardized Five-Year Indicator Profile
Domain/Factor Indicators
Kitsap County Counties Like Us
Community Domain
-0.29
Availability of Drugs Alcohol Retail Licenses -0.86
Extreme Family Tobacco Retail and Vending -0.27
Economic Deprivation Machine Licenses -0.60
Extreme Family Supplemental Nutritional -0.46
Economic Deprivation Assistance Program (SNAP) 0.51
Temporary Assistance to Needy -0.37
Extreme Family
Families (TANF), 0.37
Economic Deprivation
Child Recipients
Unemployed Persons 0.09
(Age 16+) 0.61
Transitions and Free or Reduced Price Lunch -0.62
Mobility Eligibility 0.34
Transitions and -0.84
Net Migration
Mobility -0.43
Transitions and 0.48
Existing Home Sales
Mobility 0.37
Antisocial Behavior of 0.18
New Residence Construction
Community Adults 0.90
Antisocial Behavior of -0.96
Alcohol- or Drug-Related Deaths
Community Adults -0.68
Clients of State-Funded Alcohol
or Drug Services -0.09
(Age 18+) 0.09
Arrests, Alcohol-Related
-0.74
(Age 18+)
-1.04
Antisocial Behavior of Arrests, Drug Law Violation
-0.31
Community Adults (Age 18+)
-0.76
Arrests, Violent Crime
-0.13
(Age 18+) -0.01
lower state rate higher
Washington State Department of Social and Health Services
Research and Data Analysis,
Community Outcome and Risk Evaluation Geographic Information System (CORE-GIS). County Reports, Jan 2021. 1Standardized Five-Year Indicator Profile
Domain/Factor Indicators
Kitsap County Counties Like Us
Community Domain (continued)
Low Neighborhood 0.00
Prisoners in State Correctional
Attachment and 0.54
Systems (Age 18+)
Community
Disorganization
Population Not Registered to -0.47
Vote -0.35
Registered and Not Voting in -0.06
the November Election 0.66
Family Domain
Family Problems 0.88
Divorce 0.01
Victims of Child Abuse and -0.29
Neglect in Accepted Referrals
0.06
School Domain
Academic Achievement -0.62
Poor Academic Performance,
0.39
Grade 10 (Age 15)
Poor Academic Performance, -0.06
Grade 7 (Age 12) 0.41
Poor Academic Performance, -0.40
Grade 4 (Age 9) 0.33
High school Cohort (Cumulative) -0.66
Academic Achievement
Dropouts -0.22
0.02
Annual (Event) Dropouts
0.33
Academic 0.69
Achievement: On-time Graduation
0.40
Protective Factors
0.89
Extended Graduation
0.71
lower state rate higher
Beginning with the Dec. 2015 report series, On-time and Extended Graduation are shown as protective factors. In previous reports, standardized rates above indicated a
negative factor: risk of not graduating (see Technical Notes for details).
Washington State Department of Social and Health Services
Research and Data Analysis,
Community Outcome and Risk Evaluation Geographic Information System (CORE-GIS). County Reports, Jan 2021. 2Standardized Five-Year Indicator Profile
Domain/Factor Indicators
Kitsap County Counties Like Us
School Domain (Continued)
-1.26
School Climate Weapons Incidents at School -0.35
Unexcused Absence -1.28
Replaced by Regular Attendance 0.76
Regular Attendance
-0.28
(Protective Factor) -0.43
New Jul-2020
Individual/Peer
-0.43
Early Criminal Justice Arrests, Alcohol- or 0.18
Involvement Drug-Related (Age 10-14)
-0.33
Arrests, Vandalism
0.25
(Age 10-14)
Total Arrests -0.40
(Age 10-14) 0.32
Problem Outcomes
0.00
Child Injury and Accident -1.01
Child and Family Health
Hospitalizations
0.38
Infant Mortality -0.27
(Under 1 Year)
-0.10
Child Mortality 0.16
(Ages 1-17)
-0.40
Births to School-Age
0.34
(10-17) Mothers
Sexually Transmitted Disease Cases -0.18
0.52
(Birth-19)
Suicide and Suicide Attempts (Age 10- -0.45
-1.23
17)
-0.08
Low Birth Weight Babies -0.54
Women Injury and Accident -0.30
Hospitalizations -0.56
lower state rate higher
Washington State Department of Social and Health Services
Research and Data Analysis,
Community Outcome and Risk Evaluation Geographic Information System (CORE-GIS). County Reports, Jan 2021. 3Standardized Five-Year Indicator Profile
Domain/Factor Indicators
Kitsap County Counties Like Us
Problem Outcomes
-1.03
-0.32
Offenses,
Criminal Justice Domestic Violence
Criminal Justice -0.71
0.40
Total Arrests,
(Age 10-17)
Criminal Justice -0.40
0.35
Arrests, Property Crime
(Age 10-14)
Criminal Justice
-0.72
0.52
Arrests, Property Crime
(Age 10-17)
Criminal Justice
-0.63
Arrests, Property Crime 0.03
(Age 18+)
Criminal Justice
-0.29
Arrests, Violent Crime -0.45
(Age 10-17)
-0.30
Alcohol-Related Traffic Fatalities 0.44
Substance Use Per All Traffic Fatalities
-0.28
Note: Check other Arrests, Alcohol Violation 0.07
Domains for substance (Age 10-17)
use of community
adults and early teens. -0.42
Arrests, Drug Law Violation 0.18
(Age 10-17)
Substance Use
Clients of State-Funded Alcohol -0.31
or Drug Services 0.20
(Age 10-17)
lower state rate higher
Washington State Department of Social and Health Services
Research and Data Analysis,
Community Outcome and Risk Evaluation Geographic Information System (CORE-GIS). County Reports, Jan 2021. 4Community Domain: Availability of Drugs
Alcohol Retail Licenses
2.5
2.0
Rate Per 1.5
1,000
1.0
0.5
0.0
Kitsap County Counties Like Us State
2008 2009 2010 2011 2012 2013 2014 2015 2016 2017 2018 2019
State 2.0 2.0 2.2 2.0 2.2 2.2 2.2 2.2 2.2 2.1 2.1 2.1
Counties Like Us 1.7 1.7 1.8 1.7 1.9 1.9 1.9 1.9 1.8 1.8 1.8 1.8
Kitsap County 1.7 1.7 1.9 1.7 1.9 1.9 2.0 1.9 1.7 1.8 1.7 1.8
Licenses 419 435 468 435 481 482 502 490 448 460 460 476
All Persons 249,514 251,054 251,133 253,821 254,095 253,381 254,960 257,161 260,931 262,507 265,177 267,567
Note: The alcohol retail licenses active during the year, per 1,000 persons (all ages). Retail licenses include on-premises
consumption such as restaurants, taverns, bars and off-premises vendors such as grocery stores, liquor stores and deli marts.
Retail locations with multiple privileges, such as a grocery store with both spirits and beer/wine privileges, are only counted once.
Retail alcohol facilities on military bases and reservations are not licensed by the State and therefore are not included in these
data. Non-retail licensees, such as distributors, distillers, and wineries are not included.
Effective March 1, 2012, Initiative 1183 privatized liquor sales in Washington State. Prior to privatization, the sale of spirits was
limited to 330 liquor stores regulated by the LCB, none of which were included in the data. This change may account for minor
shifts at smaller geographies as local markets adjusted to those store closures or their conversion to privately-run businesses
which were then counted in this report. Adding the sale of spirits to existing licensees who had previously been limited to beer
and wine sales would not show up as an increase in the number of licenses.
Policies on licensing distributors, taxing the proceeds, and determining who can sell alcohol vary substantially from state to state.
Consequently, there is no consistent comparable source for national data.
State Source: Washington State Liquor and Cannabis Board, Annual Operations Report
Population Estimates: Washington State Office of Financial Management, Forecasting Division
Updated: 02/10/2020
Washington State Department of Social and Health Services
Research and Data Analysis,
Community Outcome and Risk Evaluation Geographic Information System (CORE-GIS). County Reports, Jan 2021. 5Community Domain: Availability of Drugs
Tobacco Retail and Vending Machine Licenses
1.2
1.0
0.8
Rate Per
1,000 0.6
0.4
0.2
0.0
Kitsap County Counties Like Us State
2008 2009 2010 2011 2012 2013 2014 2015 2016 2017 2018 2019
State 1.1 1.0 1.0 1.0 0.9 0.9 0.9 0.9 0.9 0.9 0.8 0.8
Counties Like Us 1.0 0.9 0.9 0.9 0.8 0.8 0.8 0.8 0.8 0.8 0.7 0.7
Kitsap County 0.9 0.8 0.9 0.8 0.8 0.8 0.8 0.7 0.7 0.7 0.7 0.7
Licenses 233 203 216 213 192 194 190 190 178 188 189 187
All Persons 249,514 251,054 251,133 253,821 254,095 253,381 254,960 257,161 260,931 262,507 265,177 267,567
Note: The tobacco retailer and vending machine licenses active during the year, per 1,000 persons (all ages). Tobacco sales
licenses include tobacco retailer licenses (stores that sell tobacco products), vapor retailers, and tobacco vending machines.
Tobacco retailers on military bases and reservations are not licensed by the State and therefore are not included in these data.
Non-retail licensees, such as tobacco and vapor wholesalers and tobacco and vapor product manufacturers are also excluded. No
source of comparable national data was obtained.
State Source: Department of Health (from the Department of Licensing), Tobacco Prevention Program, Tobacco Statistics
Population Estimates: Washington State Office of Financial Management, Forecasting Division
Updated: 02/07/2020
Washington State Department of Social and Health Services
Research and Data Analysis,
Community Outcome and Risk Evaluation Geographic Information System (CORE-GIS). County Reports, Jan 2021. 6Community Domain: Extreme Family Economic Deprivation
Supplemental Nutritional Assistance Program (SNAP)
30
25
20
15
Percent
10
5
0
Kitsap County Counties Like Us State National
2008 2009 2010 2011 2012 2013 2014 2015 2016 2017 2018 2019
National 9.4 11.2 13.0 14.4 14.9 15.1 14.6 14.2 13.7 12.9 12.3 10.9
State 12.6 15.1 18.0 20.4 21.4 21.5 21.0 19.8 18.6 17.4 16.3 15.1
Counties Like Us 14.4 17.5 20.4 22.7 23.7 23.9 23.4 22.2 20.9 19.7 18.4 17.0
Kitsap County 9.7 12.3 14.8 16.6 17.5 17.9 17.5 16.8 15.5 14.4 13.4 12.4
Recipients 24,130 30,925 37,053 42,229 44,527 45,252 44,578 43,243 40,420 37,773 35,608 33,051
All Persons 249,514 251,054 251,133 253,821 254,095 253,381 254,960 257,161 260,931 262,507 265,177 267,567
Note: The persons (all ages) receiving food stamps in the fiscal year, per 100 persons (all ages). The population used is for the
calendar year which ends the fiscal period. National rates use counts of all yearly recipients. Suppression code definitions for
yearly rates are explained in Technical Notes.
State Source: Department of Social and Health Services, Research and Data Analysis, Automated Client Eligibility System and
Warrant Roll.
Population Estimates: Washington State Office of Financial Management, Forecasting Division
National Source: US Census Bureau, Statistical Abstract of the US; Federal Food Stamp Programs by State
Updated: 09/15/2020
Washington State Department of Social and Health Services
Research and Data Analysis,
Community Outcome and Risk Evaluation Geographic Information System (CORE-GIS). County Reports, Jan 2021. 7Community Domain: Extreme Family Economic Deprivation
Temporary Assistance to Needy Families (TANF), Child Recipients
14
12
10
8
Percent 6
4
2
0
Kitsap County Counties Like Us State National
2008 2009 2010 2011 2012 2013 2014 2015 2016 2017 2018 2019
National 3.9 4.2 4.5 4.5 4.6 4.2 3.8 4.1 3.8 3.6 3.3 2.2
State 8.8 9.7 10.3 11.0 9.6 8.3 7.4 6.2 5.6 5.2 4.6 4.2
Counties Like Us 10.1 11.0 11.3 11.8 10.3 8.8 8.0 6.7 6.1 5.7 4.9 4.5
Kitsap County 6.1 7.1 7.1 7.5 6.5 6.3 6.3 5.2 4.5 4.2 3.7 3.2
TANF Children 3,536 4,059 4,033 4,184 3,559 3,414 3,396 2,812 2,468 2,334 2,066 1,767
Children, birth-17 57,937 57,267 56,499 55,521 54,847 54,075 53,948 54,177 54,599 55,135 55,417 55,679
Note: The children (age birth-17) participating in Aid to Families (AFDC/TANF) programs in the fiscal year, per 100 children (age
birth-17). The population used is for the calendar year which ends the fiscal period. National TANF child recipients are defined as
children 0-19 with almost no children of age 19, therefore national denominators are for children 0-18. Suppression code
definitions for yearly rates are explained in Technical Notes.
State Source: Department of Social and Health Services, Research and Data Analysis, Automated Client Eligibility System and
Warrant Roll.
Population Estimates: Washington State Office of Financial Management, Forecasting Division
National Source: U.S. Department of Health & Human Services, Administration for Children and Families, Office of Planning
Research and Evaluation: Characteristics and Financial Circumstances of TANF Recipients Table I-29
Updated: 09/15/2020
Washington State Department of Social and Health Services
Research and Data Analysis,
Community Outcome and Risk Evaluation Geographic Information System (CORE-GIS). County Reports, Jan 2021. 8Community Domain: Extreme Family Economic Deprivation
Unemployed Persons (Age 16+)
12
10
8
Percent 6
4
2
0
Kitsap County Counties Like Us State National
2008 2009 2010 2011 2012 2013 2014 2015 2016 2017 2018 2019
National 5.8 9.3 9.6 8.9 8.1 7.4 6.2 5.3 4.9 4.4 3.9 3.7
State 5.3 8.9 9.6 9.2 8.2 7.0 6.2 5.7 5.4 4.8 4.5 4.3
Counties Like Us 5.8 9.1 9.9 9.5 8.8 8.2 7.3 6.4 6.4 5.4 5.1 5.2
Kitsap County 5.0 7.4 7.9 7.9 7.4 6.8 6.4 5.5 5.8 4.9 4.7 4.6
Unemployed, 16+ 6,240 9,240 9,850 9,720 8,910 7,920 7,210 6,315 6,816 5,938 5,713 5,877
Labor Force,16+ 124,750 125,420 125,060 122,730 120,080 116,460 113,222 115,211 117,931 121,104 122,885 128,764
Note: The unemployed persons (age 16 and over) per 100 persons in the civilian labor force. Unemployed persons are individuals
who are currently available for work have actively looked for work, and do not have a job. The civilian labor force includes
persons who are working or looking for work. The monthly numbers are a snapshot in time done approximately the 12th of each
month. A yearly estimate is then produced by averaging the monthly numbers. Historical data has been updated. Data for the
latest year should be considered preliminary. Suppression code definitions for yearly rates are explained in Technical Notes.
State Source: Employment Security Department, Labor Market and Economic Analysis, County Unemployment File
National Source: U.S. Department of Labor Bureau of Labor Statistics Labor Force Statistics from the Current Population Survey
Updated: 06/19/2020
Washington State Department of Social and Health Services
Research and Data Analysis,
Community Outcome and Risk Evaluation Geographic Information System (CORE-GIS). County Reports, Jan 2021. 9Community Domain: Extreme Family Economic Deprivation
Students Eligible for Free or Reduced Price Lunch
60
50
40
Percent 30
20
10
0
Kitsap County Counties Like Us State National
2008 2009 2010 2011 2012 2013 2014 2015 2016 2017 2018 2019
National 38.7 40.6 42.8 43.9 39.8 40.0 40.1 41.0 41.1 41.0 41.1 40.8
State 38.0 39.0 42.2 43.8 45.2 45.9 45.5 45.6 44.5 43.5 42.5 43.2
Counties Like Us 40.7 41.7 44.7 46.2 47.2 47.6 47.0 48.9 47.6 46.6 45.9 48.2
Kitsap County 28.8 29.6 33.3 35.2 35.9 36.4 37.1 36.3 35.4 34.1 33.0 33.9
Eligible Students 11,061 11,154 12,223 12,939 13,027 13,029 13,120 12,854 12,603 12,158 11,845 12,271
Enrolled Students 38,371 37,639 36,661 36,788 36,341 35,802 35,387 35,404 35,557 35,660 35,880 36,223
Note: The students eligible for free or reduced price lunch per 100 students enrolled. Eligibility requirements are discussed in
Technical Notes.
State Source: Office of Superintendent of Public Instruction, Child Nutrition
National Source: U.S. Department of Agriculture, Child Nutrition Tables
Updated: 07/07/2020
Washington State Department of Social and Health Services
Research and Data Analysis,
Community Outcome and Risk Evaluation Geographic Information System (CORE-GIS). County Reports, Jan 2021. 10Community Domain: Transitions and Mobility
Net Migration
15
10
5
Rate Per
0
1,000
-5
-10
Kitsap County Counties Like Us State
2008 2009 2010 2011 2012 2013 2014 2015 2016 2017 2018 2019
State 6.3 3.3 1.7 0.9 1.8 4.1 7.1 8.2 12.1 12.7 11.7 11.9
Counties Like Us 7.6 5.4 0.9 2.0 1.3 3.5 7.0 7.3 9.9 10.3 11.1 12.0
Kitsap County 5.9 0.6 -4.1 7.0 -1.7 -5.9 4.2 5.6 13.1 3.2 7.8 8.4
Net Migration 1,463 157 -1,021 1,778 -430 -1,493 1,071 1,451 3,419 841 2,065 2,257
All Persons 249,514 251,054 251,133 253,821 254,095 253,381 254,960 257,161 260,931 262,507 265,177 267,567
Note: Net migration is the annual number of new residents that moved into an area minus the number of residents that moved
out of an area, per 1,000 persons. The Office of Financial Management estimates annual net migration for twelve months ending
on March 31st of a given year. For example, annual net migration in 2009 refers to the period from April 1, 2008 through March
31, 2009. Previously Net migration was calculated as a 3-year moving average which smooths changes over time. Now, annual
rates, numerators and denominators are based on single-year data.
State Source: Office of Financial Management, Net Migration Data
Updated: 06/22/2020
Washington State Department of Social and Health Services
Research and Data Analysis,
Community Outcome and Risk Evaluation Geographic Information System (CORE-GIS). County Reports, Jan 2021. 11Community Domain: Transitions and Mobility
Existing Home Sales
20
15
10
Rate Per
1,000
5
0
Kitsap County Counties Like Us State National
2008 2009 2010 2011 2012 2013 2014 2015 2016 2017 2018 2019
National 16.2 16.8 13.5 13.7 13.2 14.2 13.6 14.5 15.0 15.0 14.5 14.5
State 12.9 12.7 12.6 12.9 11.7 13.6 12.9 14.1 15.5 15.5 15.3 14.3
Counties Like Us 14.2 14.7 13.8 13.1 11.4 13.4 12.3 14.4 16.3 16.4 16.1 15.1
Kitsap County 12.3 13.1 12.5 11.7 12.0 14.9 15.4 14.7 18.1 18.8 19.0 17.5
Sales 3,070 3,290 3,130 2,960 3,040 3,780 3,920 3,790 4,720 4,940 5,030 4,690
All Persons 249,514 251,054 251,133 253,821 254,095 253,381 254,960 257,161 260,931 262,507 265,177 267,567
Note: The previously-owned homes sold, per 1,000 persons (all ages). Previously-owned homes sold is rounded to the tens.
Existing homes sold are estimated based on data from multiple listing services, firms that monitor deeds, and local Realtors
associations. Adjustments were made by the data provider to remove refinanced, rather than sold homes from the counts of
sales.
State Source: Washington Center for Real Estate Research, University of Washington. Market Summary Report. Existing Home
Sales.
Population Estimates: Washington State Office of Financial Management, Forecasting Division
National Source: NATIONAL ASSOCIATION OF REALTORS®,Single-Family Existing-Home Sales and Prices.
Updated: 10/01/2020
Washington State Department of Social and Health Services
Research and Data Analysis,
Community Outcome and Risk Evaluation Geographic Information System (CORE-GIS). County Reports, Jan 2021. 12Community Domain: Transitions and Mobility
New Residence Construction
5
4
3
Rate Per
1,000 2
1
0
Kitsap County Counties Like Us State National
2008 2009 2010 2011 2012 2013 2014 2015 2016 2017 2018 2019
National 2.0 1.4 1.5 1.3 1.7 2.0 2.0 2.2 2.3 2.5 2.6 2.6
State 4.4 2.6 3.1 1.9 2.4 2.7 2.6 2.8 3.1 3.2 3.2 3.1
Counties Like Us 3.6 2.7 3.4 2.2 2.9 3.2 3.0 3.5 4.1 3.6 4.0 4.2
Kitsap County 3.1 2.2 2.5 1.8 2.5 2.7 2.0 3.1 3.3 3.6 3.4 3.5
New Residences 783 562 623 451 634 674 519 796 862 952 903 931
All Persons 249,514 251,054 251,133 253,821 254,095 253,381 254,960 257,161 260,931 262,507 265,177 267,567
Note: The new building permits issued for single and multi-family dwellings, per 1,000 persons (all ages). Each unit in a multi-
family dwelling (for example, each apartment in a building) has a separate building permit.
State Source: Washington Center for Real Estate Research, Washington State University,U.S. Department of Commerce, C-40
Reports
Population Estimates: Washington State Office of Financial Management, Forecasting Division
National Source: U.S. Census Bureau, Building Permits Survey
Updated: 10/01/2020
Washington State Department of Social and Health Services
Research and Data Analysis,
Community Outcome and Risk Evaluation Geographic Information System (CORE-GIS). County Reports, Jan 2021. 13Community Domain: Antisocial Behavior of Community Adults
Alcohol- or Drug-Related Deaths
16
14
12
10
Percent 8
6
4
2
0
Kitsap County Counties Like Us State
2008 2009 2010 2011 2012 2013 2014 2015 2016 2017 2018 2019
State 11.7 12.4 12.5 12.7 12.8 10.8 13.1 13.3 13.4 13.7 14.2 14.2
Counties Like Us 11.2 12.3 12.2 12.2 12.1 10.4 13.0 12.8 12.6 13.4 13.7 13.5
Kitsap County 11.1 12.1 12.1 12.2 11.5 10.9 12.8 13.0 12.5 11.4 12.2 11.5
AOD-related 211 236 233 234 224 216 271 275 274 252 268 268
Deaths 1,894 1,954 1,928 1,916 1,947 1,989 2,115 2,123 2,192 2,214 2,196 2,334
Note: The deaths, with alcohol- or drug-related causes, per 100 deaths. Evaluation is based on all contributory causes of death for
direct and indirect associations with alcohol and drug abuse. For a complete explanation of the codes and methods used please
see Technical Notes: Counting Alcohol- or Drug-related Deaths. Suppression code definitions for yearly rates are explained in
Technical Notes. Rates are not reported when fewer than 100 deaths occurred in an area.
State Source: Department of Health, Center for Health Statistics, Death Certificate Data File
Updated: 09/30/2020
Washington State Department of Social and Health Services
Research and Data Analysis,
Community Outcome and Risk Evaluation Geographic Information System (CORE-GIS). County Reports, Jan 2021. 14Community Domain: Antisocial Behavior of Community Adults
Clients of Publicly-Funded Alcohol or Drug Services (Age 18+)
16
14
12
10
8
Rate Per 6
1,000 4
2
0
Kitsap County Counties Like Us National State
2007 2008 2009 2010 2011 2012 2013 2014 2015 2016 2017 2018
National 7.7 8.1 7.8 7.7 7.0
State 11.7 12.1 12.2 11.6 11.2 10.4 10.4 10.7 11.1 10.9 10.3 10.2
Counties Like Us 13.9 14.5 14.4 13.7 12.9 11.4 11.3 11.7 12.5 11.1 9.6 9.5
Kitsap County 9.9 10.3 10.3 9.9 9.5 8.3 8.8 9.5 10.7 10.2 10.3 10.4
Admits, 18+ 1,859 1,971 1,991 1,928 1,875 1,661 1,751 1,913 2,178 2,106 2,131 2,184
Persons, 18+ 188,537 191,577 193,787 194,634 198,300 199,249 199,306 201,012 202,984 206,332 207,372 209,760
Note: The adults (age 18 and over) receiving publicly-funded alcohol or drug services, per 1,000 adults. Counts of adults are
unduplicated so that those receiving services more than once during the year are only counted once for that year. Client counts
are linked to state service records through the Research and Data Analysis Client Services Database. State-funded services include
treatment, assessment, and detox. Persons in Department of Corrections treatment programs are not included.
State Source: Department of Social and Health Services, Division of Behavioral Health and Recovery services reported from the
Research and Data Analysis Client Services Database (CSDB).
Population Estimates: Washington State Office of Financial Management, Forecasting Division
National Source: Office of Applied Studies, Substance Abuse and Mental Health Services Administration, Treatment Episode Data
Set (TEDS)
Updated: 08/02/2019
Washington State Department of Social and Health Services
Research and Data Analysis,
Community Outcome and Risk Evaluation Geographic Information System (CORE-GIS). County Reports, Jan 2021. 15Community Domain: Antisocial Behavior of Community Adults
Arrests (Age 18+), Alcohol-Related
12
10
8
6
Rate Per
1,000 4
2
0
Kitsap County Counties Like Us State National
2008 2009 2010 2011 2012 2013 2014 2015 2016 2017 2018 2019
National 11.1 10.6 10.1 9.0 8.9 7.9 7.3 6.9 6.3 6.0 5.7 5.4
State 9.6 9.9 9.3 9.4 7.3 6.7 6.0 5.3 4.9 5.2 5.2 5.4
Counties Like Us 6.5 6.3 5.4 5.7 3.5 3.4 3.3 2.7 2.5 2.7 2.8 2.7
Kitsap County 4.8 5.4 5.4 4.6 2.4 2.8 1.8 1.9 2.4 2.8 3.5 3.0
Arrests, 18+ 892 1,012 1,013 873 460 530 344 365 470 554 716 614
Adjusted Pop 18+ 185,429 187,541 188,254 191,815 192,747 192,712 194,373 196,332 199,611 200,498 202,945 204,888
Note: The alcohol violations (age 18+), per 1,000 adults (age 18+). Alcohol violations include all crimes involving driving under the
influence, liquor law violations, and drunkenness. DUI arrests by the Washington State Patrol are included in the state trend
analysis. However, they are not included in the county rankings since WSP arrests are not assigned to counties. Denominators are
adjusted by subtracting the population of police agencies that did not report arrests to WASPC. In spite of this population
adjustment, when the non-reporting police jurisdiction is where much of the crime occurs, the rate for the county will be lower
than it would be if that jurisdiction was included. For percent subtracted, suppression code definitions and the agencies not
reporting, see the Technical Notes and the appendix, Non-Reporting Agencies and Population.
The types of crimes used within this rate are represented in both Summary UCR and NIBRS systems and are not likely to be
substantially impacted by the system change.
State Source: Washington Association of Sheriffs and Police Chiefs (WASPC): Uniform Crime Report (UCR), National Incident-
Based Reporting System (NIBRS)
Population Estimates: Washington State Office of Financial Management, Forecasting Division
National Source: US Department of Justice, Bureau of Justice Statistics Sourcebook of Criminal Justice Statistics Online
Updated: 09/14/2020
Washington State Department of Social and Health Services
Research and Data Analysis,
Community Outcome and Risk Evaluation Geographic Information System (CORE-GIS). County Reports, Jan 2021. 16Community Domain: Antisocial Behavior of Community Adults
Arrests (Age 18+), Drug Law Violation
8
7
6
5
4
Rate Per
1,000 3
2
1
0
Kitsap County Counties Like Us State National
2008 2009 2010 2011 2012 2013 2014 2015 2016 2017 2018 2019
National 6.7 6.5 6.3 5.8 5.9 5.9 6.0 5.6 5.9 6.1 6.2 5.7
State 5.1 4.6 4.4 4.6 2.4 2.2 2.2 2.2 2.4 2.6 2.6 2.8
Counties Like Us 4.2 3.7 3.5 3.7 2.4 2.0 1.9 1.9 2.0 2.1 2.0 2.1
Kitsap County 4.5 3.8 3.2 2.7 1.7 1.7 1.6 1.6 1.8 2.3 2.1 2.5
Arrests, 18+ 826 720 595 514 328 324 309 308 362 465 435 502
Adjusted Pop 18+ 185,429 187,541 188,254 191,815 192,747 192,712 194,373 196,332 199,611 200,498 202,945 204,888
Note: The arrests of adults (age 18+) for drug law violations, per 1,000 adults (age 18+). Drug law violations include all crimes
involving sale, manufacturing, and possession of drugs. Denominators are adjusted by subtracting the population of police
agencies that did not report arrests to WASPC. In spite of this population adjustment, when the non-reporting police jurisdiction
is where much of the crime occurs, the rate for the county will be lower than it would be if that jurisdiction was included. For
percent subtracted, suppression code definitions and the agencies not reporting, see the Technical Notes and the appendix, Non-
Reporting Agencies and Population.
The types of crimes used within this rate are represented in both Summary UCR and NIBRS systems and are not likely to be
substantially impacted by the system change.
State Source: Washington Association of Sheriffs and Police Chiefs (WASPC): Uniform Crime Report (UCR), National Incident-
Based Reporting System (NIBRS)
Population Estimates: Washington State Office of Financial Management, Forecasting Division
National Source: US Department of Justice, Bureau of Justice Statistics Sourcebook of Criminal Justice Statistics Online
Updated: 09/14/2020
Washington State Department of Social and Health Services
Research and Data Analysis,
Community Outcome and Risk Evaluation Geographic Information System (CORE-GIS). County Reports, Jan 2021. 17Community Domain: Antisocial Behavior of Community Adults
Arrests (Age 18+), Violent Crime
2.5
2.0
1.5
Rate Per
1.0
1,000
0.5
0.0
Kitsap County Counties Like Us State National
2008 2009 2010 2011 2012 2013 2014 2015 2016 2017 2018 2019
National 2.2 2.2 2.0 2.0 1.9 1.9 1.8 1.8 1.9 1.9 1.9 1.8
State 1.5 1.6 1.6 1.6 1.5 1.5 1.5 1.5 1.5 1.5 1.5 1.6
Counties Like Us 1.6 1.6 1.7 1.7 1.3 1.4 1.3 1.5 1.5 1.5 1.5 1.6
Kitsap County 2.2 2.2 2.1 1.8 1.1 1.4 1.4 1.3 1.6 1.4 1.5 1.3
Arrests, 18+ 412 406 401 344 205 273 267 256 325 285 305 269
Adjusted Pop 18+ 185,429 187,541 188,254 191,815 192,747 192,712 194,373 196,332 199,611 200,498 202,945 204,888
Note: The arrests of adults (age 18+) for violent crime per 1,000 adults (age 18+). Violent crimes include all crimes involving
criminal homicide, forcible rape, robbery, and aggravated assault. Simple assault is not defined as a violent crime. Denominators
are adjusted by subtracting the population of police agencies that did not report arrests to WASPC. In spite of this population
adjustment, when the non-reporting police jurisdiction is where much of the crime occurs, the rate for the county will be lower
than it would be if that jurisdiction was included. For percent subtracted, suppression code definitions and the agencies not
reporting, see the Technical Notes and the appendix, Non-Reporting Agencies and Population.
The types of crimes used within this rate are represented in both Summary UCR and NIBRS systems and are not likely to be
substantially impacted by the system change.
State Source: Washington Association of Sheriffs and Police Chiefs (WASPC): Uniform Crime Report (UCR), National Incident-
Based Reporting System (NIBRS)
Population Estimates: Washington State Office of Financial Management, Forecasting Division
National Source: US Department of Justice, Bureau of Justice Statistics Sourcebook of Criminal Justice Statistics Online
Updated: 09/14/2020
Washington State Department of Social and Health Services
Research and Data Analysis,
Community Outcome and Risk Evaluation Geographic Information System (CORE-GIS). County Reports, Jan 2021. 18Community Domain: Low Neighborhood Attachment and Community Disorganization
Prisoners in State Correctional Systems (Age 18+)
1000
800
600
Rate Per
100,000
400
200
0
Kitsap County Counties Like Us State
2008 2009 2010 2011 2012 2013 2014 2015 2016 2017 2018 2019
National
State 403.0 400.1 400.4 367.9 401.6 465.7 470.7 522.1 662.0 662.1 696.1 801.1
Counties Like Us 383.5 394.6 388.9 355.2 417.9 456.7 468.1 564.7 759.8 813.0 832.7 878.1
Kitsap County 243.3 297.2 309.8 315.2 351.4 564.4 592.3 568.5 676.8 713.5 737.6 664.9
Prisoners, 18+ 607 746 778 800 893 1,430 1,510 1,462 1,766 1,873 1,956 1,779
All Persons 249,514 251,054 251,133 253,821 254,095 253,381 254,960 257,161 260,931 262,507 265,177 267,567
Note: The adult (age 18 and over) admissions to prison, per 100,000 persons (all ages). Admissions include new admissions, re-
admissions, community custody inmate violations, and parole violations. Counts of admissions are duplicated so that individuals
admitted to prison more than once in a year are counted each time they are admitted. The admissions are attributed to the
county where the conviction occurred. Prisoners being electronically monitored are included in the data. Suppression code
definitions for yearly rates are explained in Technical Notes.
State Source: Department of Corrections, Inmates File.
Population Estimates: Washington State Office of Financial Management, Forecasting Division
Updated: 09/29/2020
Washington State Department of Social and Health Services
Research and Data Analysis,
Community Outcome and Risk Evaluation Geographic Information System (CORE-GIS). County Reports, Jan 2021. 19Community Domain: Low Neighborhood Attachment and Community Disorganization
Population Not Registered to Vote
40
35
30
25
20
Percent
15
10
5
0
Kitsap County Counties Like Us State National
2008 2009 2010 2011 2012 2013 2014 2015 2016 2017 2018 2019
National 37.4 34.9 28.8 35.3 29.7 33.1 33.1
State 27.8 29.7 30.0 29.6 25.6 26.2 27.1 27.2 23.2 24.7 24.3 23.2
Counties Like Us 28.1 29.9 29.4 28.7 25.1 25.3 25.8 26.1 21.7 23.1 22.1 20.8
Kitsap County 24.5 26.5 26.1 26.1 23.4 22.9 23.2 24.0 19.3 20.9 19.5 17.5
Not Registered 46,887 51,337 50,838 51,707 46,568 45,570 46,550 48,629 39,831 43,331 40,933 37,021
Persons, 18+ 191,577 193,787 194,634 198,300 199,249 199,306 201,012 202,984 206,332 207,372 209,760 211,888
Note: The persons not registered to vote in the November elections, per 100 adults (age 18 and over). As part of the November
Current Population Survey (the Voting and Registration Supplement), the Bureau of the Census collects data on voting and
registration in years with presidential or congressional elections (i.e. every other year).
State Source: Office of the Secretary of State, Elections Division, Registered Voters
Population Estimates: Washington State Office of Financial Management, Forecasting Division
National Source: Calculated using data from U.S. Census Bureau, Statistical Abstract of the United States; "Voting-Age Population,
Percent Reporting Registered, and Voted"
Updated: 04/14/2020
Washington State Department of Social and Health Services
Research and Data Analysis,
Community Outcome and Risk Evaluation Geographic Information System (CORE-GIS). County Reports, Jan 2021. 20Community Domain: Low Neighborhood Attachment and Community Disorganization
Registered and Not Voting in the November Election
70
60
50
40
Percent 30
20
10
0
Kitsap County Counties Like Us State National
2008 2009 2010 2011 2012 2013 2014 2015 2016 2017 2018 2019
National 10.4 30.1 13.2 33.5 34.2 43.2
State 15.4 49.1 28.8 47.1 18.8 54.7 45.8 61.6 21.2 62.9 28.2 54.8
Counties Like Us 14.6 51.0 29.5 48.3 19.7 55.9 46.7 63.1 22.3 64.6 29.9 58.1
Kitsap County 13.0 46.3 26.5 45.4 17.9 50.5 44.0 61.8 21.6 61.5 27.6 56.1
Not Voting 18,809 65,942 38,049 66,596 27,330 77,582 67,911 95,415 35,998 100,914 46,543 98,168
Reg'd Voters 144,690 142,450 143,796 146,593 152,681 153,736 154,462 154,355 166,501 164,041 168,827 174,867
Note: The persons registered to vote in the November elections but not voting, per 100 adults (age 18 and over) registered to
vote. As part of the November Current Population Survey (the Voting and Registration Supplement), the Bureau of the Census
collects data on voting and registration in years with presidential or congressional elections (i.e. every other year).
State Source: Office of the Secretary of State, Elections Division, Registered Voters
Population Estimates: Washington State Office of Financial Management, Forecasting Division
National Source: Calculated using data from U.S. Census Bureau, Statistical Abstract of the United States; "Voting-Age Population,
Percent Reporting Registered, and Voted"
Updated: 04/14/2020
Washington State Department of Social and Health Services
Research and Data Analysis,
Community Outcome and Risk Evaluation Geographic Information System (CORE-GIS). County Reports, Jan 2021. 21Family Domain: Family Problems
Divorce
7.0
6.0
5.0
4.0
Rate Per 3.0
1,000
2.0
1.0
0.0
Kitsap County Counties Like Us State
2008 2009 2010 2011 2012 2013 2014 2015 2016 2017 2018 2019
State 4.8 4.9 5.2 5.1 4.9 4.8 4.6 4.4 4.4 4.3 4.1 3.9
Counties Like Us 5.2 5.1 5.5 5.4 5.0 5.1 4.6 4.4 4.5 4.4 3.8 4.0
Kitsap County 5.8 5.4 5.7 5.6 5.4 5.5 5.2 5.1 4.8 5.0 4.5 4.6
Divorces 1,173 1,095 1,170 1,157 1,127 1,150 1,087 1,079 1,025 1,072 973 1,006
Persons, 15+ 202,565 204,499 205,176 208,095 208,545 207,950 209,596 211,654 215,014 215,989 218,261 220,381
Note: The divorces per 1,000 persons (age 15 and over). Divorce includes dissolutions, annulments, and unknown decree types; it
does not include legal separations. Divorce data on this page is reported by Person 1's county of residence at the time of decree. If
Person 1 lived outside Washington, then Person 2's county of residence is used. If neither party to the decree has a reported
county of residence in Washington State, the event is not assigned to a county, but is included in the state rate. Data prior to 2018
was recorded as "husband" & "wife", with the wife's county of residence used first and the husband's used second if the wife's
county of residence was not in Washington State. Suppression code definitions for yearly rates are explained in Technical Notes.
State Source: Department of Health, Center for Health Statistics, Dissolution and Annulment Data.
Population Estimates: Washington State Office of Financial Management, Forecasting Division
Updated: 10/29/2020
Washington State Department of Social and Health Services
Research and Data Analysis,
Community Outcome and Risk Evaluation Geographic Information System (CORE-GIS). County Reports, Jan 2021. 22Family Domain: Family Problems
Victims of Child Abuse and Neglect in Accepted Referrals
70
60
50
40
Rate Per
30
1,000
20
10
0
Kitsap County Counties Like Us State National
2008 2009 2010 2011 2012 2013 2014 2015 2016 2017 2018 2019
National 49.4 48.1 44.5 41.9 52.1 52.6 51.1 55.2 56.9 58.2 59.0
State 31.6 32.0 31.8 33.9 34.3 34.4 32.4 31.9 34.0 37.8 39.2 37.9
Counties Like Us 31.1 32.7 29.8 31.6 32.6 32.5 31.1 31.2 33.6 37.9 40.2 40.6
Kitsap County 28.5 34.3 32.7 32.7 32.7 33.4 29.8 29.0 29.7 32.5 35.0 30.8
Accepted Victims 1,652 1,964 1,846 1,816 1,795 1,806 1,608 1,570 1,620 1,792 1,940 1,716
Persons, birth-17 57,937 57,267 56,499 55,521 54,847 54,075 53,948 54,177 54,599 55,135 55,417 55,679
Note: The children (age birth-17) identified as victims in reports to Child Protective Services that were accepted for further action,
per 1,000 children (age birth-17). A "referral" is a report of suspected child abuse which may have multiple listed victims.
Mandated reporters, such as doctors, nurses, psychologists, pharmacists, teachers, child care providers, and social service
counselors, notify Child Protective Services if they suspect a child is in danger of negligent treatment, physical abuse, sexual
abuse, or other maltreatment. In addition, other concerned individuals may report suspected child abuse cases. If the
information provided meets the sufficiency screen, the referral is accepted for further action. A referral may have one or more
children identified as victims. Children are counted more than once if they are reported as a victim more than once during the
year. The data in this report are based on the total number of victims reported in Child Protective Services referrals. Child location
is derived from the residence at the time of referral. Suppression code definitions for yearly rates are explained in Technical
Notes.
State Source: Department of Social and Health Services, Children's Administration FamLink Data Warehouse.
Population Estimates: Washington State Office of Financial Management, Forecasting Division
National Source: US Department of Health and Human Services Administration for Children and Families, Voluntary Cooperative
Information System (VCIS), and estimates from Adoption, Foster Care Analysis Reporting System (AFCARS)
Updated: 05/11/2020
Washington State Department of Social and Health Services
Research and Data Analysis,
Community Outcome and Risk Evaluation Geographic Information System (CORE-GIS). County Reports, Jan 2021. 23School Domain: Academic Achievement
Poor Academic Performance, Grade 10
As of 2015, the High School Proficiency Exam (HSPE) and the Measurements of Student Progress (MSP) have been
discontinued. Currently Smarter Balanced Assessment (SBA) is being administered. These historical data will be
removed, when several years of SBA data has accumulated.
90
80
70
60
50
Percent
40
30
20
10
0
Kitsap County Counties Like Us State
2008 2009 2010 2011 2012 2013 2014 2015 2016 2017 2018 2019
State 62.8 65.0 75.6 50.9 40.1 31.6
Counties Like Us 64.4 67.6 77.5 53.0 43.7 33.9
Kitsap County 59.9 63.3 71.7 45.5 34.3 26.1
Low Scorers 1,420 1,285 2,705 1,170 864 639
Tested, 10th grade 2,370 2,031 3,772 2,574 2,521 2,447
Note: The students tested who failed one or more content areas as a percent of all students tested at the 10th grade level. Some
districts have chosen to test students in both grades 9 and 10 for the 10th grade assessment. All students being tested at the 10th
grade level are included in these data regardless of their grade placement. Tests are given in the spring of the year. For example,
data for 2016 is for students in the 10th grade during the school year 2015/2016. By contractual agreement with OSPI, any rates
above 95% will be listed as >95% or "Greater than 95%", any rates below 5% will be listed asSchool Domain: Academic Achievement
Poor Academic Performance, Grade 7
As of 2015, the High School Proficiency Exam (HSPE) and the Measurements of Student Progress (MSP) have been
discontinued. Currently Smarter Balanced Assessment (SBA) is being administered. These historical data will be
70 removed, when several years of SBA data has accumulated.
60
50
40
Percent 30
20
10
0
Kitsap County Counties Like Us State
2008 2009 2010 2011 2012 2013 2014 2015 2016 2017 2018 2019
State 57.4 58.3 56.4 57.0 49.6 47.8
Counties Like Us 59.7 60.8 59.4 59.6 52.5 51.3
Kitsap County 54.8 56.1 56.1 57.5 50.1 44.5
Low Scorers 1,590 1,573 1,559 1,531 1,306 1,120
Tested, 7th grade 2,903 2,806 2,778 2,662 2,605 2,519
Note: The students tested who failed one or more content areas as a percent of all students tested at the 7th grade level. Tests
are given in the spring of the year. Data for 2016 is for students in the 7th grade during the school year 2015/2016 By contractual
agreement with OSPI, any rates above 95% will be listed as >95% or "Greater than 95%", any rates below 5% will be listed asSchool Domain: Academic Achievement
Poor Academic Performance, Grade 4
As of 2015, the High School Proficiency Exam (HSPE) and the Measurements of Student Progress (MSP) have been
discontinued. Currently Smarter Balanced Assessment (SBA) is being administered. These historical data will be
removed, when several years of SBA data has accumulated.
70
60
50
40
Percent
30
20
10
0
Kitsap County Counties Like Us State
2008 2009 2010 2011 2012 2013 2014 2015 2016 2017 2018 2019
State 56.5 58.3 59.8 55.0 54.3 51.7
Counties Like Us 57.6 59.5 63.1 57.4 57.0 54.3
Kitsap County 53.4 54.7 55.5 51.6 49.2 48.8
Low Scorers 1,423 1,432 1,462 1,391 1,255 1,237
Tested, 4th grade 2,663 2,620 2,633 2,698 2,550 2,536
Note: The students tested who failed one or more content areas as a percent of all students tested at the 4th grade level. Tests
are given in the spring of the year. Data for 2016 is for students in the 4th grade during the school year 2015/2016 By contractual
agreement with OSPI, any rates above 95% will be listed as >95% or "Greater than 95%", any rates below 5% will be listed asSchool Domain: Academic Achievement
High School Cohort (Cumulative) Dropouts
Estimated Cohort Method Adjusted Freshman Cohort Method
30
25
20
Percent
15
10
5
0
Kitsap County Counties Like Us State National
2008 2009 2010 2011 2012 2013 2014 2015 2016 2017 2018 2019
National 25.3 24.5 21.8 21.0 19.5 18.3 16.9 16.6
State 21.4 19.4 17.6 13.9 13.6 13.0 12.3 11.9 11.7 11.5 11.2 11.2
Counties Like Us 19.8 17.5 15.3 12.7 13.3 12.4 12.8 11.8 12.1 12.1 9.9 9.0
Kitsap County 12.4 12.2 9.1 8.4 9.0 8.0 10.1 9.2 8.3 8.9 8.9 6.3
410.00 404.00 282.00 . . . . . . . . .
13038 12726 12152 . . . . . . . . .
Note: The percent of students dropping out prior to graduation. The High School Cohort Dropout rate (may also be referred to as
the longitudinal, cumulative, or freshmen cohort dropout rate) measures what happens to a single group (or cohort) of students
over a period of time. This rate is most useful for seeing the long-term impact on the community. The Estimated Cohort (old
method) rate formula used data from multiple grades in a single year. The Adjusted Cohort (new method) rate is the number of
students in the same freshman cohort dropping out prior to graduation divided by the adjusted freshman class cohort of the
graduates. Beginning with the 9-grade cohort due to graduate in the 2010/2011 school year, OSPI has started using the actual
cohort of students for their calculations. Differences in rates from 2010 to 2011 are likely to be influenced by the change in
computation method. By contractual agreement with OSPI, any rates above 95% will be listed as >95% or "Greater than 95%", any
rates below 5% will be listed asSchool Domain: Academic Achievement
Annual (Event) Dropouts
6
5
4
Percent
3
2
1
0
Kitsap County Counties Like Us State National
2007 2008 2009 2010 2011 2012 2013 2014 2015 2016 2017 2018
National 4.4 4.1 4.1 3.4 3.3 3.3 4.9 4.8 4.7 4.7
State 5.2 5.1 4.5 3.8 3.7 3.5 3.6 3.4 4.4 4.5
Counties Like UsSchool Domain: Academic Achievement
Protective Factor:
On-time Graduation
Estimated Cohort Method Adjusted Freshman Cohort Method
100
90
80
70
60
Percent 50
40
30
20
10
0
Kitsap County Counties Like Us State National
2008 2009 2010 2011 2012 2013 2014 2015 2016 2017 2018 2019
National 74.7 75.5 78.2 79.0 80.5 81.7 83.1 84.6 84.8 85.3
State 72.0 73.5 76.5 76.6 77.2 76.0 77.2 78.1 79.1 79.3 80.9 81.0
Counties Like Us 73.3 74.3 78.1 78.1 77.5 77.4 76.7 78.2 78.6 78.8 84.0 84.7
Kitsap County 83.0 76.9 87.3 81.0 81.0 80.8 81.2 81.8 81.6 82.2 87.3 87.5
Note: The percent of students who graduate in four years by completion of the graduation requirements. The Adjusted Cohort
(new method) rate divides the number of students in the same freshman cohort graduating in their fourth year by the adjusted
freshman cohort for those students. In this method there are no adjustments for students in Special Education or English
Language Learners who are expected to take longer; additionally, students transferring from out of state or other districts who
are credit deficient may not be reclassified into a lower grade. Prior to 2011 the Estimated Cohort method used a complex
formula to estimate the graduation rate from data for multiple grades during the graduation year. Differences in rates from 2010
to 2011 are likely to be influenced by the change in computation methods. By contractual agreement with OSPI, any rates above
95% will be listed as >95% or "Greater than 95%", any rates below 5% will be listed asSchool Domain: Academic Achievement
Protective Factor:
Extended Graduation
Estimated Cohort Method Adjusted Freshman Cohort Method
120
100
80
Percent 60
40
20
0
Kitsap County Counties Like Us State
2008 2009 2010 2011 2012 2013 2014 2015 2016 2017 2018 2019
State 77.1 79.2 82.6 78.2 78.9 78.8 79.9 81.1 81.9 82.4 82.7 83.8
Counties Like Us 79.1 80.5 84.9 79.6 80.3 80.6 80.7 80.7 82.7 81.9 88.1 88.8
Kitsap County 89.6 83.8 96.3 85.1 84.5 84.1 86.2 84.4 86.9 86.4 93.0 91.7
Note: The percent of students who graduate including those students who stay in school and take more than four years to
complete their degree. The Estimated Cohort (old method) Extended Graduation rate formula is: (the number of on-time and late
graduates in the same year)/(the number of on-time graduates divided by the on-time graduation rate). The Adjusted Cohort
(new method) rate is the number of students graduating within five years divided by the adjusted freshman cohort for the
graduates. The new method does not include graduates after year 5 in the extended graduation rate. Differences in rates from
2010 to 2011 are likely to be influenced by the change in computation method. By contractual agreement with OSPI, any rates
above 95% will be listed as >95% or "Greater than 95%", any rates below 5% will be listed asSchool Domain: Academic Achievement
Protective Factor: Five year rates not available
Successful Academic Performance in Math, Grades 3-5
70
60
50
40
Percent 30
20
10
0
Kitsap County Counties Like Us State
2008 2009 2010 2011 2012 2013 2014 2015 2016 2017 2018 2019
State 55.3 50.4 49.9 50.7
Counties Like Us 52.8 48.1 47.7 47.7
Kitsap County 61.2 53.6 53.2 54.9
Met Standard 4,737 4,393 4,426 5,913
Tested, 11th grade 7,737 8,190 8,323 10,764
Note: The students tested in grades 3 to 5 who met the Smarter Balanced Assessment (SBA) Math standard as a percent of all
students who chose to test in grades 3 to 5. Tests are given in the spring of the year. For example, data for 2016 is for students
during the school year 2015/2016. By contractual agreement with OSPI, any rates above 95% will be listed as > 95%, "Greater
than 95%", any rates below 5% will be listed as < 5%, and data is suppressed when less than ten students were tested to avoid
individual student identification. OSPI does not consider the Smarter Balanced Assessment (SBA) and Measurements of Student
Progress (MSP) equivalent and advises against directly comparing the results of the two tests.
State Source: Office of Superintendent of Public Instruction, Instructional Programs, Curriculum and Assessment, Grades 3-5
Meeting Math Standard, Smarter Balanced Assessment.
Updated: 02/05/2020
Washington State Department of Social and Health Services
Research and Data Analysis,
Community Outcome and Risk Evaluation Geographic Information System (CORE-GIS). County Reports, Jan 2021. 31You can also read