Land use and management effects on soil carbon in U.S. Lake States, with emphasis on forestry, fire, and reforestation
←
→
Page content transcription
If your browser does not render page correctly, please read the page content below
Ecological Applications, 0(0), 2021, e02356
© 2021 by the Ecological Society of America

          Land use and management effects on soil carbon in U.S. Lake
            States, with emphasis on forestry, fire, and reforestation
              L. E. NAVE,1,2,6 K. DELYSER,3 G. M. DOMKE,4 M. K. JANOWIAK,2,5 T. A. ONTL                 ,2 E. SPRAGUE,3
                                         B. F. WALTERS,4 AND C. W. SWANSTON2,5
    1
        Department of Ecology and Evolutionary Biology, Biological Station, University of Michigan, Pellston, Michigan 49769 USA
           2
             Northern Institute of Applied Climate Science, Michigan Technological University, Houghton, Michigan 49905 USA
                                              3
                                                American Forests, Washington, DC 20005 USA
                            4
                              USDA-Forest Service, Northern Research Station, St. Paul, Minnesota 55108 USA
                            5
                              USDA-Forest Service, Northern Research Station, Houghton, Michigan 49905 USA

               Citation: Nave, L. E., K. DeLyser, G. M. Domke, M. K. Janowiak, T. A. Ontl, E. Sprague, B. F. Walters,
               and C. W. Swanston. 2021. Land use and management effects on soil carbon in U.S. Lake States, with
               emphasis on forestry, fire, and reforestation. Ecological Applications 00(00):e02356. 10.1002/eap.2356

                   Abstract. There is growing need to quantify and communicate how land use and manage-
               ment activities influence soil organic carbon (SOC) at scales relevant to, and in the tangible con-
               trol of landowners and forest managers. The continued proliferation of publications and growth
               of data sets, data synthesis and meta-analysis approaches allows the application of powerful
               tools to such questions at ever finer scales. In this analysis, we combined a literature review and
               effect-size meta-analysis with two large, independent, observational databases to assess how
               land use and management impact SOC stocks, primarily with regards to forest land uses. We
               performed this work for the (Great Lakes) U.S. Lake States, which comprise 6% of the land
               area, but 7% of the forest and 9% of the forest SOC in the United States, as the second in a series
               of ecoregional SOC assessments. Most importantly, our analysis indicates that natural factors,
               such as soil texture and parent material, exert more control over SOC stocks than land use or
               management. With that for context, our analysis also indicates which natural factors most influ-
               ence management impacts on SOC storage. We report an overall trend of significantly dimin-
               ished topsoil SOC stocks with harvesting, consistent across all three data sets, while also
               demonstrating how certain sites and soils diverge from this pattern, including some that show
               opposite trends. Impacts of fire grossly mirror those of harvesting, with declines near the top of
               the profile, but potential gains at depth and no net change when considering the whole profile.
               Land use changes showing significant SOC impacts are limited to reforestation on barren min-
               ing substrates (large and variable gains) and conversion of native forest to cultivation (losses).
               We describe patterns within the observational data that reveal the physical basis for preferential
               land use, e.g., cultivation of soils with the most favorable physical properties, and forest planta-
               tion establishment on the most marginal soils, and use these patterns to identify management
               opportunities and considerations. We also qualify our results with ratings of confidence, based
               on their degree of support across approaches, and offer concise, defensible tactics for adapting
               management operations to site-specific criteria and SOC vulnerability.
                  Key words: best management practices; carbon management; forest harvest; meta-analysis.

                                                                     greenhouse gas accounting, mitigation of atmospheric
                          INTRODUCTION
                                                                     CO2 pollution, and climate change, policy and manage-
  Soil organic matter (SOM) is critical to agricultural              ment professionals are justifiably concerned with the
and forest productivity (Vance 2000). In soils, SOM and              potential for land use and forest management to impact
the organic carbon (SOC) that is its principal constituent           SOC and SOM (Harden et al. 2018).
are vital to many biogeochemical, hydrologic, and other                 Many broad reviews have reported that land use and
ecosystem services that are foundational to ecosystems               forest management impact SOC (e.g., Post and Kwon
themselves, and the fiber, fuel, and food resources that             2000, Certini 2005, Jandl et al. 2007, Smith et al. 2016).
they provide humanity (Nave et al. 2019a). Recognizing               Indeed, research synthesizing information on SOC man-
the roles that SOC and SOM play on the site (i.e., within            agement impacts has reached a point that it is now pos-
the ecosystem), and in larger-scale issues such as                   sible to review reviews (Dignac et al. 2017, Mayer et al.
                                                                     2020). This maturation of SOC management syntheses
  Manuscript received 26 October 2020; revised 9 December            provides some strong foundations for general under-
2020; accepted 14 January 2021. Corresponding Editor:                standing, and has been sufficient in some cases to quan-
Yude Pan.
  6
    E-mail: lukenave@umich.edu                                       tify SOC impacts and their uncertainties in response to

                                                        Article e02356; page 1
Ecological Applications Article e02356; page 2 L. E. NAVE ET AL. Vol. 0, No. 0 forestry, fires, reforestation, and other forest-related The U.S. Lake States, i.e., those with extensive Great land use and management activities at broad scales Lakes shorelines and abundant inland lakes, may (Laganiere et al. 2010, Nave et al. 2010, 2011, Thiffault appear on the surface a rather provincial, limited arena et al. 2011, Lorenz and Lal 2014). The value of these for a multi-methods synthesis of land use and manage- generalizations from SOC management syntheses is con- ment impacts on SOC. However, even in its narrowest siderable. However, the papers that have generated these definition, this region is composed of three states (Min- foundations of our current understanding share one nesota, Wisconsin, and Michigan), that span over 3 bil- common, problematic finding: they recognize that place lion years of bedrock geology (King and Beikman matters, at some scale in the wide gap between broad 1974), have areas that were glaciated during the Quater- synthesis and site-specific study. Definitive exceptions nary either not at all or repeatedly up until less than exist to many generalized rules, and even the strongest 10,000 yr ago (Leverett 1932), span fivefold mean generalizations can be irrelevant, inaccurate, or out of annual temperature (MAT) and twofold mean annual context when applied to a specific ecoregion, landscape, precipitation (MAP) gradients (Midwestern Regional or project. There is thus need to harness the synthesis Climate Center 2020), include soils from 8 of the 12 tools that so effectively address questions of SOC man- USDA Taxonomic Orders (Soil Survey Staff 2020a), agement at broad patterns, at scales that apply to more and range from central interior deciduous forest, to bor- targeted decision making by land users, forest managers, eal conifer forest and wetlands, to savannah and park- and policy makers. land, to tallgrass prairie (McNab et al. 2007). These It is now possible to use synthesis techniques to three states, at 6% of the land area in the conterminous address SOC management at intermediate, and indeed United States (CONUS), represent 7% of the forest area increasingly localized, scales. This potential exists due and 9% of forest SOC stocks to 1 m (Domke et al. to the abundance of information now available and 2017), and comprise a significant forestry industry, the flexibility of the tools themselves. For example, employing >125,000 people and with an annual eco- meta-analysis synthesizes individual studies differing in nomic output of US$60 billion (Swanston et al. 2018). many ways, but each possessing paired comparisons Thus, at a national level, the influence of the U.S. Lake (treatments) to reveal overall patterns and sources of States on forest C is outsized to their area, and their variation (Hedges et al. 1999). The ability of meta- wide-ranging lands and management regimes make analysis to quantitatively synthesize individual studies them a worthy target for an ecoregional assessment that with their own unique designs makes it a robust tool addresses place-based uniqueness, and downscales gen- for identifying trends operating across those sites, and eralizations to scales where they may be applicable. Fur- at rooting out sources of variation between them. thermore, the physiography, soils, and ecosystems of the However, even large meta-analyses are constrained by U.S. Lake States bear much in common with two of the the origins of the studies they synthesize, making them three most important forested provinces of Canada good for knowing what is happening at select sites, (Ontario and Quebec), where land use and management but unable to extend their inferences into the vast considerations are largely similar. In this regard, an intervening spaces where the diversity of soils, ecosys- ecoregional assessment focused on the U.S. side of the tems, and management regimes remains unrepresented international border may nonetheless be applicable on (Gurevitch et al. 2001). In light of this limitation, it is the other, just as studies from similar ecosystems in possible to validate and contextualize these “intensive Canada can inform practices and impacts in the United site” meta-analysis results with observational data col- States (e.g., Kishchuk et al. 2016). lected much more widely, such as through soil survey In general, land use and management can affect SOC or national forest inventory programs. Observational stocks via a range of mechanisms. The most direct and data sets lack experimental control, may not possess negative mechanisms are the oxidation of SOC (through desired ancillary variables, and incorporate sources of fire) and the physical destruction of soil structure that variation that may obscure or confound the true treat- protects SOM from decomposition (Six et al. 2002, von ments of interest (e.g., types of management). Lutzow et al. 2006). The latter occurs when soils are Nonetheless, such data sets allow for treatment com- physically mixed (e.g., through agricultural tillage or parisons over much wider areas, and ancillary vari- removal for mining activities), can occur when soils are ables can be harmonized from additional sources to compacted or displaced by mechanized forestry opera- create synthesis data sets that complement the more tions, and may occur with fire if soil heating is sufficient direct meta-analysis in scale, scope, and approach. to eliminate SOM from structural elements such as aggre- This particular combination of scientific approaches gates (Six et al. 2000, DeGryze et al. 2004, Bormann et al. has proven useful in moving from broad patterns (e.g., 2008, Shabaga et al. 2017). These direct impacts can lead Nave et al. 2010, 2018) to the specific soils, land- to sustained, indirect SOC decreases through wind and scapes, and land use and management regimes of dis- water erosion, especially for cultivated, burned, or tinct ecoregions (Nave et al. 2019b), and holds the severely harvest impacted soils that lack litter or vegeta- potential to produce more nuanced applications in tive cover (Certini 2005, McLauchlan 2006, McEachran many more. et al. 2018). Other indirect, continuous mechanisms for
Xxxxx 2021                           MANAGEMENT EFFECTS ON SOIL CARBON                                Article e02356; page 3

SOC loss may include (1) a period of diminished organic         (Fig. 1). Ecological Sections tier immediately beneath
matter inputs, e.g., through tree mortality, agriculture, or    the Province level in the U.S. Department of
forest harvest removals; (2) increased soil temperature         Agriculture-Forest Service (USDA-FS) ECOMAP hier-
and moisture that stimulate decomposition, e.g., through        archical ecosystem classification system (Cleland et al.
loss of shading or litter cover; (3) biogeochemical mecha-      1997, McNab et al. 2007). Thus, these three states
nisms, e.g., pH changes that increase enzyme or substrate       include a total of 22 sections, some of which extend into
availability or bacterial activity, incorporation of labile C   portions of adjacent states (North Dakota, South
into previously stable SOM via leaching, root or fungal         Dakota, Iowa, Illinois, Indiana, Ohio) possessing the
exudation (Baath et al. 1995, Andersson and Nilsson             same climate and physiography. This approach allowed
2001, Ussiri and Johnson 2007, Johnson et al. 2010, Sle-        a potentially wider geographic scope from which to syn-
sak et al. 2010, Slesak 2013, Ojanen et al. 2017, Adkins        thesize data, while ensuring that data falling outside of
et al. 2020). Land use and management also have some            the three states’ political boundaries were still represen-
potential to increase SOC stocks through mechanisms             tative of climatic, physiographic, soil, and vegetation
that are the reverse of these negative impacts. For exam-       characteristics present within them. Section-specific
ple, minimizing soil disturbance and erosion through less       descriptions are beyond the scope of this paper and are
frequent tillage or the protection of the soil surface, pro-    available in McNab et al. (2007). Broadly, the study
moting vegetation that sustains or increases organic mat-       area records a long-running historical geology from
ter inputs to the soil, and directly adding (or                 some of Earth’s oldest bedrock (Precambrian volcanics
redistributing) surface organic matter are associated with      nearly 4 billion years old) exposed on the Canadian
sustained or increased SOC stocks in agricultural and for-      Shield of its northwestern extent, to more recent
est soils (Vance 2000, Guo and Gifford 2002). In the U.S.       (30 m thick and ranging in depositional age from
tle biogeochemical shifts after a light forest harvest at the   tens of millions to 240,000 inland lakes and ponds and >130,000 km of
knowledge gaps, not least including why some appear to          perennial streams and rivers (USGS 2020), soils from 8
be more important in some settings than others. In this         of 12 USDA Taxonomic Orders are represented (Soil
regard the mechanistic literature is much like the review       Survey Staff 2020a). Organic soils (Histosols) occupy
literature on SOC management, in that both will benefit         approximately 1% of the study area and are extensive in
from analyses targeted at intermediate scales.                  low-lying and poorly drained landscape positions; Enti-
   The present study is intended to narrow the applied          sols (10–15%), Inceptisols (5–10%), and Spodosols (10–
science knowledge gap in the realm of land use, forest          15%) have formed in relatively younger and/or coarser
management, and SOC in the U.S. Lake States, and was            parent materials, and Alfisols (35–40%), Mollisols (25–
motivated by four objectives. First, place land use and         30%), Vertisols (1%), and Ultisols (
Ecological Applications
Article e02356; page 4 L. E. NAVE ET AL. Vol. 0, No. 0
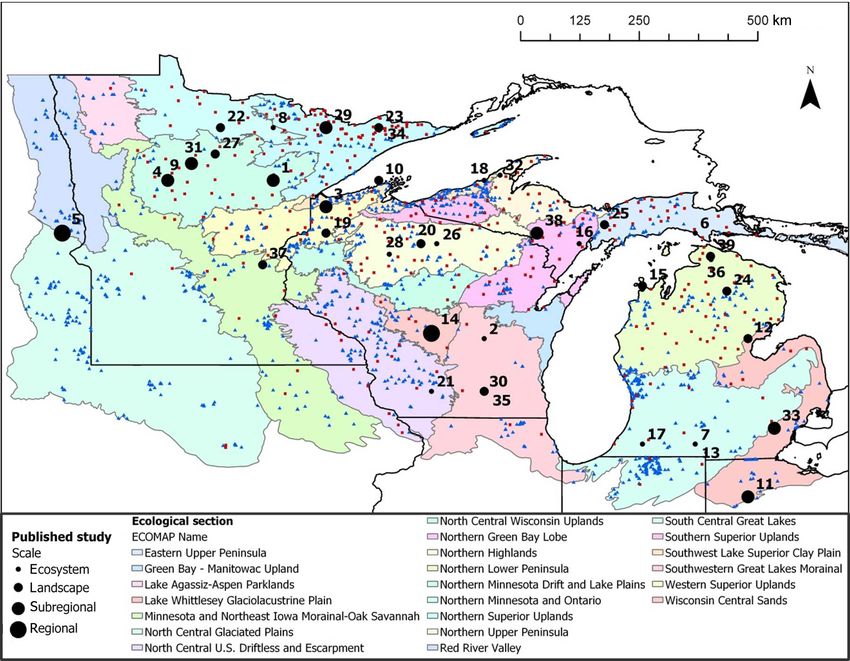
FIG. 1. Map of study area. Shaded polygons are USDA-FS ECOMAP sections. Numbered point locations, which are approxi-
mate, represent papers reviewed for the meta-analysis. The two smaller point sizes are locations of studies with ecosystem-specific
and landscape-level designs, respectively; the two larger point sizes are locations of studies with sites arrayed across a subregional
or regional scale, respectively (see Appendix S1: Table S1). Blue triangles and red squares show locations of NRCS pedons, and
FIA plots (approximate), respectively.
thinning, regeneration harvest cycles in plantation coni- tactics of forest C management. Data sets supporting
fers (Bates et al. 1993, Gerlach et al. 2002, Stone 2002, these components are available via the University of
Palik et al. 2003, Gahagan et al. 2015). In the southern Michigan Research and Data Hub (available online).7
approximately one-half of the study area, the predomi-
nant (agricultural) land uses are cultivated row crops,
Meta-analysis
increasingly irrigated in western or coarse-soiled areas,
or tile-drained in southeastern areas with finer soils, and We synthesized data from 39 papers identified
pasture or hayland (USDA 2015). through literature review, which are summarized in
Appendix S1: Table S1. We have described our litera-
ture review and statistical methods in past papers, and
Approach
detail them in Appendix S1: Section S1.1. In brief, we
In this analysis, we applied and refined methods limited our searches to 2008–2019, in order to add the
described previously (Nave et al. 2010, 2013, 2018, papers found through new searches to those already in
2019b, Ontl et al. 2020). These methods are four-fold: our database from previous meta-analyses (Nave et al.
(1) effect size meta-analysis of data from published liter- 2009, 2010, 2011, 2013). To be included, each paper had
ature, (2) synthesis of soil pedon observations with to (1) report control and treatment values for SOC
remote sensing information, (3) analysis of national for- stocks or concentrations, (2) provide adequate metadata
est inventory (NFI) data from plots in which soils, bio- to constrain locations and use as potential predictor
mass, and other ecosystem properties were measured,
7
(4) literature review of strategies, approaches, and https://mfield.umich.edu.Xxxxx 2021 MANAGEMENT EFFECTS ON SOIL CARBON Article e02356; page 5
variables, (3) present novel response data not included complete list of attributes extracted from, or assigned
in previous studies, and (4) be located within one of the to, the published studies. Our strategy for categorizing
22 ecoregional sections comprising our U.S. Lake States reporting depths requires specific attention here. First,
study area. Twenty publications met these criteria (of we recorded the genetic horizon (e.g., Oe, Oa, A, Bs1) or
1,638 reviewed), in addition to 19 pre-2008 publications sampling increment (as depth range in cm) for each
from our database. SOC value. Next, for soils reported as depth increments,
We extracted control and treatment SOC values from we correlated each specified depth increment to its prob-
each paper and used these to calculate effect sizes (as the able genetic horizon, based upon USDA-NRCS soil ser-
ln-transformed response ratio R). We revisited pre-2008 ies descriptions. Lastly, we created broad master
papers already in our database and performed data horizon groups (e.g., O, A, B, AEB, BC) for use as the
extraction anew, concurrently with the papers collected categorical variable corresponding to soil depth. When
through new literature searches. We used unweighted SOC was reported for depths of 50 cm or deeper, we ter-
meta-analysis to estimate effect sizes and bootstrapped med those observations “whole profiles;” when possible,
95% confidence intervals (Hedges et al. 1999) using we also summed individual reporting layers reaching
MetaWin software (Sinauer Associates, Sunderland, 50 cm or deeper to compute whole profile SOC.
Massachusetts, USA). We selected unweighted meta- Similar to Nave et al. (2019b), our efforts to obtain
analysis a priori in order to maximize data availability predictor variables and assign studies to groups were
(weighted meta-analyses require sample size and vari- more involved than past analyses (e.g., Nave et al.
ance statistics in every paper), and because we did not 2010), but we used the information essentially the same
assume that the assembled data met the parametric pre- way. Namely, we used meta-analysis to identify signifi-
conditions of a weighted meta-analysis. Treatments of cant predictors of variation in SOC responses, which is
interest included forest harvesting (and associated post- done statistically by parsing variation into within-group
harvest practices), fire management (wildfire and pre- (Qw) and between-group heterogeneity (Qb), and
scribed fire), and land use change (comparisons of inspecting corresponding P values. Grouping variables
native forests or wetlands to other land uses, e.g., culti- that have large Qb relative to Qw are significant
vation, reforestation after cultivation, wetland restora- (P < 0.05) and explain a larger share of total variation
tion, developed lands). Several papers reporting soil among all studies (Qt). However, the statistical signifi-
amendments and SOC in forests were found, but were cance of P values is only one way to assess significance
too few to analyze quantitatively. of meta-analysis results. In our meta-analysis, we were
We standardized response data using correction fac- as interested in identifying groups that are significantly
tors and prediction equations to address two common different from zero percent change (e.g., in response to
problems in the literature, namely, the occasional use of harvest), in terms of their 95% confidence intervals, as
loss on ignition (LOI) as a metric of SOM, and the we were interested in groups that were significantly dif-
reporting of SOC values as concentrations rather than ferent from each other (e.g., soil textures differing in
the SOC stocks of interest to our analysis. Our correc- their responses to harvest).
tion factors (for LOI) and prediction equations (for esti-
mating bulk density from C concentration) followed
Synthesis of pedon and remote-sensing data
methods we have used previously (Nave et al. 2019b),
and are detailed in Appendix S1. Our meta-analyses We complemented the experimental strength of meta-
were mostly aimed at using the ln-transformed response analysis, which generates high-confidence inferences for
ratios (of treatment SOC : control SOC stocks), although a limited number of sites, with a synthesis of data for
we present some results as the actual SOC stocks from >1,700 locations across the study area. These data came
the published literature. from geo-located soil pedons from the USDA-NRCS
We extracted predictor variables from each paper to National Cooperative Soil Survey (NCSS) Database,
test factors that may predict variation in SOC responses and included latitude, longitude, soil taxonomy, and
to land use or management. We looked up missing physical and chemical properties of individual genetic
information (e.g., study site characteristics) in other horizons according to Schoeneberger et al. (2012) and
publications from the same sites, or using information Burt and Soil Survey Staff (2014). Data from the NCSS
about the soil series reported from those study sites Database span many decades of soil survey; to synthe-
obtained from the web-based interface for the USDA- size geo-located pedons with remote sensing informa-
Natural Resources Conservation Service (USDA- tion, we only used pedons from 1989 to the present so
NRCS) Official Soil Series Descriptions (Soil Survey that pedons could be matched to temporally discrete
Staff 2020b). Given the lack of standardization across GIS products in the same manner as Nave et al. (2018,
studies in details such as soil sampling depth and parent 2019b). We extracted the following attributes for geo-
material, it was necessary to create categories for many located NRCS pedons, from data products detailed in
attributes, in order to parse variation within and Appendix S1: Section S1.2: land cover, aboveground
between studies into sufficiently replicated groups for biomass C stocks, mean annual temperature and precip-
meta-analysis. Appendix S1: Table S2 contains the itation (MAT and MAP, respectively), landform andEcological Applications
Article e02356; page 6 L. E. NAVE ET AL. Vol. 0, No. 0
parent material, and topographic parameters including results, we present back-transformed means and 95%
elevation, slope, aspect, and topographic wetness index. confidence intervals. We used t tests or ANOVAs (with
Our final data set for analysis included 1,709 pedons Fisher’s Least Significant Difference) to test for signifi-
(10,608 individual horizons) across the study area. cant differences between ln-transformed group means,
e.g., for harvested vs. reference forests, or for topsoil
SOC stocks for soils from different texture classes. We
NFI data set
used simple linear regressions to test for significant rela-
We further complemented our meta-analysis and tionships between continuous variables (e.g., mean
NRCS pedon + remote sensing data sets with an addi- annual temperature and SOC stock). In all cases, we set
tional, independent observational data set derived from P < 0.05 as the a priori threshold for accepting test
the USDA-FS National Forest Inventory (NFI). The results as statistically significant. In addition to these
NFI plots that are the basis for data from the Forest formal P value statistical analyses, we used the propor-
Inventory and Analysis (FIA) program derive from an tion of observed variation (e.g., in SOC stock) that
equal-probability sample of forestlands across the could be explained by a grouping (e.g., soil texture) or
CONUS. There is one permanent plot on approximately continuous (e.g., MAT) variable to rank the explanatory
every 2,400 ha across the United States, with each plot power of each individual analyzed factor, as the sum of
placed randomly within a systematic hexagonal grid squares between groups divided by the total sum of
(McRoberts et al. 2005). Soils are sampled from a subset squares (SSb/SSt). In the case of continuous relation-
of these plots, according to a protocol in which the for- ships, this fraction is approximated by dividing the
est floor is first removed, and mineral soils are then sam- regression sum of squares by the total sum of squares.
pled as depth increments of 0–10 and 10–20 cm. The
NFI plot design ensures that FIA data have no system-
RESULTS
atic bias with regard to forestland location, ownership,
composition, soil, physiographic or other factors. For
Sources of variation in forest SOC across the U.S. Lake
this analysis, we queried the FIA Database for records
States
of forest floor and mineral soil SOC stocks (Mg C/ha)
for all single-condition plots in the ECOMAP ecological Across the study area, spatial variation in forest
sections comprising the study area. We set the single- SOC stocks was most explained by soil properties
condition criterion in order to exclude plots divided including texture and taxonomic order, less so by geo-
along sharp boundaries into conditions of different graphic factors including ecosection, parent material
stand age, slope, wetness, etc., such that local variation and landform and their cross product (physiographic
in such factors would misrepresent conditions at the group), and least of all by management (Table 1).
actual location of soil sampling. As an additional con- These results were consistent whether assessed only at
straint, we only utilized the most recent observation of the surface (topsoils, A horizons) or for whole soil
each long-term NFI plot, and only plots observed since profiles. In the case of topsoils, climate parameters
2000, in order to make FIA data reasonably concurrent (MAT, MAP) and elevation were also statistically sig-
with the NRCS pedon and remote sensing data nificant predictors of variation, albeit with even less
described above. For the sake of assessing harvest predictive capacity than management. Among domi-
impacts, we used NFI plots with stand ages 25 yr as the threshold for defining recent harvest, had large SOC stocks, while Alfisols, Spodosols, and
based on the mean time since harvest of meta-analysis Entisols had smaller SOC stocks, generally in that
studies (26 yr) and our estimated time since harvest for order. Most of these differences were statistically sig-
the NRCS pedons + remote sensing information (20– nificant, whether for topsoils or whole profiles. Textu-
30 yr; see Appendix S1: Section S1.2). Altogether, our ral variation in SOC stocks was significant for topsoils
data sets for forest floors and mineral soils were based and whole profiles, with the largest SOC stocks for
on 364 and 261 NFI plots, respectively. silty to clayey soils, intermediate SOC stocks for
loamy soils, and the least SOC in sandy soils. Till,
lacustrine, and drift-mantled bedrock parent materials
Statistical analysis of NRCS and FIA data
(and ecosections where these parent materials were
To complement the nonparametric meta-analysis of extensive) had large SOC stocks, while outwash, aeo-
published literature data, we used data transformations lian, and alluvial, residual and colluvial parent materi-
and parametric statistics to analyze NRCS and FIA als (and ecosections) had small SOC stocks. In terms
data. These two observational data sets derived from of management, harvested forests had significantly
fundamentally different sources, but they were suffi- smaller topsoil SOC stocks than non-harvested forests.
ciently similar to be analyzed using a consistent set of Harvested and non-harvested forests did not differ in
techniques. Owing to their typically right-skewed distri- whole profile SOC stocks, but whole profile SOC
butions, we used ln-transformations to normalize stocks were significantly smaller for conifer plantations
response variables; in graphical representations of than harvested or non-harvested forests.Xxxxx 2021 MANAGEMENT EFFECTS ON SOIL CARBON Article e02356; page 7
TABLE 1. Predictors of soil organic carbon (SOC) stocks in and 25 cm, respectively), BC and C horizons (56 and
topsoils (A horizons; left) vs. whole soil profiles (right) for 49 cm, respectively), and whole soil profiles (73 and
forest lands across the study region, based on analysis of
NRCS pedon and harmonized remote sensing data. 86 cm, respectively). Organic horizon thicknesses did
not closely correspond across data sources, tending to
A horizons Whole profiles be considerably thicker when (infrequently) reported
SSb/ SSb/ for NRCS pedons than for published studies and FIA
Factor n SSt P n SSt P data, respectively, which corresponded closely (3 and
Texture class 688 26Ecological Applications Article e02356; page 8 L. E. NAVE ET AL. Vol. 0, No. 0 FIG. 2. Soil organic C (SOC) stocks for control vs. harvested observations from the published literature used in the (A) meta- analysis, (B) NRCS, and (C) FIA data sets. In each panel, control forests are open symbols and harvested forests are filled symbols. Plotted are sample sizes, back-transformed means and 95% CIs, and mean effect sizes (as percent change from harvest relative to control) and associated P values. FIG. 3. Proportional changes in soil C storage with harvesting, by soil texture (A), forest cover type (B), portion of the soil pro- file sampled (C), and parent material (D). Plotted are P values for Qb/Qt, means, 95% CIs, sample sizes, and dotted reference lines indicating 0% change in soil C storage. Qb/Qt indicates the ratio of between-group to total heterogeneity among response ratios. with the lack of any consistent harvest impact for other and FIA indicated that the impact of harvesting did not horizons or whole profiles, directed further exploration depend upon topsoil texture (two way ANOVA interac- to topsoils specifically, using the extensive NRCS and tion terms of P = 0.36 and P = 0.12, respectively), but FIA data. In contrast to meta-analysis (Fig. 3A), NRCS did indicate that texture itself had a significant influence
Xxxxx 2021                            MANAGEMENT EFFECTS ON SOIL CARBON                                  Article e02356; page 9

on topsoil SOC stocks (Fig. 4). Data were more limited           corresponding parent materials in the NRCS data set,
for FIA (n = 261) than NRCS (n = 698), but both data             with topsoil SOC being least for xeric (typically deep,
sets detected the same pattern of sandy topsoils holding         sandy soils such as outwash), and greatest for hydric
the least SOC. The more abundantly replicated NRCS               soils (often organic, dense till or fine glaciolacustrine
data exhibited more numerous significant textural dif-           materials). The significant overall impact of harvest on
ferences, with sands holding the least SOC, loamy sands          topsoil SOC did not depend upon physiographic group
and sandy loams having moderately small topsoil SOC              in the FIA data set.
stocks, loams, silts, and silt loams having moderately              Meta-analysis indicated that harvesting was associ-
large SOC stocks, and the finest soils having the most           ated with diminished SOC stocks under coniferous and
topsoil SOC. The occasional presence of organic materi-          mixed forest cover, but not under broadleaved forest
als in the 0–10 cm FIA reporting layer indicated that            cover. However, NRCS pedon and FIA plot data indi-
some fraction of the time, Oa horizons were collected            cated that topsoil SOC stocks, and harvest effects upon
and included in this layer, which otherwise correlated           them, did not differ by forest cover type (results not
well to the A horizons of the other two data sets                shown). Exploring the distribution of forest cover types
(Appendix S1: Section S3.2 and Table S1). With refer-            across parent materials revealed several important but
ence to meta-analysis results, the finest soil textures,         not statistically testable patterns that provide critical
which showed positive impacts of harvesting (Fig. 3A),           context for the meta-analysis results (Appendix S1:
also had the largest topsoil SOC stocks (Fig. 4A). Sandy         Fig. S1). Specifically, all published studies of coniferous/
loams, which were the only group to show a significant           mixed forests were on outwash parent materials
meta-analytic decrease with harvesting (Fig. 3A), held           (Appendix S1: Fig. S1A). This contrasted with NRCS
modest SOC stocks (Fig. 4A).                                     and FIA data, both of which indicated that coniferous
   Topsoil SOC stocks responded differently to harvest           and mixed forests were evenly distributed across parent
depending on parent material in the NRCS data set                materials (Appendix S1: Fig. S1B,C). Similarly, aeolian,
(Fig. 5A), which corroborated the meta-analysis in               alluvial/ colluvial/ residual, and bedrock parent materi-
showing that outwash soils were negatively impacted by           als were rare in the literature, but appreciable propor-
harvesting (Fig. 3D). The NRCS data set further indi-            tions of both cover types occurred on these (other)
cated that topsoil SOC stocks were smaller in outwash            parent materials in the NRCS data set. Forest Inventory
than till or glaciolacustrine parent materials. Aeolian          and Analysis physiographic groups of xeric, mesic, or
deposits, not reported in the published literature, exhib-       hydric grossly approximate the outwash, till, and glacio-
ited a negative harvest trend similar to outwash                 lacustrine parent materials for published studies and
(Fig. 5A). The meta-analytic trend of increased SOC              NRCS pedons, but due to its differing scheme, a larger
with harvesting on glaciolacustrine materials (Fig. 3D)          share of FIA data fell into the mesic category, which
was not supported by the NRCS data set. Physiographic            extends into xeric and hydric groups at its extremes.
group categories used for FIA do not explicitly identify         Whether compared to NRCS pedon or FIA plot data
parent material, but broadly mirrored the patterns for           (results not shown), there was similar evidence of

   FIG. 4. Topsoil (A horizon) SOC stocks, by texture class, in the (A) NRCS and (B) FIA data sets. Plotted are sample sizes,
back-transformed means, and 95% CIs, and lowercase letters indicating significant differences between textures within each data
set.
Ecological Applications
Article e02356; page 10                                L. E. NAVE ET AL.                                              Vol. 0, No. 0

   FIG. 5. Topsoil (A horizon) SOC stocks, by parent material in the (A) NRCS and (B) physiographic group in the FIA data
sets. Plotted are sample sizes, back-transformed means, and 95% CIs, and lowercase letters indicating significant differences
between the parent materials or physiographic groups comprising each data set. In panel A, control forests are open symbols, har-
vested forests are filled symbols, and significance of treatment (TRT) within each parent material is indicated accordingly. NS, not
significant.

publication bias in the distribution of coniferous/mixed           of which was explained by the portion of the profile
forests across soil textures. Overall, these non-testable          sampled (Fig. 6). Decreases in SOC were largest for O,
results indicated that apparent meta-analytic “conifer             intermediate for A, and least for E horizons, while B
effects” (Fig. 3B) are confounded with outwash parent              horizons showed no effect of fire, and mixtures of A, E,
materials and coarse soil textures.                                and B horizons, or B and BC horizons showed net SOC
                                                                   increases. Soil organic C stocks of whole soil profiles
                                                                   were not impacted by fire. There were no significant dif-
                Fire impacts on SOC storage
                                                                   ferences in impacts as a function of fire type (wild vs.
   Meta-analysis indicated that fires had an overall nega-         prescribed) or reported severity (high vs. low). Accord-
tive but highly variable effect on SOC storage. Sampling           ing to meta-analysis, nearly all other tested predictor
depth was the strongest predictor of this variation, 42%           variables were significant predictors of variation, though

  FIG. 6. Proportional changes in soil C storage, by portion of the profile sampled, associated with fire. Points are means, bars
are bootstrapped 95% CIs, sample sizes are in parentheses, and the dotted reference lines indicate no net change in soil C stocks.
Xxxxx 2021 MANAGEMENT EFFECTS ON SOIL CARBON Article e02356; page 11
FIG. 7. Proportional changes in soil C storage associated with land use change. Points are means, bars are bootstrapped 95%
CIs, sample sizes are in parentheses, and the dotted reference lines indicate no net change in soil C stocks. Note x-axis breaks.
with data originating from only five published papers, unvegetated “barren lands” (as defined in Appendix S1),
trends appeared to be confounded with specific studies and “pine barrens” or “barrens,” which are common
or sites. It was not possible to address fire effects on terms for low-density, Pinus-dominated forests in the
SOC storage using NRCS or FIA data. U.S. Lake States that do not meet the criteria of “barren
land” but which are also relevant to these statistical com-
parisons and their management implications. Regionally,
Land use impacts on soil C storage
of the five land uses, only barren lands had significantly
Meta-analysis indicated that most land use changes different SOC stocks, which were smaller than cultivated
had no detectable impacts on SOC storage, and those lands, forests regrowing after cultivation, plantations
that did differed in their direction, magnitude, and vari- established on (never-cultivated) native forest lands, and
ability (Fig. 7). Because O horizons were sporadically native forests (Fig. 8A). Although limited in areal extent
reported (k = 12 out of 149 total response ratios) and and thus sparsely replicated in the NRCS data set, barren
extremely variable (95% CI of effect size was 99.4%, lands corresponded to conditions captured in the meta-
+1,171%), meta-analysis trends are presented here only analytic mineland reforestation comparison, and gener-
for mineral soils. Among mineral soils, changes in SOC ally indicated a four- to fivefold potential for SOC
storage were positive but still highly variable for refor- increase, as compared to native forests. Most other tested
estation on former minelands. Paired comparisons of topsoil properties differed with land use across this gradi-
native forests (never cultivated) to cultivated lands, as a ent of intensity. Lands actively under cultivation had the
meta-analytic representation of deforestation, indicated smallest sand contents (Fig. 8B) and highest pH
significant SOC losses. Paired comparisons of forests (Fig. 8C) of all uses, while barren lands, forest planta-
recovering on formerly cultivated lands to cultivated tions, and native forests had large sand contents and low
lands, as a representation of cropland reforestation, pH. Forests regrowing on formerly cultivated lands had
indicated no significant change in SOC. Other compar- intermediate sand contents and pH. Similar trends existed
isons tested with meta-analysis, including reforestation for silt, clay, and rock contents (all ANOVA P < 0.05;
on grassland, pasture, or hayland, or comparisons of results not shown), with fine textured, low-rock soils
urban forests to lawns, suggested these land use changes being preferentially cultivated, native forests occurring on
had no net impact on SOC stocks (data not shown). coarser and rockier soils, and forest regrowth on crop-
Soil-land use observations from the NRCS data set lands occurring on intermediate textures. At the whole
corroborated one of the trends detected with meta- profile level, SOC stocks did not differ for lands under
analysis of published land use change studies and cultivation (mean = 113 Mg C/ha), forests regrowing
revealed how soil physical properties influence land use after cultivation (93 Mg C/ha), or native forest
in ways that could obscure detection of other trends using (95 Mg C/ha), but plantations and barren lands (55 and
observational data. These trends emerged from compar- 8 Mg C/ha, respectively) did differ from these land uses
isons of topsoil properties across land uses increasing in and from each other.
intensity from native forests to barren lands (Fig. 8). Par- Four ecosections had sufficient data density for statis-
enthetically, we highlight here a distinction between tical comparisons (two-way ANOVAs) aimed at probingEcological Applications
Article e02356; page 12 L. E. NAVE ET AL. Vol. 0, No. 0
FIG. 8. Topsoil (A) SOC stocks, (B) sand contents, and (C) pH from NRCS data as a function of land use. Plotted are sample
sizes, means and 95% CIs. Lowercase letters denote significant differences between land uses for each soil property.
the consistency of regional trends within distinct subre- measure of significance, and the magnitude and variabil-
gions, those being the Western Superior Uplands, ity of change as another, we can address the degree to
Northern Lower Peninsula (Michigan), South Central which our results are scientifically significant vs. mean-
Great Lakes, and North Central U.S. Driftless and ingful in an applications context. Finally, because poten-
Escarpment. Despite differing significantly from each tial applications of our work range from site-level
other in topsoil SOC stocks, silt, sand, rock, and pH, operations planning to regional- or wider-scale C
each of these distinct ecosections mostly duplicated the accounting, we can address how the implications of our
trends observed across the entire study area. Those findings may depend upon the scale of their application.
trends were cultivated topsoils having significantly smal- We organize this discussion around Table 2, which sum-
ler sand and larger silt, clay, and pH values; forest top- marizes the key findings of our synthesis.
soils having significantly larger sand and smaller silt, The most important inference of our analysis comes
clay, and pH values, and forests regrowing after cultiva- from the finding that place-based factors, such as soil
tion having intermediate values. Topsoil rock content order, texture, and physiography explain much more
was the exception, showing a significant land use 9 eco- of the variation in SOC stocks than land use or man-
section interaction. Specifically, the South Central Great agement practices. This result is significant in statisti-
Lakes and Western Superior Uplands corroborated the cal and applied terms, across scales, and as the basis
regional land use trends, the Driftless section (which for any consideration from site-level planning up to
had lower rock contents than all other sections) showed regional land sector C budgets. The controlling influ-
no difference in rock content with land use, and in ence of fundamental soil and physiographic factors on
Michigan’s Northern Lower Peninsula, cultivated top- SOC stocks argues for refining existing soil and land
soils had the largest rock contents and forests had the classification resources (e.g., soil maps, terrestrial
least rocky topsoils. ecosystem unit inventories) into tools for identifying
vulnerabilities, anticipating impacts and opportunities
in forest SOC management. Applied in this way, such
DISCUSSION
tools can be used to tailor operations according to
site-specific factors when SOC is a management prior-
Inferences and implications
ity. Acknowledging that place matters more than prac-
By using three complementary approaches to assess tice to forest SOC also demonstrates why rules of
forest management and land use effects on SOC storage thumb are problematic. Even “safe” ones, e.g., general-
in the U.S. Lake States, we are able to assess the signifi- izations from wider scale analyses such as substantial
cance and applications of our findings in three critical harvest reductions in forest floor SOC (Nave et al.
ways. First, by examining whether the three approaches 2010), do not apply to individual sites, or in the case
concur, diverge, or are ambiguous, we can qualify our of the U.S. Lake States, even entire ecoregions. Ulti-
key findings with ratings of our confidence in them. Sec- mately, even increasingly refined syntheses cannot
ond, by critically appraising statistical results as one address every condition with confidence, thus localXxxxx 2021 MANAGEMENT EFFECTS ON SOIL CARBON Article e02356; page 13
TABLE 2. Synthesis summary.
Major inference +/ Management, C accounting, and policy considerations
1. Place influences SOC more + Land use and management can only slightly change SOC within the stronger
than practice constraints and wider variation of site-specific natural factors; carbon-informed
planning and operations take into account these factors.
2. Harvest does not impact + Harvesting generally does not affect soil C in terms of ecosystem C accounting;
profile SOC policy and management may be effectively directed towards site-specific
considerations or other terms in the overall C budget.
3. Topsoil SOC is vulnerable + A 15–20% decline in SOC in the portion of the profile that represents 15–30% of
to harvest profile SOC is not significant from a C accounting perspective, but can impact C
cycling, hydrologic processes, and ecosystem productivity, especially on some
sites.
4. Outwash soils are most + Small baseline SOC stocks of outwash mean that proportional decreases have little
likely to lose topsoil C with harvest impact on ecosystem C budgets, but could have substantial impact on soil C
cycling, hydrologic processes, and ecosystem productivity.
5. Glaciolacustrine soils may gain Large baseline SOC stocks of glaciolacustrine materials mean that proportional
topsoil C with harvest increases have a potentially large impact on ecosystem C budgets, but little impact
on soil C cycling, hydrologic processes, and ecosystem productivity.
6. Intermediate-textured topsoils Caution may be most appropriate where these soils occur on outwash, with which
may lose C with harvest they are frequently (but not always) associated.
7. Fine-textured soils may gain Potential C gains may be greatest where these soils occur on glaciolacustrine parent
topsoil C with harvest materials, which may have access limitations due to wetness.
8. Fire does not change profile + Fire generally does not affect soil C in terms of ecosystem C accounting; policy and
SOC stocks management may consider interactions between altered SOC depth distribution
and other ecosystem impacts.
9. Fire may alter SOC depth Potential impacts of surface C losses on C cycling, hydrologic processes, and
distribution ecosystem productivity may be more important than C gains at depth.
10. Reforestation of minelands + Limited extent, C loss with prior conversion may temper net C gains, but positive
increases SOC impacts of increased SOC on hydrologic processes and ecosystem productivity at
the site level are important.
11. Deforestation for cropland + Widespread extent of this largely historic change had major impact on regional C
decreases SOC budget, contemporary relevance is limited.
12. Cropland reforestation has Crop-to-forest transitions have yet to exhibit net overall SOC increases; SOC
not increased SOC stocks and regional C budgets will only be positively affected if native forest SOC
levels are actually attainable after long-term cultivation.
13. Forests and cropland reforestation + Preferential cultivation of fine soils and forest allocation to coarse soils may limit
occur on coarser soils upper potential for SOC gain given overarching textural control of SOC.
14. Plantations occur on soils low in + Preferential (historic) reforestation prioritized vulnerable sites; contemporary
SOC management may incorporate SOC vulnerability and opportunity.
Note: Major inferences have more (+) or less ( ) confidence based on support across data sets; low-confidence or highly specific
inferences are omitted.
information and professionals’ personal experience will trend across our three approaches, and tailoring those
remain critical even as the science continues to provide steps towards the specific conditions in which topsoil
tools that better support the planning of management SOC losses are most likely. On average, topsoils in the
and operations. U.S. Lake States lost 17–20% of their SOC across our
Acknowledging that management has the evident three data sets, but this average value masks underly-
capacity to alter forest SOC, within the constraints of ing variation in which some soils tend to lose, and
fundamental site factors, we report with confidence indeed some topsoils tend to gain SOC with harvest-
that harvesting on average has no impact on whole ing. The statistically significant average condition, rep-
profile SOC. Given this, the soil as a component of a resented by even a 20% reduction in topsoil SOC, still
forest ecosystem, of which the fundamental unit is the has no applied significance to C accounting, given that
pedon or profile, is not affected from an ecosystem C topsoils hold 15–30% of profile total SOC stocks. It is
accounting perspective. The resistance of profile SOC significant in its application to the site, where a
to harvest impacts may allow those concerned with decrease of this magnitude could negatively impact
forest management, policy, and C accounting in the hydrologic, biogeochemical, and other ecosystem func-
U.S. Lake States to focus on more uncertain terms in tions tied intimately to SOC (Vance et al. 2014, 2018).
the forest sector C budget, such as the fate of har- In this context, the apparent vulnerability of topsoil
vested wood products (Domke et al. 2012, Smyth SOC to harvest is highly relevant to professionals con-
et al. 2018), or on more specific considerations. Such cerned with the site itself and its long term trajectories,
considerations may include steps to protect against especially on soils and sites identified as particularly
topsoil SOC losses, which emerged as a robust general vulnerable.Ecological Applications Article e02356; page 14 L. E. NAVE ET AL. Vol. 0, No. 0 If topsoil SOC losses can be considered a “rule of Literature examining fire effects on soils highlights thumb,” then expecting these overall average losses will the rarity of long-term studies, especially for regions in only be appropriate in rare cases in the U.S. Lake States which fires play modest and/or suppressed roles in where site-specific information is not available. On the ecosystem disturbance regimes, such as the U.S. Lake other hand, if topsoil SOC losses are treated as an indi- States (Bedison et al. 2010, Miesel et al. 2012, Patel et al. cation of risk, to be mitigated as appropriate through 2019). Our inferences into fire impacts on SOC storage operational adjustments, then soil parent material and are limited by this lack of research, and by our inability texture information will inform the need for site- or to use NRCS or FIA data to assess fires using an obser- project-specific adjustments. Our findings related to vational design. Nonetheless, our meta-analysis demon- specific parent materials and textures range from high to strates that fire does impact SOC, albeit highly variably medium confidence, given their level of support across and in ways that must be considered in whole-soil con- data sets. We have high confidence that soils formed in text. Profile total SOC stocks are generally not affected outwash are most likely to exhibit topsoil SOC losses, by fire, but this overall average result masks fire- because this result emerged clearly from both meta- induced changes in the depth distribution of SOC. On analysis (Fig. 3D) and NRCS pedon (Fig. 5A) data sets. average, surface horizons, especially O and A horizons, Our methods cannot identify mechanisms for the vulner- exhibit statistically and ecologically significant SOC ability of topsoil SOC in outwash soils, but these may declines, even as deeper soils show no net change or even include the fragile soil structure, wide climatic extremes, SOC increases (Fig. 6). Given that post-fire recovery of and indirect relationships with water holding capacity ecosystems services can be inhibited by the loss of sur- and plant nutrient cycling that tend to place outwash face organic matter (Neary et al. 1999, Certini 2005), the sites on the low-productivity end of the spectrum in the net impact of this surface-loss–subsurface-gain pattern U.S. Lake States (Koerper and Richardson 1980, Host may be negative from other standpoints, even if its over- et al. 1988, Powers et al. 2005, Nave et al. 2017). Further all SOC effects are neutral. In addition, fire-driven to our high confidence in topsoil SOC declines on out- changes in SOM composition that are in addition to (or wash, we have medium confidence that intermediate- independent of) changes in SOC amount can have textured soils, particularly sandy loams, which are fre- important ecosystem consequences, including altering quently associated with outwash materials, are likely to the overall residence time SOC and its role in nutrient or exhibit topsoil SOC losses. Our confidence in this infer- pollutant sorption (Kolka et al. 2014, Miesel et al. ence is only medium as the meta-analytic pattern 2015). Ideally, additional research may reveal factors (Fig. 3A) was not supported by the extensive NRCS or mediating SOC responses to fire that we were unable to FIA soil texture data (Fig. 4). address with our meta-analysis, but this is anything but In contrast to the apparent vulnerability of topsoil C in certain. It is well known to fire managers that factors outwash and intermediate-textured topsoils, we have influencing fire behavior, even when known, are highly medium confidence that harvesting on the finest-textured dynamic, spatially variable, and hence difficult to pre- soils, which usually occur on glaciolacustrine parent dict. Topography, meteorological conditions of the year, materials, may cause modest relative increases (Fig. 3A, season, day, and hour, and the abundance, size, and D). These fine soils, including textures of silt, silt loam composition of fuels across the burn area all drive varia- and finer, can also occur on till parent materials (which tion in fire severity (Finney et al. 2011, Sullivan 2017). did not respond to harvest); thus the sites where fine soils Many of these factors are beyond control, but manage- are most likely to respond positively to harvest are those ment can still provide the ability to mitigate fire impacts where harvesting is done on lacustrine plains, lake- on SOC, whether proactively through forestry or pre- washed till plains, or shallow ponded meltwater depres- scribed burning, during initial attack, or through tar- sions. Although these trends for fine glaciolacustrine soils geted asset deployment during long, large burns. appear to indicate potential C benefits through forestry, Similarly, deploying firefighting assets to targeted por- i.e., relative SOC increases (Fig. 3D) for soils with large tions of a large fire for reasons that have nothing to do baseline SOC (Fig. 5A), the potential for these benefits with C for its own sake, but which protect vulnerable may be tempered by considering fine glaciolacustrine soils as an additional benefit, can mitigate its overall C soils in their ecological and operational context. Ecologi- impacts. By the same token, the U.S. Lake States cally, because these soils are high in SOC, water and include ecosystems where stand-replacing fires are the nutrient holding capacity to begin with, they are unlikely long-term dominant disturbance type (Heinselman to support more productive forests with a modest relative 1973, Schulte and Mladenoff 2005); where these occur SOC increase (Magrini et al. 2007, Belanger and Pinno and impacts include the loss of surface organic matter, 2008, Lavkulich and Arocena 2011, Pinno and Belanger SOC losses may be a natural, unavoidable, or even 2011). Furthermore, from an operations perspective, desired result. glaciolacustrine landforms are usually at the hydric end In the U.S. Lake States, it is difficult to attribute SOC of the physiographic spectrum, making them difficult to stocks to specific land uses, and even more challenging access and their soils vulnerable to physical impacts such to assess the impacts of land use change on SOC stocks. as rutting, and compaction (Kolka et al. 2012). These difficulties largely derive from limited
Xxxxx 2021                           MANAGEMENT EFFECTS ON SOIL CARBON                              Article e02356; page 15

opportunity to study the real process of interest (land        in the U.S. Lake States, where many plantations result
use change), especially over the multi-decadal and             from reforestation and rehabilitation of the lands least
longer timescales needed to reveal changes in SOC              productive, most badly burned or eroded following his-
stocks (McLauchlan 2006, Nave et al. 2013). Even meta-         torical, region-wide, land use changes and disturbances
analysis, which uses studies that mostly attempt to            (LeBarron and Eyre 1938, Brown 1966, Lundgren 1966,
address a single factor (e.g., land use) while holding         Conrad et al. 1997, Crow et al. 1999). Because these
other sources of variation (e.g., soil texture) constant, is   low-diversity, structurally homogenous conifer planta-
limited by the availability of experimental designs and        tions are extensive and still have not recovered their
direct comparisons of changing land uses. Our observa-         potential SOC (compared to native forests), they offer
tional comparisons of NRCS pedons (Fig. 8 and Land             an appealing target for management. Careful tactics
use impacts on soil C storage), indicate that soils used for   may transition these systems to more desired ecological
different purposes inherently differ in properties that        or climate-adapted conditions (Nagel et al. 2017, Quig-
influence SOC stocks, independent of land use. These           ley et al. 2020) while maintaining their SOC stocks, or at
differences in soil properties explain current and historic    least deliberately attempting to mitigate SOC losses.
patterns of land use and suggest how results from the          These tactics may be further informed by other patterns
published literature may also be influenced by non-            in our analysis that reflect bias in the underlying data
random land use. If in any subsection of the U.S. Lake         distribution, which when recognized as such are a useful
States, or across the region at large, forests are allowed     way to reveal management opportunities and knowledge
to persist on sandier, rockier, more acidic soils, while       gaps rather than a problem in the interpretation of
soils with properties favoring greater primary produc-         results. For example, the apparent meta-analytic “coni-
tion, water and nutrient retention, and organo-mineral         fer effect,” which reflects SOC vulnerability related to
stabilization are used for cultivation, then comparing         soil texture and parent material rather than coniferous
SOC for soils used for forest vs. cultivation may create a     vegetation (Figs. 3–5, Appendix S1: Fig. S1), may point
misleading results. Such results may include failing to        to a need for the most cautious management in planta-
detect real land use impacts that are masked by textural       tions on outwash plains with sandy loam soils, hence
influences acting in the opposite direction. If we assume      low SOC stocks and greatest vulnerability to harvest. In
that published studies adequately control for confound-        terms of knowledge gaps, the publication bias connect-
ing sources of variation (e.g., texture) and rely on meta-     ing coniferous / mixed forests entirely to outwash parent
analysis alone, even its findings offer little nuance          materials highlights a need for further research on, e.g.,
(Fig. 7). Forest conversion to cropland was largely his-       the effects of harvest on SOC in coniferous forests on till
torical (Leverett and Schneider 1912, USDA 2015), and          or glaciolacustrine parent materials.
forests now recovering on cultivated croplands have not
apparently made meaningful SOC recoveries in the
                                                                               Management applications
region. Reforestation appears to be highly effective at
increasing SOC on barren mining substrates, though                We have reported overall that place has a stronger
our high confidence in this result is tempered by the lim-     influence than practice on SOC stocks and their
ited areal extent of these lands and the questions of what     responses to management. However, many practitioners
became of the C pools held in these ecosystems through         have less capacity to adjust where actions are taken than
their conversion to industrial land use activities.            how they are implemented if they wish to consider SOC.
Nonetheless, the recovery of many ecosystem services           Recognizing this, we detail in Appendix S1 a set of
on mined lands depends upon SOM formation (Akala               options and related references for place-based tactics to
and Lal 2001, Larney and Angers 2012). Forestry-based          mitigate SOC vulnerability, or enhance probability of
reclamation may, therefore, be justified for lands that        SOC gain (Appendix S1: Table S5). These options for
have not been successfully reclaimed, for reasons that         matching SOC management tactics to site conditions
are not distinctly because of SOC but which result in          augment a menu of climate adaptation strategies and
SOC accumulation as an additional benefit (MacDonald           approaches for forest C management. The Practitioner’s
et al. 2015, Policelli et al. 2020).                           Menu of Adaptation Strategies and Approaches for For-
   Regardless of their ability to support inferences into      est Carbon Management (Ontl et al. 2020) helps resource
SOC change through land use change, observational              professionals identify climate-informed management
comparisons of SOC stocks across land uses can help            actions that maintain or enhance forest ecosystem C
prioritize lands for management. For example, across           stocks and sequestration rates. In its strategies,
the U.S. Lake States, forest plantations are on the sandi-     approaches, and example tactics, the Practitioner’s
est, rockiest, most acidic soils of all (except for barren     Menu emphasizes the aboveground portions of forest
lands, Fig. 8), and hold significantly less profile SOC        ecosystems broadly. In Appendix S1, we offer tactics
than native forests (Sources of variation in forest SOC        relevant to the U.S. Lake States, and SOC in particular.
across the U.S. Lake States). Given the depth of this dif-     Recognizing that any list of potential tactics is essen-
ference in SOC stocks, it is unlikely to reflect plantation    tially limitless, we provide a focused, defensible subset
forestry so much as it reflects the history of plantations     of examples, the majority of which tier to the adaptation
You can also read