Land use Dynamics in the Gambia River estuary basin between 2000 and 2019 in the context of climate change
←
→
Page content transcription
If your browser does not render page correctly, please read the page content below

GSJ: Volume 10, Issue 2, February 2022
ISSN 2320-9186 2359

 GSJ: Volume 10, Issue 2, February 2022, Online: ISSN 2320-9186
 www.globalscientificjournal.com

Land use Dynamics in the Gambia River estuary basin between 2000 and
2019 in the context of climate change

Mamadou NDIONE (1), Abdoulaye FATY (1), Charles Côomlan HOUNTON2, Awa NIANG FALL (1),
 1
 Université Cheikh Anta Diop de Dakar, Dakar Fann, BP 5005-SENEGAL, UMI 0236 Résiliences, Campus international IRD/UCAD
 BP 1386, Dakar Hann, Sénégal - lotandione15@gmail.com
 2
 Université de Parakou BP : 123 Parakou-BENIN,

Abstract

This study is conducted on the Gambia watershed, particularly the estuarine part. It aims to evaluate the types of
land use in this region following the various practices observed in the exploitation of the resources of this
wetland. Thus, the analysis of the dynamics of the different land use units of the Gambia River estuary basin
between 2000 and 2019 was carried out. It focuses on the determination and interpretation of land use types in
2000, 2010 and 2019 and is based on the exploitation of Landsat TM images of March 13, 2000 and ETM+ of
March 17, 2019. Different methods were applied to obtain statistics that could be used to analyze and interpret
the land cover types in the Gambia Basin estuary.
 The analysis of the results shows that during the last decades, the estuarine basins have experienced important
mutations of their surface units in the context of a particularly changing climatic and hydrodynamic
environment.
These results show six land use units unevenly distributed in the basin that would explain environmental and
social mutations. These important changes as observed in the dynamics of water bodies, mangrove ecosystems to
the benefit of salt lands are only the manifestation of the vulnerability of the natural capital of the estuary basin
to anthropogenic and natural factors such as climate variability.

Keywords: Occupancy dynamics -Estuary - Hydrosystem - Gambia River Basin - Climate variability

Résumé

Cette étude est menée sur le bassin versant de la Gambie notamment la partie estuarienne. Elle vise à évaluer les
types d’occupation du sol dans cette région suite aux pratiques diverses observées en matière d'exploitation des
ressources de cette zone humide. Ainsi, l’analyse de la dynamique des différentes unités d’occupations du sol du
bassin estuarien du fleuve Gambie, entre 2000 et 2019 a été faite. Elle se focalise sur la détermination et
l’interprétation des types d’occupations du sol en 2000, 2010 et 2019 et est basée sur l’exploitation des images
Landsat TM du 13 mars 2000 et ETM+ du 17 mars 2019. Différentes méthodes ont été appliquées pour obtenir
les statistiques pouvant permettre d’analyser et d’interpréter les types d’occupation du sol dans l’estuaire du
bassin de la Gambie.
 Il résulte de l’analyse des résultats qu’au cours de ces dernières décennies, les bassins estuariens ont connu
d’importantes mutations de leurs unités de surface dans le contexte climatique et hydrodynamique
particulièrement changeant.
Ces résultats montrent six unités d’occupations du sol inégalement réparties dans le bassin qui expliqueraient des
mutations environnementales et sociales. Ces importants changements tels qu’observés dans la dynamique des
plans d’eau, des écosystèmes de mangroves au profit des terres salées ne sont que la manifestation de la
vulnérabilité du capital naturel du bassin à estuaire face aux facteurs anthropiques et naturels tels que la
variabilité climatique.

Mots clés : Dynamique d’occupation –Estuaire – Hydrosystème – Bassin de la Gambie – Variabilité climatique.
 1

 GSJ© 2022
 www.globalscientificjournal.com
GSJ: Volume 10, Issue 2, February 2022
ISSN 2320-9186 2360

I. Introduction
 1. Context
Land use is a fondamental variable for regional planning and for the study and understanding of the
environnement (Foody, 2002). This theme has become essential in most cartographic inventories and monitoring
of environmental phenomena (Ouattara et al., 2006). The monitoring of vegetation areas in the wet and dry zones
of the estuarine zone of the Gambia watershed has been a priority for policy makers (OMVG) and scientists a
like since the advent of the 1970s drought, which followed a wetter period (1950-1969).
However, the interactions between man and the physical environnement are decisive in the dynamics of land
occupation and use. To this must be added the consequent climatic variability which, in West Africa, has
manifested itself since the 1960s in a significant decrease in rainfall and runoff. Thus, spatio-temporal changes in
land use are significant and reflect the vulnerability of the natural environment to these factors (Thiam, 1997;
Lambin et al, 2001). In estuarine basins such as the Gambia, these spatiotemporal fluctuations of the different
surface units are particularly remarkable due to the interactions between climatic and hydrodynamic factors.
Consequently, knowledge of the evolution of continental surface units has become a major concern for
management and monitoring of territories (Pelletier, 2017). This knowledge of the dynamics of the different
classes of occupation in the downstream basin of the Gambia River is lacking, especially for the water bodies of
the flood basins (OMVG, 2018). This study thus highlights the spatio-temporal changes in the evolution of the
different land use classes identified between 2000 and 2019 in the Gambia estuarine basin. Remote sensing and
GIS used for this purpose are nowadays essential tools to understand the spatio-temporal analysis of surface
units.
This study aims to analyze, over a 19-year period, the spatial dynamics of the different types of land use grouped
into six (06) categories, classified according to the LCCS (Land Cover Classification System) model of land use
classification used by the FAO (Di Gregorio and Jansen, 2000); mangroves and wetlands; water bodies;
grasslands; bare soil; vegetation and urban areas.

 2. Study area
The Gambia River basin is subdivided into two main sub-basins: the upstream basin, (in the purely continental
domain) and the downstream basin where the river is subject to tidal rise. Thus, our area of intervention is the
downstream basin. It covers an area of 32,500 km2, i.e. 42% of the total area of the Gambia basin, divided
between the Republics of Senegal and The Gambia. The river forms a 520 km long estuary, which is almost half
the total length of the river, which is 1150 km. The study area is thus limited :
- to the north by the Saloum and Ferlo basins (Senegal);
- to the south by the Casamance (Senegal);
- to the east by the upstream basin of the Gambia River;
- and to the west by the Atlantic Ocean, which is the outlet for the intrusion of the salt tongue.

 2

 GSJ© 2022
 www.globalscientificjournal.com
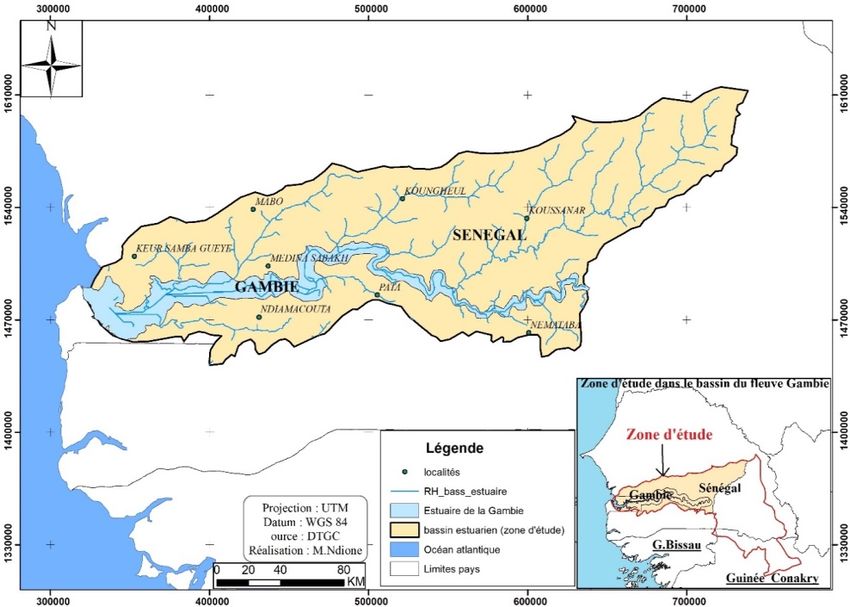
GSJ: Volume 10, Issue 2, February 2022
ISSN 2320-9186 2361

The population of the study area is distributed between Senegal and The Gambia at approximately 15,549,456
inhabitants (World Bank, 2020). It is essentially agricultural and rural. Due to the influence of oceanographic
factors, this transboundary basin abounds in a variety of surface units: mangroves, swamps, salt lands, tree and
woodland vegetation of the alluvial plains, agricultural and grassland areas, etc.

Figure 1: Location of the Gambia River estuary basin, study area.

II. Materials and methods
In this work, the authors used the following data:
- satellite data. These data come from landsat TM images of March 13, 2000 and ETM+ of March 17, 2019 with
a spatial resolution of 30m.
- Field survey data.
- Excel spreadsheet for statistical data processing.
- GPS (Global Positioning System) for field control.
Envi 5.1 software was used for image processing and Arc gis 10.1 for Geographic Information Systems.
2. Method
2.1. Colored composites of panchromatic bands (stack layer)
This operation consists in combining the panchromatic bands to better interpret the image.
2.2 Image classification
We used supervised classification by maximum likelihood using ENVI 5.1 software. The study area was divided
into several classes; thus, the classification, the interpretation of the images as well as the calculation of the
different areas of the classes were carried out using ENVI 5.1 and the mapping itself was carried out on ArcGIS
10.1.
In the case of this study, it was defined on each image 100 classes (at a rate of 6 iterations), which were
reclassified (post-classification) into 5 classes based on the classification of Duveiller (2008) and renamed to
- Continental vegetation
- Cultivated areas and grasslands
- Mangroves and swamps
- Water bodies
- Bare soil
- Inhabited area
2.3. Confusion matrix
The estimation of the classification quality was done through a confusion matrix (V. Godard, 2005). From this
matrix, the user quality or the rate of well classified pixels in class i (Pu(i)) was determined with Equation 1
 ( )
:Pm(i) = ∗ 100 1
 1
where Mc(i) is the number of pixels of class i that have actually been assigned to it after classification and m1 is
the sum of pixels of class i in the image.
The accuracy of the producer Pp(i) was obtained according to equation 2 :

 3

 GSJ© 2022
 www.globalscientificjournal.com
GSJ: Volume 10, Issue 2, February 2022
ISSN 2320-9186 2362

 ( )
 Pp(i) = ∗ 100 2
 2

Where m2 is the number of pixels actually belonging to class i.
A high value of Pp(i) indicates that the class was little affected by samples from other classes. Conversely, a low
value indicates that this class was often selected instead of other classes.
The overall accuracy of the classification was given by the average of the percentages of correctly classified
 1
pixels (MPCC)MPCC = ( ) équation 3

n being the total number of pixels included in the matrix. The Kappa coefficient (K, equation 4) gives a more
accurate estimate (which takes into account well classified pixels) of the classification quality (Congalton et al,
1999):

 Equation 4

2.4. Transition matrix of land use classes
The transition matrix is used to highlight changes in land use during a given period (Bamba, 2010), (Schlaepfer,
2002). The cells of the matrix contain the value of a variable that has moved from an initial class i to a final class
j during the period under consideration. The column values represent the proportions of areas occupied by each
land use class at time j and the row values represent the proportions at the initial time.
 II. Results and discussion
 3.1. Distribution of land use classes in the study basin
At the crossroads of climatic and oceanographic factors, the downstream Gambia basin presents a variety of
surface units. Indeed, six land use classes have been concretely highlighted. Among them, two classes are clearly
distinguished by their predominance. These are the crop-grassland areas, which occupy 47.5% of the total area of
the basin, and the continental vegetation, which occupies 46.5%. With the exception of the central and maritime
estuary and its adjacent boundaries, these two surface units are widely distributed in this estuary basin. The
continental vegetation occupies in particular the region of Tambacounda, Kolda and Sédhiou in Senegal and the
'upper river', the 'Maccarthy island' and the 'lower' and 'western river' in The Gambia. The crop-grassland areas
are mainly in the Senegalese part of the groundnut basin and to a lesser extent in the Kolda region. In The
Gambia, it concerns mainly the North bank division.

 4

 GSJ© 2022
 www.globalscientificjournal.com
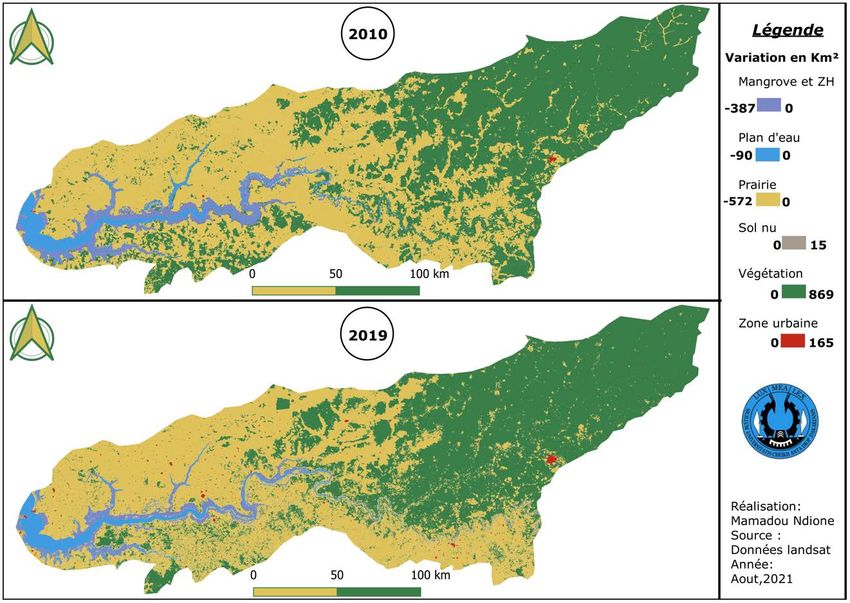
GSJ: Volume 10, Issue 2, February 2022
ISSN 2320-9186 2363

Figure 2 : Land use in 2000 and 2010

Figure 3 : Land use in 2010 and 2020

 5

 GSJ© 2022
 www.globalscientificjournal.com
GSJ: Volume 10, Issue 2, February 2022
ISSN 2320-9186 2364

Mangrove ecosystems make up 3.8% and water bodies 2.9% of the surface. These two land use classes are
largely found in The Gambia: the first runs along the estuary from the mouth to the fluctuating salinity front and
the second concerns the river and the depressions it floods. Bare soil, which makes up 0.1% of the basin's surface
area, is also mainly found in The Gambia and secondarily in the Senegalese Bao Bolong. The inhabited area
represents 0.2% of the area and includes all the human constructions of the 'Senegambia'.
3.2. Dynamics of land use classes between 2000 and 2010
The state of land use in 2000 shows a predominance of areas occupied by crop-grassland which is 16,728 km2
(47.4% of the basin) and continental vegetation which is 16,052 km2 (45.5% of the basin). During the period
2000-2010, four surface units have increased in area. These are respectively the crop-grassland area which
increased by 310 km2, water bodies by 7 km2, inhabited area by 3 km2 and bare soil by 1 km2. However,
continental vegetation and wetlands constituted by mangroves and swamps regressed in area by 318 km2 and 3
km2 respectively. The rate of increase during this period is very high for the urban area (33%) while it is low for
the water bodies (1%) and the crop-grassland area. The rate of regression of the continental vegetation is -2%.

Table 1: Distribution of land use classes from 2000 to 2019

 Areas in 2000 Areas in 2010 Area in 2019 Differences
 Land use
 categories 2000- 2010-
 (%) (km2) (%) (km2) (%) (km2)
 2010 2019

Mangrove and
 3,95 3 0,213 -1,097
wetland 1394 4 1469 1082
Body of water 3,03 1068 3 1051 3 961 -0,048 -0,255
Prairie 48,32 17038 48 16902 46 16330 -0,386 -1,622
Bare ground 0,05 16 0 15 0 30 -0,003 0,043
Vegetation 44,62 15734 45 15800 47 16669 0,187 2,464
Urban area 0,03 12 0 25 1 190 -0,037 -0,468
Summer 100 35 262 100 35 262 100 35 262

Dynamics of land use classes between 2010 and 2019
Between 2010 and 2019, notable changes were recorded in the dynamics of land use classes in the study basin.
They mainly concern the areas of mangrove swamps, which have regenerated by 75 km2 at the expense of crop-
grassland and water bodies, which have successively decreased by 136 km2 and 17 km2.

 18,000

 16,000

 14,000

 12,000
 Superficie (Km2)

 Année 2000 10,000
 Année 2014
 8,000
 Année 2019
 6,000

 4,000

 2,000

 0
 Mangrove et zone humide
 Plan d'eau Prairie Sol nu VégétationZone urbaine

Figure 3: Evolution of land use types

 6

 GSJ© 2022
 www.globalscientificjournal.com
GSJ: Volume 10, Issue 2, February 2022
ISSN 2320-9186 2365

This drastic and persistent decline in surface water resources is thus linked to the unfavorable climatic context in
the study basin, but above all to the decline in fluvial inputs from the upstream basin, on which the estuary and
flood depressions in the study area depend in particular.

IV. DISCUSSIONS
Analysis of land use dynamics in the estuarine zone of the Gambia River watershed from 2000 to 2019 showed
an expansion of areas devoted to mangrove propagation and sown or bare land (very low proportion). 2010 to
2019, with the exception of continental vegetation and bare soil (+2.4% and +0.043%), all other surface units are
in regression (tabl.1). These important changes as observed in the dynamics of water bodies, mangrove
ecosystems to the benefit of salt lands are only the manifestation of the vulnerability of the natural capital of the
Senegal River estuary basin. These modifications can be explained by anthropic and physical actions (change in
hydrological regime linked to the strong anthropization of ecosystems, bush fires, decrease in rainfall......) on
natural resources in general and on plant formations in particular.
On the other hand, the use of Landsat images has allowed us to give a general vision of the evolution of land use.
In order to obtain more precise and detailed information on certain key areas, it is necessary to use images of
higher spatial resolution such as the SPOT series or radar.
In recent years, several studies have focused on these global changes: drought, desertification, and the reduction
of water resources and wetlands (Wilhite and Glantz, 1985; Kogan and Sullivan, 1993; Kogan, 1997).

Conclusion
Studies on land cover and land use change are of great importance because they allow us to know the current
trends in the processes of deforestation, degradation, desertification and loss of biodiversity in a given region
(Lambin et al. 2001). This study provided an overview of the dynamics of land use in the estuarine zone of the
Gambia River using data from Landsat TM and ETM+ sensors at different dates. The results showed a regressive
trend of forest environments to the detriment of anthropized spaces.
High resolution images would help to obtain detailed information (buildings, wetlands, dwellings, bare soil, etc.)
and especially to study in more detail the most critical areas (erosion of lowland areas).

Bibliographic references

Lambin (E. F) et al., 2001. The causes of land-use and land-cover change : moving beyond the
myths. Global Environmental Change, 11, pp. 261-269.
Thiam, S., 1997, Suivi des écosystèmes sahéliens à partir de la télédétection satellitaire application
au delta intérieur du Niger (Mali) et à la région du lac de Guiers (Sénégal), Thèse de doctorat en
Géographie, Université de Paris-I-Panthéon, 187 p.
BAMBA I. (2010) : Anthropisation et dynamique spatio-temporelle de paysages forestiers en République
Démocratique du Congo. Thèse de doctorat, Université Libre de Bruxelles, Belgique,pp. 205.
Di Gregorio, A., Jansen, L.J.M., (2000). Land Cover Classification System: Classification Concepts And User
Manual, FAO, Rome. ftp://131.252.97.79
Kogan, F. N. (1997): Global Drought Watch space- Bull. Am. Met. Soc., 78, 621-636
Kogan, F.N., Sullivan, J. (1993): Developement of a Global Drought-Watch Sytem Using NOAA/AVHRR
Data.-Adv. Space Res., 13, 219-222
FATY A, Kouame F, FALL AN, et al. 2019 : Land use dynamics in the context of variations in hydrological
regimes in the upper Senegal River basin. Int J Hydro. 2019;3(3):185‒192. DOI: 10.15406/ijh.2019.03.00179

LAMBIN E. F.; GEIST H. J. & LEPERS E., 2003: Dynamics of landuse and land-cover change in the tropical
regions. Annual Review of Environment Resources, vol. 28: 205-241

LEFEBVRE A., CORPETTI T., HUBERT-MOY L., 2011 : Ondelettes et théorie des évidences pour la
classification orientée-objet- Caractérisation et changement des dynamiques d’occupation des sols de la
métropole de Rennes. Revue Internationale de Géomatique, vol. 21 : 297-325

Ouattara T., Dubois J.M., Gwyn J., (2006) : « Méthodes de cartographie de l’occupation des terres en milieu
aride à l’aide de données multi-sources et de l’indice de végétation TSAVI », Télédétection, vol. 6, n° 4, p. 291-
304.Park et al, 2004

 7

 GSJ© 2022
 www.globalscientificjournal.com
GSJ: Volume 10, Issue 2, February 2022
ISSN 2320-9186 2366

Pickup G., and Marks A., (2000): “Identifying large-scale erosion and deposition processes from air-borne
gamma radiometrics and digital elevation models in a weathered landscape”, Earh Surface Processes and
Landforms, vol. 25, p. 535-557.Skupinski et al., 2009
PONTIUS R.G.Jr., (2000): Quantification error versus location in comparison of categorical maps.
Photogrammetric Engineering and Remote Sensing, vol.66 (8):1011-1016
R. G. Congalton. & K. Green. Assessing the accuracy of remotely sensed data: Principles and practices. Boca
Raton: Lewis Publishers. 1999.

R. Schlaepfer (2002). Analyse de la dynamique du paysage. Fiche d’enseignement 4.2, Laboratoire de Gestion
des Ecosystèmes, Ecole Polytechnique de Lausanne, Suisse. pp.10.

ROUSE, J.W., HAAS, R.W., SCHELL, J.A., DEERING, D.W. AND HARLAN, J.C., (1973): Monitoring
the vernal advancement and retrogradation (Greenwave effect) of natural vegetation.

SCHLAEPFER, R., (2002). Analyse de la dynamique du paysage. Laboratoire de gestion des écosystèmes
(GECOS), École polytechnique fédérale de Lausanne, Lausanne, 11 pages

SKUPINSKI G., BINHTRAN D., WEBER C., (2009): Les images satellites Spot multi-dates et la métrique
spatiale dans l’étude du changement urbain et suburbain – Le cas de la basse vallée de la Bruche (Bas-Rhin,
France). Cybergeo : European Journal of Geography [En ligne], Systèmes, Modélisation, Géostatistiques, article
439, mis en ligne le 12 mars 2009, consulté le 30 octobre 2012. URL : http://cybergeo.revues.org/21995 ; DOI :
10.4000/cybergeo.21995

TISSOT C. et CUQ F., (2004): Apport des SIG pour la modélisation spatio-temporelle d'activités humaines",
Revue Internationale de Géomatique, n°14: 83-96

Tucker, C.J. (1979): 'Red and Photographic Infrared Linear Combinations for Monitoring Vegetation', Remote
Sensing of Environment, 8(2), 127-150.

V. Godard. 2005 : Typologie des paysages forestiers du sud du massif de Fontainebleau après la tempête de
décembre 1999. Évaluation des dégâts forestiers à l’aide d’un semis de points et d’imagerie satellitale optique.
Revue International de Géomatique, 15 (3) : pp. 281-302,

Wilhite, D. A., and Glantz M. H., (1985) : Understanding the drought phenomenon: The role of definitions.
Water International, 10, 111-120.

 8

 GSJ© 2022
 www.globalscientificjournal.com
You can also read