LGWM - Case for Change - Let's Get Wellington Moving
←
→
Page content transcription
If your browser does not render page correctly, please read the page content below
LGWM – Case for Change

      9 November 2017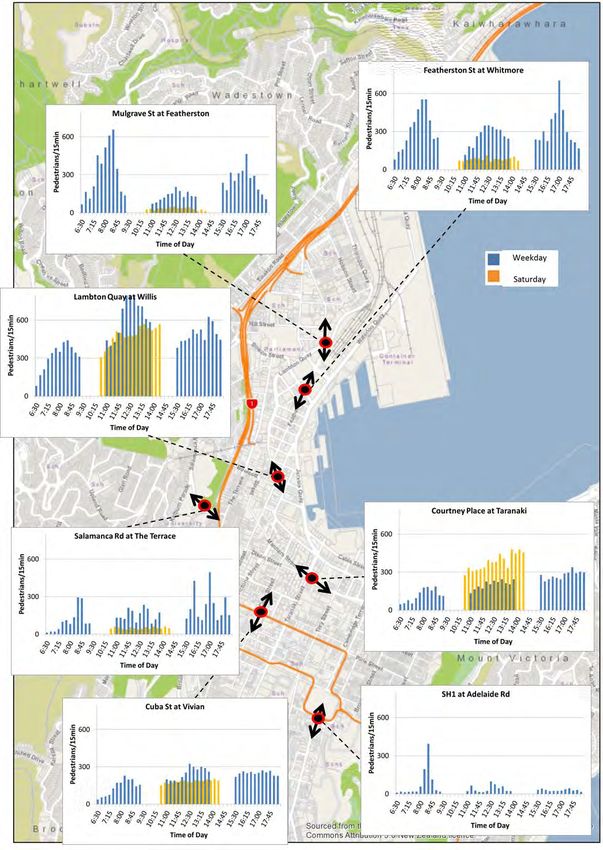
Executive Summary
Purpose
Let’s Get Wellington Moving (LGWM) is a joint initiative by Wellington City Council, Greater
Wellington Regional Council and the New Zealand Transport Agency. LGWM is investigating the
merits of investing in the transport system to improve outcomes for Wellington, with a focus on the
area from Ngauranga to the airport, including the central city.
This paper discusses the rationale for such a programme. The focus is on improvements to the
transport system in the central city, recognising that many of the journeys start and finish outside of
this area, and therefore also depend on the performance of the wider regional transport system.
Context
Wellington’s transport system – in conjunction with the wider regional transport system – responds
to the travel demand generated by the land uses described above, through enabling people, goods
and services to:
Move around safely and efficiently within the central area for travel to work, business or
leisure purposes
Travel to work and educational activities from outside the central city
Access the port, shops and other business premises located in central Wellington
Pass through the central area to reach other key destinations such as the airport, and the
regional hospital.
While the transport system needs to respond effectively, efficiently and safely to these travel
demands, it also plays a key role in ‘shaping’ the development of the city, and therefore the economic
and social opportunities it has to offer.
Current issues
Transport routes to access the central city and key regional destinations are limited in number and
constrained by the geography of the harbour and hills. The high concentration of employment in the
central city attracts commuters from the wider Wellington region. At peak times the central city
network and routes to the central city operate at close to full capacity for private vehicles and some
public transport routes, allowing little ‘slack’ for unplanned events such as crashes and severe
weather. The system is also particularly vulnerable to seismic events, with several fault lines in the
area.
Constrained transport routes mean there is competition for limited space between people walking,
cycling, travelling by bus or car, or delivering goods and services. The shape of Wellington’s transport
system means that there are conflicts between different movements. While Wellington’s compact
urban form encourages pedestrian activity and cycling, it increases the number of potential points of
conflict between different modes of transport.
Future issues
The transport system is coming under pressure from economic growth, population growth and
changing land use patterns. Intensification of the central city is leading to a growth in short journeys
and demand for a safe and convenient environment for people to walk and cycle.
Meanwhile the Wellington region as a whole is growing, and this is driving demand for journeys
passing through the central city to reach important destinations such as the airport and hospital.
i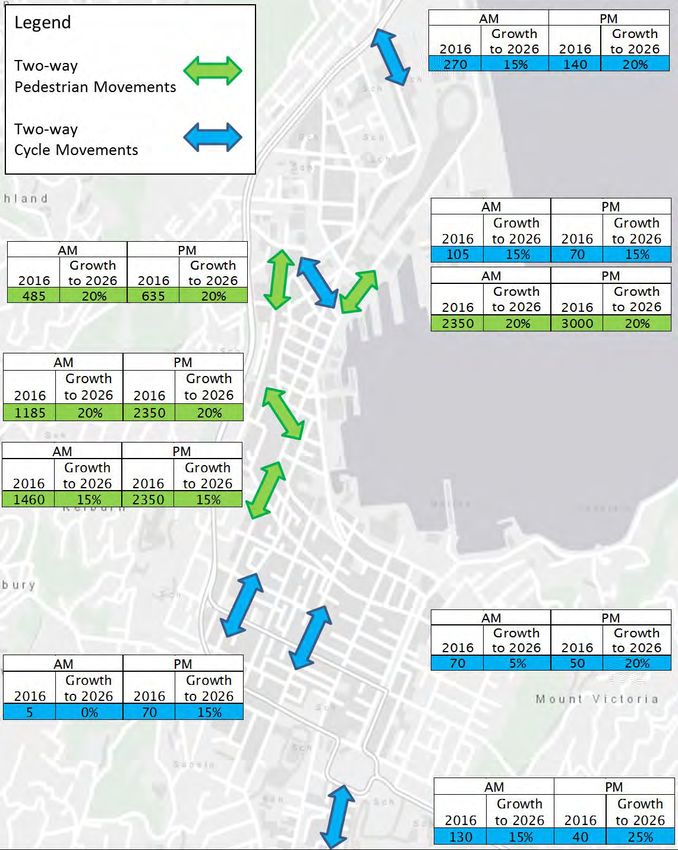
Unfortunately many of these journeys are along the same routes (State Highway 1 and the
waterfront) that are used by commuters. Significant movement through the LGWM area conflicts
with increasing numbers of crossing movements by buses, pedestrians and cyclists.

In the absence of further improvements to the transport system, levels of service will progressively
deteriorate for all modes of transport, resulting in unpredictable journey times and potential safety
issues.

The key issues facing Wellington’s transport system are illustrated in the map below.

ii
By 2026, without significant changes to the transport network, preliminary transport modelling
indicates:
There could be 10% to 15% more car and public transport trips to, from, and within
Wellington City by 2026. The increase in walking and cycling trips is expected to be much
greater due to the increase in the concentration and number of people living in the central
city
The volume of people crossing key intersections in the central city at peak periods will
increase, making it harder to manage orderly pedestrian flows, increasing safety risks for
people walking and cycling
Bus service peak travel times could be up to 25% longer on some bus services, with bus travel
times forecast to deteriorate across all routes
Average morning peak travel time for some trips on State Highway 1 (SH1) between
Ngauranga Gorge and the airport could increase by up to 25% by 2026, with a corresponding
worsening in the predictability of these journey times
The evening and morning peaks on SH1 between the Terrace Tunnel and Mt Victoria Tunnel
will come closer together and the route will remain at or close to capacity for much of the day
Some local roads will see much greater percentage increases in traffic flows than SH1, which
is already at or near capacity. Examples include 15% to 20% more vehicles on Oriental Parade,
and 10% to 15% more vehicles on Thorndon Quay
The total annual cost of weekday vehicle delay is most likely to increase by about 30%-50%.
iii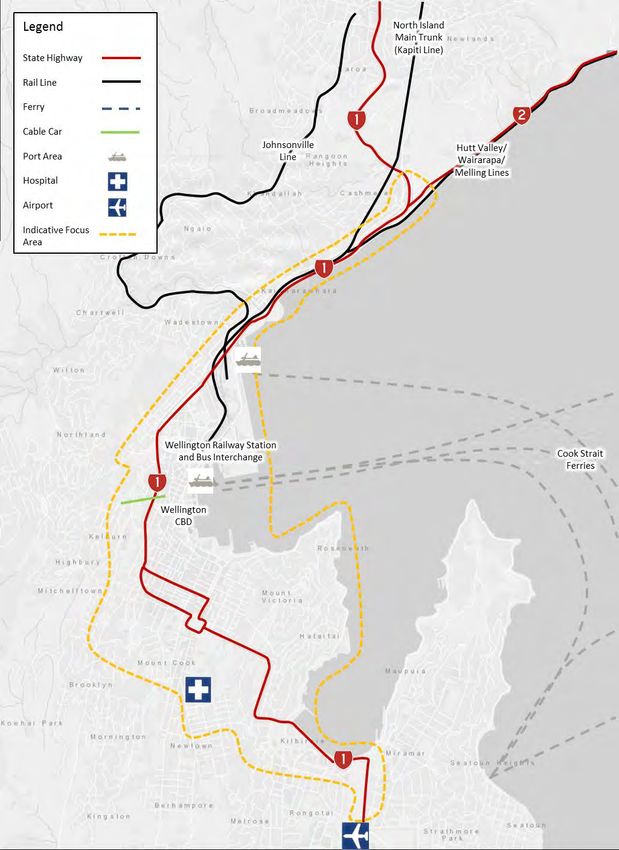
LGWM presents an opportunity to deal with these issues in the key parts of the network, as illustrated
in the following map.

iv
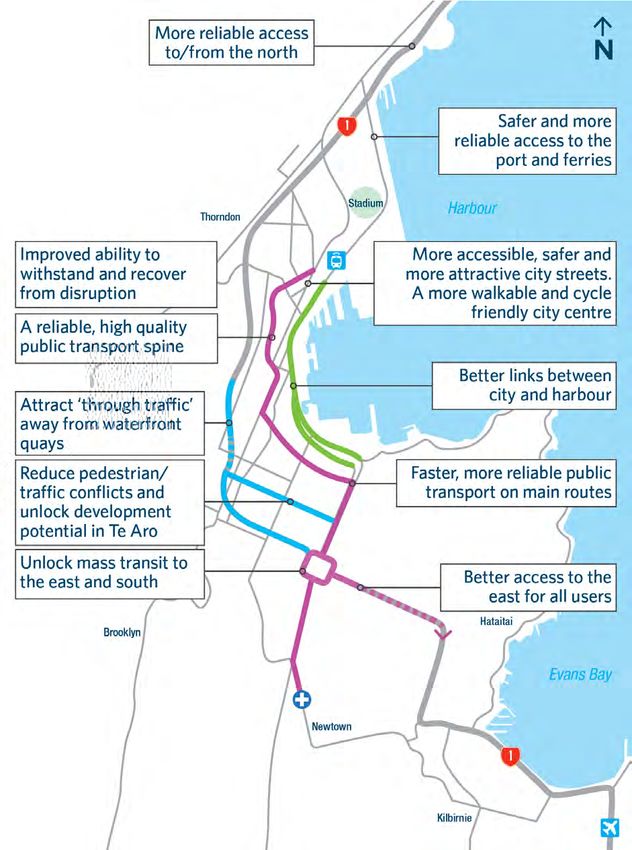
The potential benefits of investing in the transport system to address the problems and realise the
opportunities can be summarised as follows:
Improved liveability through enhancing amenity, safety and transport modal choice
Improved accessibility through enabling more reliable and predictable journeys for people
and businesses
Improved resilience through strengthening the transport system’s ability to withstand and
recover from large scale natural hazard events.
Conclusion
Implementing an improvement programme will reduce the impact of the problems identified in this
paper. It will also create opportunities to enhance the attractiveness of central Wellington as a place
to live, work, visit and do business, potentially bringing wider economic benefits to New Zealand.
v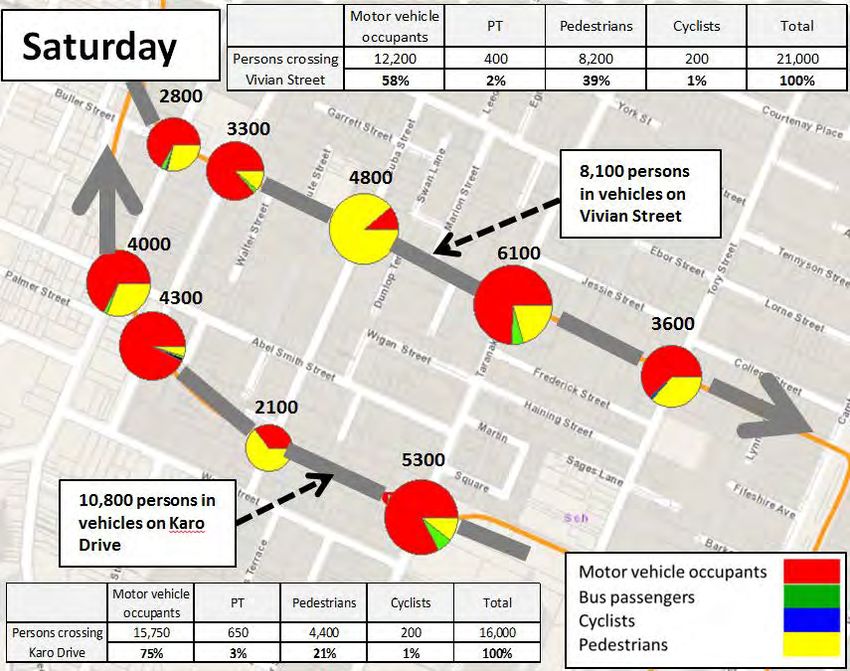
Contents
     Executive Summary .............................................................................................................................. i
     Introduction ......................................................................................................................................... 1
     Scope ................................................................................................................................................... 2
     Wellington’s land use and urban form................................................................................................. 3
     Role of the transport system ............................................................................................................... 4
     Current transport demand................................................................................................................... 5
     Current transport system design ....................................................................................................... 10
     Transport system pressures ............................................................................................................... 11
     Future transport system modal choices ............................................................................................ 18
     Future transport system performance .............................................................................................. 19
     Programme objectives ....................................................................................................................... 28
     Risks and uncertainties ...................................................................................................................... 30
     Conclusion ......................................................................................................................................... 30
     Bibliography ....................................................................................................................................... 32
     Appendix 1 – Do Minimum assumptions / summary ......................................................................... 33
     Appendix 2 – Let’s Get Wellington Moving Modelling Suite Overview .............................................. 36

vi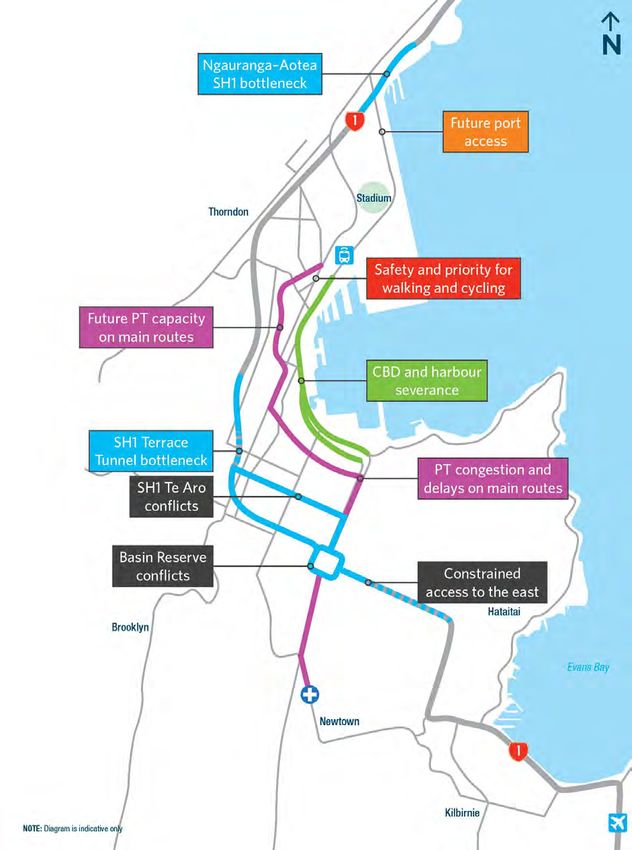
Glossary
What is an intervention?
Interventions are types of improvements, activities, policies or solutions. They range across all modes
of transport. Examples are building new infrastructure, managing travel behaviour through pricing,
improving public transport and reducing vehicle traffic in certain areas of the city. Interventions can
be considered as levers, and these levers can be pulled to a greater or lesser degree to achieve
objectives. These interventions can be grouped into combinations called scenarios.

What is a scenario?
Scenarios are packages of different transport and urban design interventions that will help improve
the way the city looks, feels and functions, make it safe and easy to get around, and support the kind
of future growth Wellington wants.

What is liveability?
Liveability is the sum of the factors that add up to a community’s quality of life—including the built
and natural environments, economic prosperity, social stability and equity, educational opportunity,
and cultural, entertainment and recreation possibilities. A key requirement for a liveable city is that
people and businesses can access the destinations they need to reach safely and reliably.

Introduction
Let’s Get Wellington Moving (LGWM) is a joint initiative by Wellington City Council, Greater
Wellington Regional Council and the New Zealand Transport Agency. LGWM is investigating the
merits of investing in the transport system to improve outcomes for Wellington, with a focus on the
area from Ngauranga to the airport, including the central city.
This paper is one of a series of papers documenting the work carried out by LGWM:
1. LGWM - Strategic Context
2. LGWM - Case for Change
3. LGWM - Strategic Response
4. LGWM - Summary of Scenarios
5. LGWM - Strategic Assessment of Scenarios
Where this paper refers to other papers in the series, their titles are shown in italics.
The purpose of this paper is to outline the strategic rationale for changes to the transport system in
the Ngauranga to airport area, including in particular:
The scope for the programme, including ‘givens’ and what is out of scope
The problems (current and future) associated with this part of the transport system, and their
causes and effects
The potential benefits of investing in a programme of interventions to address these
problems
The programme objectives and how these will be measured
The direction of change in the performance of various elements of the transport system to
move the system as a whole towards those programme objectives
The main risks and uncertainties of the LGWM programme.
The programme objectives are closely aligned with wider national, regional and local goals and
priorities of the LGWM partners. The details on this are set out in a separate paper, LGWM - Strategic
Context.
Detailed information underlying the case set out in this paper can be found in supporting documents
including: ‘Wellington 2040’, ‘Wellington Urban Growth Plan’, ‘Regional Land Transport Plan’,
‘Baseline Report: Land Use and Urban Form’ and ‘Do Minimum Baseline Report’. The supporting
documents are listed in the bibliography.
The information presented within this report is not intended to demonstrate an exhaustive
assessment of the problems that the LGWM project is seeking to address. Rather, it demonstrates the
extent to which these problems will become more critical in the future. This report shows some of the
possible outcomes under a ‘Do Minimum’ future which only includes committed projects. The
performance of other possible intervention packages (or “scenarios”) will be reported separately.
The population and employment growth projections that underpin the ‘Do Minimum’ future show the
following:
Steady growth in the Wellington region as a whole
Intensification in the central city area – employment and residential.
This is likely to result in:
Increasing pressure on the transport system
Declining transport system levels of service.
1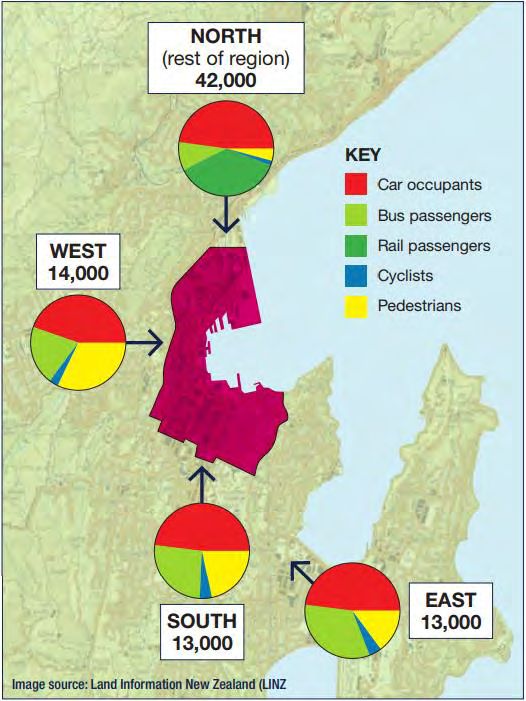
Scope
The focus of LGWM is on improvements to the transport system in the area shown below, known as
the Ngauranga to Airport corridor (Figure 1). This transport corridor should be seen in the context of
the wider Wellington regional transport system, as many of the journeys in the corridor start and
finish outside the focus area.

Figure 1 LGWM Ngauranga to Airport corridor Map

2
The transport system encompasses all modes of transport within the focus area. These include
walking, cycling, public transport (buses, taxis, trains, ferries), movement of goods and services by
road and rail and travel by private car and motorcycle. The transport system also encompasses other
elements such as network management, information services, and parking provision.
The ‘Givens’ and ‘Out of Scope’ areas for the LGWM programme, as agreed by the LGWM Board, are
set out in Table 1 below.
Table 1 LGWM Scope
Study area – as shown in map Changes to Wellington 2040
Recognition of CBD intensification as regional growth and Wellington Urban Growth
engine Plan
Travel demand Parking policy (in short term)
Changes to schools’ terms and
dates
Sustainable transport hierarchy in the Wellington
Urban Growth Plan
Integration of urban cycling programme
Walking and cycling
WCC review of CBD speed limits
Options to improve pedestrian safety and journey
experience
New bus network 2018 Public transport fleet motive
High capacity buses on the Golden Mile power and fare review
Public transport Integrated bus ticketing 2018 (possibly including
ferries and the Cable Car)
Procurement of new bus operational contracts by
2018
The current road hierarchy as determined by the One
Strategic road
Network Road Classification
network
Optimal utilisation of the existing road network
Wellington 2040 and the Wellington Urban Growth
Plan
The Basin Reserve as an international cricket venue, its
Liveability and
development plans and the need to integrate these
competitiveness
with any transport initiatives
Increasing residential population density in the central
area
Wellington Transport Operations Centre (WTOC) and
Network
Wellington City Council Traffic Operations Centre
optimisation
(TOC) continue to work closely together
Wellington’s land use and urban form
Land use, urban form and the health and form of our economy are the primary drivers of demand for
transport services in the Greater Wellington region as a whole and in the central city area in
particular. The key trends are outlined below.
Population trends
The population of the Wellington Region stands at around 500,000 people. A recent forecast
developed by the territorial authorities projected a growth of approximately 20% over the next 30
years, equating to up to 100,000 extra residents.
3If the high growth rates seen over the last three to five years were to continue then growth could be
nearer to 30% (or 150,000 additional residents) over the next 30 years.
The distribution of this growth is estimated to be as follows:
30% will be focused around Wellington’s central city and northern suburbs
20% will occur in other areas of Wellington City
The remainder (50%) will be around urban centres outside Wellington City, particularly in
Porirua, Lower Hutt and Petone.
With specific reference to Wellington City, between 50,000 and 80,000 additional residents are
forecast over the next 30 years.
The population of the central city (the CBD plus Te Aro and Thorndon-Pipitea) almost doubled
between 2001 and 2013 to 17,000 people. It is forecast to almost double again in the next 30 years,
with approximately 15,000 to 20,000 more people expected to be living in the area by then.
This growth in the number of people living in the central city partly reflects a reduction in demand for
office space and the conversion of older and lower-grade office buildings to apartments. There is also
significant demand for new apartment buildings in central Wellington.
Employment trends
The employment projections show regional employment growing by between 15% and 20% over the
next 30 years. This is lower than the forecast percentage growth in population over the same period,
reflecting the aging population.
Over 40% of the current 235,000 jobs in the Wellington Region are located in the central city. The
employment projections suggest that between 55% and 60% of future growth in employment is likely
to be located in the central city, potentially increasing the number of jobs there from the current
94,000 to between 116,000 and 125,000 in 30 years’ time.
The largest employment sectors in the region are Public Administration & Safety, and Professional,
Scientific & Technical Services. These sectors contributed nearly 50% of the total growth in GDP over
the last 10 years. They are more likely to be located in central Wellington than elsewhere in the
region because of the agglomeration benefits of firms being closely located to each other and their
clients.
Role of the transport system
Wellington’s transport system – in conjunction with the wider regional transport system – responds
to the travel demand generated by the land uses described above, through enabling people, goods
and services to:
Move around safely and efficiently within the central area for travel to work, business or
leisure purposes
Travel to work and educational activities from outside the central city
Access the port, shops and other business premises located in central Wellington
Pass through the central area to reach other key destinations such as the airport, and the
regional hospital.
While the transport system needs to respond effectively, efficiently and safely to these travel
demands, it also plays a key role in ‘shaping’ the development of the city, and therefore the economic
and social opportunities it has to offer.
In the past, the development of tramways, passenger rail and bus services and, later, private motoring
allowed the city to develop in certain ways. This gave people the opportunity to live in suburbs away
from the central city, whilst still allowing them to access high value employment opportunities in the
CBD.
4In recent years, the strong trend for people to move back to living within the central city has in turn led to more people enjoying the health benefits of walking and cycling to work, and so avoiding the need to travel by motorised transport along increasingly congested commuter routes. The transport system has responded to this growing demand by improving conditions for walking and cycling. This has included the provision of widened footpaths, improved pedestrian crossing facilities, and some dedicated cycle lanes. At the same time private vehicle activity in the central city has been held in check by constrained corridor capacity, the constrained supply of commuter car parking, and the use of traffic control systems to manage vehicle and pedestrian flows. The transport system has a key role to play in facilitating further growth in the central city. This is desirable economically as it supports an increasingly productive economy by matching innovative businesses with a highly skilled labour pool. Good job opportunities and a high quality of life attract talented people from around the world to the city. It is also desirable environmentally as it reduces the need for people to travel long distances to work. Current transport demand Overview Transport demand is the number and type of trips that people make on foot, by bicycle, in vehicles, or on public transport, as well as commercial trips delivering goods and services. Traditionally there has been a focus on demand in the morning (AM) peak (between 7am and 9am) and the afternoon (PM) peak (between 4.00 pm and 6.00 pm). These periods are when the transport system comes under pressure from the large number of people travelling to and from work in the central area. However, in recent years, weekend peaks have also developed. These occur around the middle of the day on Saturday and Sunday, and are due to a diverse range of journeys types, as people travel for shopping or leisure purposes. Over time, the peaks have begun to spread, starting earlier and finishing later. Some parts of the system are busy right through the day during the week and at weekends. Some of this results from journeys to and from the central city, but there are also many journeys through the central city to reach destinations beyond, such as the hospital and the airport to the south, or the industrial and retail areas of Lower Hutt and Petone to the north. A further significant development has been the growth of journeys within the central area as a result of the growth in the resident population travelling to work and pursuing other activities. The relative ease and safety of making these short journeys is an important contributor to the liveability of the central area. Weekday peaks Weekday travel patterns are characterised by the peak periods in the morning and afternoons, with people using a range of modes to access the city at the same time. In 2017, around 82,000 people crossed the CBD cordon1 (inbound) every morning in the AM peak. Private vehicle travel is the largest mode overall for people moving in and out of Wellington CBD (47%). However, over half of all journeys to work to Wellington CBD are made by non-car modes (public transport 35%, walking 15%, cycling 3%). Similar patterns occur in reverse during the PM peak as people return home. The diagram below shows the mode share of people crossing the cordon varies significantly, depending on the origin of the journey. It is notable that commuters from the north make good use of 1 Wellington City Council and Greater Wellington Regional Council conduct annual surveys of people moving into and out of the central city crossing an imaginary line or cordon around the CBD 5
the extensive rail network. This option is not available to commuters for the suburbs to the east, west
and south, where bus and walking are more significant.

Figure 2 Volume by mode of travel entering the Wellington CBD, AM peak March 2016

During the period between 2001 and 2016, the majority of growth in people crossing the CBD cordon
between 7am and 9am can be attributed to people coming from the north as shown in Figure 3.
During this period there was a reduction in the number of motor vehicles crossing the cordon from
the north, and an overall increase in people using other modes.
The greatest increase in traffic volumes between 2001 and 2016 have been in pre-peak (before 7am)
as people try and avoid congestion or get to work earlier to get a car park.

6
Figure 3 Change in persons Wellington CBD cordon, 2001 to 2016 – by origin area (top) and mode of travel (bottom)

Weekends
Fewer people use public transport to get around at weekends. Across the whole of the CBD, people in
cars account for a greater proportion of total people passing through intersections on Saturdays and
Sundays compared to the weekday AM peak, inter-peak and PM peak. This means that weekend
congestion is significant, despite higher vehicle occupancies at weekends (1.8) compared to
occupancy rates on weekdays (1.4).

7
Data gathered for Saturdays in March of 2016 showed that:
Between 10am and 6pm, Ruahine Street traffic volumes are generally at or near the busiest
hour two-way traffic volumes from the weekday morning peak
Local arterials – Oriental Parade, Brooklyn Road, Glenmore Street, Salamanca Street –
generally have two-way traffic volumes between 11am and 5pm that are only marginally
lower than comparable weekday two-way traffic volumes during peak hours
State Highway 2 (Petone to Ngauranga), SH1 (Ngauranga Gorge) and Aotea Quay Saturday
traffic volumes during the day are between 60% to 75% of traffic volumes during the busiest
weekday hour
Terrace Tunnel weekend traffic volumes are between 80% and 85% of the busiest weekday
hour traffic volumes.
Walking and cycling
Across Wellington City as a whole, 45% of new commuter trips between 2001 and 2013 have been on
foot or by bike. For people living and working within the CBD, walking accounts for over 80% of
journeys to work. This proportion has remained relatively unchanged even though the total number
of residents living in the central area has grown rapidly, doubling between 2001 and 2013.
Figure 4 Journey to work trips within Wellington CBD, 2001 and 2013 (mode share in brackets, does not include ferries
or cable car)
Walking is also a significant mode for people using public transport to reach their end destinations.
For example, Featherston Street at its intersection with Whitmore Street shows high pedestrian
volumes during the AM peak and PM peak (up to 600 pedestrians every 15 minutes). This is due to
people walking between Wellington Railway Station/Bus Station and destinations within the central
city.
Figure 5, which shows the proportion of people crossing the cordon by mode, indicates the high
number of people who arrive at the Wellington Railway Station in the morning, most of whom walk to
their end destinations.
8Figure 5 Persons crossing Wellington CBD cordon, inbound, in AM peak 2016 (7am to 9am) by mode and corridor 9
There are also significant volumes of CBD workers, students and visitors walking around the city
during the day. Lambton Quay and Willis Street have high pedestrian volumes (over 700 pedestrians
per 15 minute period) during the middle of the day.
Commercial vehicles
Goods and service vehicle movements are a relatively small proportion of total traffic but are vital
enablers of Wellington’s economic and residential functions. There are also nationally and regionally
important rail and road freight logistics connections to CentrePort (including the Cook Strait Ferry
services). These commercial vehicle movements tend to be spread more evenly through the day than
the movement of people.
Current transport system design
Wellington’s transport system is multimodal in nature. North of the central city, SH1 and the Hutt
Road run parallel to the main rail lines (North Island Main Trunk, Johnsonville and Wairarapa lines) at
the base of the Khandallah/Ngaio hills. All these routes are close to the Wellington fault line and the
harbour. They are subject to disruption through landslips and storm surges.
As the road and rail corridors approach Wellington CBD they become even more highly constrained
by the hills on one side and the harbour on the other.
The railway lines end at the Wellington Railway Station at the north end of the CBD, with the
transport connections further to the south and west on roads running roughly parallel to the
waterfront route (Waterloo and Customhouse Quays), and through the CBD itself along Featherston
St, Victoria St, Willis St, Lambton Quay and the Terrace.
From the north, the primary bus corridor is along Thorndon Quay to the Lambton Interchange and
then along the ‘Golden Mile’ (Lambton Quay, Willis St to Courtney Place). Most of the suburban bus
services run along the Golden Mile providing a convenient connection to heart of the city. The Cable
Car terminal is also located on Lambton Quay.
The Featherston Street/Victoria Street route and the Aotea Quay/waterfront route are mainly used by
cars and commercial vehicles. Pedestrian and cyclists also use all of these routes.
Road traffic from the north and the urban motorway must enter the city centre (or traverse it) by
travelling along three routes – SH1, Hutt Road/Thorndon Quay and the Aotea Quay/waterfront route.
Road access to CentrePort and the Cook Strait Ferry terminals is from Aotea Quay. Rail access to the
port crosses Aotea Quay at grade.
SH1 is a motorway until it enters the Terrace Tunnel. From the Terrace Tunnel, SH1 traverses the local
city street network and connects to Mt Victoria Tunnel via a one-way system through Te Aro,
comprising:
Vivian Street/Kent Terrace to Basin Reserve eastbound
Basin Reserve via the Arras Tunnel and along Karo Drive westbound.
SH1 provides a through route for vehicles passing through the central city. The Vivian Street/Karo
Drive one-way system primarily acts as a distributer for the majority of vehicles (60%-80%) that use
SH1 to access the central city or southern suburbs, rather than as a through route. Local routes that
connect this part of SH1 to the CBD include Willis Street, Victoria Street, Taranaki Street, and
Cambridge/Kent Terraces.
The main access to the eastern suburbs and the airport is via the two-lane SH1 Mt Victoria Road
Tunnel, Constable St in Newtown, and the single lane Hataitai Bus Tunnel. Oriental Parade and Evans
Bay Parade provide an alternative waterfront route following the harbour’s edge ‘round the bays’ at
the foot of Mt Victoria. This is also one of Wellington’s main cycle routes.
10The main connections to the hospital and Newtown from Te Aro are Kent Terrace/Adelaide Road and Taranaki Street, which intersect with SH1 at the Basin Reserve and Karo Drive/Vivian Street respectively. The bus routes to the southern suburbs also run along Kent Terrace/Adelaide Road, Taranaki Street, Willis Street, and Victoria Street, as does general traffic. These routes are also used by pedestrians and cyclists, but do not always provide good facilities for these modes. The principal connections to western suburbs are via Bowen Street / Glenmore Street, Salamanca Road and Aro Street. SH1 is operated by the Transport Agency traffic operations centre at Johnsonville. Other traffic signals within the city are managed out of the traffic operations room in Wellington City Council. Rail services are operated from the Wellington Railway Station by Kiwirail and Transdev. Buses are managed by the operators, generally under contract to Greater Wellington Regional Council. Other key transport services include harbour ferries, which connect the waterfront and Eastbourne, and taxi services, which operate from taxi ranks through the central city. Finally, a key part of the transport system is the provision of parking and loading facilities within the central city. About 90% of commuter car parking spaces in the central city are off-street. On-street car parking and loading facilities are mainly used by non-commuters for short stay parking for business and shopping, and as taxi ranks. Transport system pressures There are a number of growing pressures on the central city transport system, which are summarised below. Modes competing for limited space on constrained corridors Transport routes to access the central city and key regional destinations, such as the port, airport and hospital, are limited and constrained by the geography of the harbour, hills, and development adjacent to the roads. At peak times the central city network and routes to the central city operate at close to full capacity, allowing little ‘slack’ for unplanned events such as crashes and severe weather. The system is also particularly vulnerable to seismic events, with several fault lines in the area. The Terrace Tunnel (southbound) and Mount Victoria Tunnel (westbound) are two key bottlenecks, or ‘gates’ that control the flow of traffic that use SH1 in the inner city. Traffic flow through these gates is already at or above capacity at peak times and approaches capacity during the inter-peak. As a result there are queues of traffic approaching the tunnels for much of the day. Figure 6 shows a summary of traffic volumes counted in 15 minute intervals at the Terrace Tunnel southbound for the month of February and the first two weeks of March 2016 for Tuesdays, Wednesdays and Thursdays2. It shows that the highest morning 15 minute volume occurs before the nominal morning peak of 7am to 9am. It also shows that traffic volumes remain high beyond the morning peak, as lower demands permit queue discharge. Increases in demand will see the queuing period extend later into the day till the morning peak and evening peak eventually merge. 2 The mean traffic volume profile (blue or 50th percentile) is shown along with 95 and 99 percentile synthesized profiles. 11
Figure 6 Terrace Tunnel Southbound Profiles February/March 2016

Figure 7 shows travel time ranges throughout the day through the Terrace Tunnel. The red data
points are the medians while the blue points show the range in travel speed. This graph shows how
travel speed decreases during peak operation when flow breakdown occurs, despite the relatively
constant flow rates through the tunnel shown in Figure 6.
 Travel Speed (kph)

Figure 7 Weekday State Highway travel speed and variability

12
Within the CBD, capacity is governed by the performance of the intersections on the relatively narrow
street network. More capacity has been squeezed out of the network through the adoption of one
way systems (for example, Featherston, Willis and Vivian Streets) and through some very limited
widening of the carriageway (for example, at Karo Drive). There is limited scope to increase the
capacity of the street network further without doing significant damage to the heritage and liveability
of the city itself.
The gate effect of the Mt Victoria Tunnel and Terrace Tunnel regulates the amount of traffic entering
the central city so that it can be managed on the local street network. There is a risk that removing
the tunnel capacity constraints could overload the central area network unless complementary
changes are made to the management of the system.
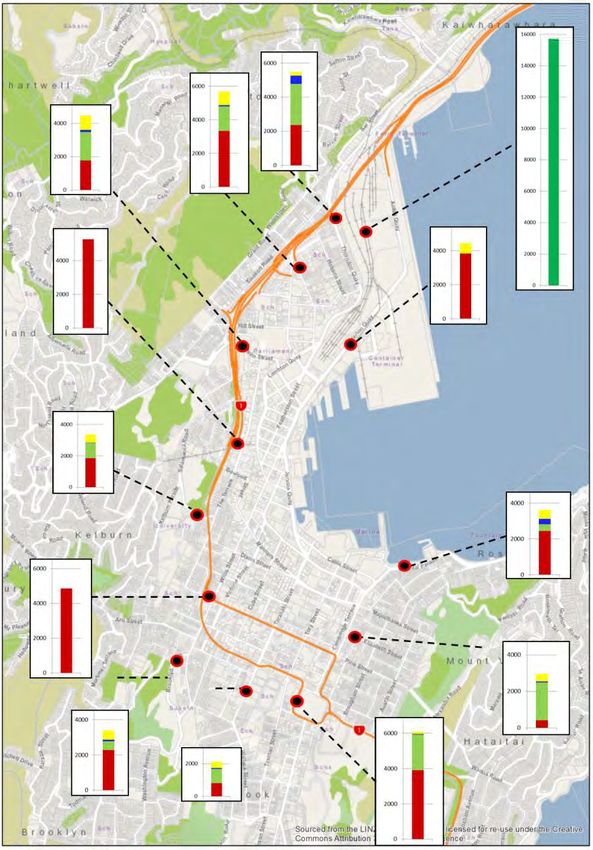
Motor vehicle Public
occupants Transport
Users
Figure 8 AM peak motor vehicle occupant volumes (left) and public transport patronage (right)
Public transport and active modes also have morning and afternoon peaks in demand. This is
particularly acute for rail, as shown below. Upgrades to rail rolling stock have delivered significant
improvements in levels of customer service over recent years.
Figure 9 Weekday AM Peak rail passenger arrivals at Wellington Railway Station, 7am to 9am
13Because of the concentration of bus services along the Golden Mile (approximately 25,000 people alight daily on the Golden Mile), bus congestion is a problem along that route at peak times. This is due to the large number of different bus services that use the route, the high bus frequencies needed to handle peak demand, and delays at intersections. Some of these problems will be reduced by changes to the bus network that will be rolled out from 2018. Changes will include reducing the number of different services flowing along this part of the public transport network and increasing the size of the buses. If population growth and patronage increases as forecast, possibly as soon as 10 years’ time there will be a situation when more public transport capacity needs to be added to keep up with demand. This would require more buses, eroding the benefits of more reliable travel times from having fewer buses on the network at peak times. Cross directional movements create conflict Increasing volumes for all modes at at-grade intersections are causing both weekday and weekend conflicts – by direction and mode. There are a number of key conflict points as SH1 passes through Te Aro, as shown in the diagrams below. While these conflicts can currently be managed through traffic signalling, it means queues and unreliable journey times for all modes of travel. 14
Figure 10 Volumes crossing Vivian Street and Karo Drive (persons) conflicting with persons in cars on Vivian Street and
Karo Drive – AM peak and Saturday peak

15
Examples of conflicts between north-south and east-west flows on this section of SH1 include:
16,000 people cross Vivian Street and 13,000 people cross Karo Drive in the morning peak,
with the majority of these movements in the north-south direction
21,000 people cross Vivian Street and 16,000 people cross Karo Drive in the Saturday peak,
with the majority of these movements in the north-south direction
Taranaki Street has the largest number of people crossing the state highway and is, along
with Victoria Street, the main crossing point for people in vehicles
Pedestrians account for 35% of people crossing Vivian Street in the AM peak, with this
percentage rising closer to 50% in the inter-peak and 45% in the PM peak
Willis Street/Victoria Street and Taranaki Street are the major public transport crossing
points, with approaching 25% of the people crossing the state highway at these points during
peak periods doing so by public transport
Throughout the whole day, between 200 and 300 people cross Vivian Street every 15 minutes
at Cuba Street.
A key conflict point occurs at the Basin Reserve at the eastern end of the one-way system, where
there is:
A directional conflict between east-west through traffic on SH1 and north-south movements
between the central city, Newtown and the southern suburbs
A modal conflict between public transport corridor and active modes (predominantly moving
north-south across the Basin Reserve) and private vehicles (entering/exiting the Basin through
the Mount Victoria Tunnel).
The Waterfront route is a six lane road with additional turning lanes in places, but it is also a
significant pedestrian route for both recreational journeys and journeys to and from work. The Bunny
Street crossing (connecting Wellington Railway Station and the waterfront route) has approximately
1,000 pedestrians crossing during the morning peak period.
Figure 11 shows two-way pedestrian volumes at selected locations in Wellington CBD on weekdays
and Saturdays. Most of the crossings from the CBD to the waterfront area (Waterloo Quay,
Customhouse Quay, Jervois Quay and Cable Street) are at-grade signalised crossing points, a key
exception being the ‘City to Sea Bridge’ which provides an elevated crossing above Jervois Quay with
spectacular views of the harbour.
On Saturdays, the City to Sea Bridge, is used by about 2,250 pedestrians over a two hour period in the
middle of the day. Sunday shows a similar pattern, with the City to Sea Bridge being the busiest
crossing location.
16Figure 11 Two-way pedestrian volumes at selected locations in Wellington CBD, weekdays and Saturdays On the Golden Mile, there is a conflict between active modes and buses and other traffic movements giving rise to safety and environmental issues. To some extent this conflict is inherent in delivering large numbers of people to bus stops very close to their end destinations in the commercial heart of 17
the city. Some of these problems will be reduced by the planned changes to the bus network that will
reduce the number of buses, and phase out older models.
Growth in transport demand
The growth in population and employment in the central city over the next 30 years may drive
increasing demand for transport journeys to, from, within and through the central city. Using central
demographic and economic growth assumptions, transport modelling shows an increase of 20% to
25% in car or public transport trips across the region over the next 30 years.
Many new journeys will be short journeys within the central area as people walk or cycle to work, or
move around the CBD during the day. There will also be significant growth in commuting to work from
suburbs outside the central city, as well as journeys through the central city for travel to work,
business and leisure purposes.
Economic development will also drive an increase in goods and service vehicle movements, although
these will remain a small proportion of total vehicle movements.
Future transport system modal choices
In order to better understand likely future changes in demand and performance, transport modelling
has been undertaken using a set of Do Minimum assumptions that only include the following
significant committed projects:
Wellington City Bus Network improvements (implementation July 2018)
SH1 Transmission Gully (opening 2021)
SH1 Peka Peka to Otaki (opening 2020).
Appendix 1 summarises the Do Minimum assumptions and Appendix 2 summarises the modelling
carried out.
The modelling results indicate that, while the road network can accommodate some of the forecast
growth in demand for commuting journeys in the form of private vehicle movements, most of the
growth will need to be accommodated through increased use of public transport and active modes.
The modelling results for journeys crossing an imaginary cordon around the central area in 2026 are
summarised for morning peak flows below:
The number of vehicles crossing the cordon is expected to increase by 5% to 8% in the
morning peak. This relatively modest growth is the result of congestion, network constraints
and parking supply constraint (in Wellington CBD) limiting growth in vehicle traffic volumes
inbound
However, alternative routes to SH1, such as Thorndon Quay (from the north) and Oriental
Parade (from the east), show 10% to 15% and 15% to 20% increases respectively in traffic
volumes (inbound) in the AM peak by 2026. This is a result of vehicles re-routing to avoid
peak time congestion on SH1 through the central area and the Mt Victoria Tunnel
Public transport trips crossing the cordon (inbound) in the AM peak are forecast to increase
by between 15% and 20% by 2026, three times greater than the comparable forecast
increase in car trips crossing the cordon (5% to 8%). The differential between car and public
transport growth is likely to occur because the road network won’t have enough capacity to
handle an equivalent increase in private vehicles at peak times during the week3. Around two
thirds of this growth in public transport trips is forecast to occur on the rail network
3
The forecast also reflects the modelling assumptions made about the relative costs of private motoring and
public transport fares
18 Based on recent trends, and the proposed location of future population growth in the vicinity
of the central city, walking and cycling trips are expected to have higher growth rates than
those forecast for car and public transport trips over the next 10 years.
Future transport system performance
The Do Minimum modelling indicates declining levels of service across the central city for all modes
over the next decade. Estimates based on the model results indicate that the total annual cost of
weekday vehicle delay is most likely to increase by 30% to 50% over this period4.
Cars and trucks
Table 2 shows how average travel times are forecast to increase for selected routes over the next 10
years, together with an indication of how the maximum 95th percentile journey time might change
(this is essentially the time that someone should allow for a particular journey in order to arrive at
their desired time for 19 out of 20 days).
An increase in the 95th percentile effectively means that travel times are becoming more variable /
unpredictable. People will often not get to their destination on time, leading to a reduction in
productivity and/or leisure time; or they will leave their origin too early, losing personal time.
Poor travel time variability can also result in goods being delayed getting to and from the port, airport
and businesses, leading to impacts on economic productivity. In some cases, the delays mean that
businesses and logistics operators will need additional vehicles and drivers to insure against travel
time variability, further adding to congestion.
Morning peak travel times on SH1 between Ngauranga Gorge and the airport could increase by up to
25% by 2026, with a corresponding 35% worsening of predictability of travel times.
In the inter-peak, travel times are only forecast to increase by 5% to 10%. This reflects that inter-peak
congestion is not forecast to be as severe as in the AM and PM peaks (notwithstanding an expected
spread of the peaks into the current inter-peak period), and that there is some spare capacity.
4
‘Estimates of costs of road congestion in Wellington’ indicates an increase in annual congestion costs from
$98M-$168M to $133M-$226M. The resulting increase is most likely around $50M.
19Table 2 Predicted increases in travel time and travel time reliability for some key routes over 10 years
Estimated 95th Estimated 95th Estimated 95th
Average Average Average
percentile percentile percentile
15% to 5% to 10% to
Airport to Ngauranga Gorge (via SH1) 25%
25% to 35%
10%
10% to 15%
20%
20% to 30%
15% to 5% to 10% to
Ngauranga Gorge to airport (via SH1) 25%
25% to 35%
10%
10% to 15%
20%
25% to 35%
Newtown to Johnsonville (via Basin Reserve, waterfront, 10% to 5% to 10% to
15% to 25% 5% to 10% 20% to 30%
Hutt Road) 15% 10% 20%
Johnsonville to Newtown (via Hutt Road, waterfront, 15% to 5% to 10% to
25% to 35% 5% to 10% 20% to 30%
Hutt Road) 25% 10% 20%
20Bus services As the network operates at or near capacity during peak periods, only relatively small increases in traffic volumes result in increased public transport travel times at peak times. Over the next 10 years, bus travel speeds are forecast to deteriorate across all routes. The following table shows the percentage increase in travel times for some bus routes between 2016 and 2026 indicated by the model. The model does not account for changes in boarding and alighting times. The modelling indicates peak period average bus travel speeds typically deteriorate at a faster rate than inter-peak bus travel speeds. The possible changes are expressed as a range due to the nature of daily variability in public transport travel times, with the upper end of the range broadly relating to how the 95th percentile bus travel time (a measure of variability) might change relative to current performance. Table 3 Indicative percentage increases in bus travel times 2016 - 2026 Between Island Bay and the Wellington Railway Station (and vice-versa) 10%-25% Between Miramar and the Wellington Railway Station (and vice-versa) 5%-25% Between Karori and Lyall Bay (and vice-versa) 10%-20% Between Kingston and the Wellington Railway Station (and vice-versa) 10%-20% Between Newlands and Courtenay Place (and vice-versa) 5%-10% Walking and cycling As congestion and conflicts between modes increases, pedestrians and cyclists will also experience increasing journey times and unreliability in the central city. It is likely that the volumes of pedestrians at peak periods (for example exiting the railway station and crossing Bunny and Whitmore Streets) will make it harder to manage orderly pedestrian flows at key crossing points on central city streets. This breakdown in the orderly management of the network will lead to an increase in safety risks for pedestrians and cyclists, due to people jay walking and ignoring traffic signals. It will also reduce the effective capacity of the network for bus services trying to get into and out of the central area, and general traffic trying to travel through the central area to destinations beyond. For the five year period to 2016, the Transport Agency’s Crash Analysis System recorded approximately 3,500 crashes within the LGWM study area. Of these crashes, approximately 5% resulted in a death or serious injury. Pedestrians and cyclists were involved in approximately 500 crashes, 30% of which resulted in a death or serious injury. Pedestrians and cyclists were involved in almost 60% of death and serious injury crashes. The Transport Agency Communities at Risk Register notes that Wellington has high rates of personal risk for cyclists, pedestrians, urban intersections, and motorcyclists. The following figure demonstrates the forecast increase in walking and cycling within the city, with an associated increase in conflict with vehicle traffic. 21
Figure 12 Forecast increases in peak walking and cycling at key locations

While Figure 12 shows forecast increases in people walking and cycling, the potential for growth is
much greater. The forecasts are proportionate to assumed changes in population and employment
and don’t fully capture potential modal shifts. Improvement in cycling infrastructure and safety may
create conditions for high rates of growth.

22
Land transport resilience issues
The Wellington transport network is vulnerable to a variety of natural hazard event types and man-
made disruptions. The resilience of the wider transport network is particularly important in
responding and recovering from large events. The transport network provides access to key recovery
locations such as CentrePort, Wellington Hospital and Wellington Airport. It also enables other
utilities to respond, such as water, power, communications and fuel, which rely on the transport
network.
Natural hazard vulnerability
The Wellington land transport network is vulnerable to earthquake, storm and tsunami events. The
Kaikoura earthquake in November 2016 showed that the transport network within the CBD is also
vulnerable to closure as a result of damage to adjacent buildings.
A large earthquake would disrupt many routes through Wellington, including high risk sections of
state highway, with the risk of adjacent building stability affecting a large number of local network
roads within the central area. Large storm events have the potential to close significant sections of
the CBD with surface flooding, but for relatively short periods of time. Coastal routes or roads next to
significant cliff faces are vulnerable to landslides and under-slips, which may take longer to fix.
Tsunami events would disrupt road and rail access through coastal and low-lying areas.
Incident vulnerability
A transport system that does not have much spare capacity, or many alternative routes, is intrinsically
lacking in resilience. As a result, small incidents on the network can affect a large number of people.
Information collected by the Wellington Traffic Operations Centre for the state highway network
shows that there were 438 incidents between the Terrace Tunnel and the airport from 1 July 2015 to
30 June 2016. These were mainly crashes and breakdowns, resulting in significant delays for road
users. The average delay was 1.3 hours for a breakdown and 3.7 hours for a crash.
If no improvements are made, this problem will worsen as congestion increases. Not only will this
affect through-traffic on SH1, but the biggest congestion effects will be within the central city itself,
for example, on the waterfront route, Oriental Bay, Whitmore Street, Featherston Street, the Terrace,
and Adelaide Road.
Currently, if there is crash in the Terrace Tunnel, traffic can be diverted to the Terrace and other CBD
routes. If there is a breakdown in the Mt Victoria Tunnel, traffic can be directed around the bays. In
the future these alternate routes will have less spare capacity, resulting is greater disruption from
events.
Environmental and health issues
The transport system’s main environmental and health impacts are from:
Health-damaging vehicle emissions, including carbon monoxide, nitrous oxides, carbon
particulates, noise, and vibration
Greenhouse gas emissions, including primarily carbon dioxide from petrol and diesel engines
Community severance and visual intrusion, including the impacts of wide and busy roads, and
elevated structures such as bridges and flyovers.
These impacts are considerable in Wellington’s central city because the main traffic flows pass
through the urban street network, notably the Vivian Street/Karo Drive one-way pairs, Basin Reserve
and the waterfront route. Much of the inner city road network is relatively narrow and is used by
motor vehicles, pedestrians and cyclists, all of whom move at close quarters to each other. Buildings
are adjacent to the road corridor, often without significant setback.
A key driver for the scale of the environmental impacts of the transport system is the number of
motor vehicle kilometres travelled because, in general, the more kilometres travelled, the greater the
emissions, severance and intrusion. Modelling shows an increase in vehicle kilometres travelled in the
23focus area between 2016 and 2026 for the Do Minimum scenario5. On a congested network, relatively
small increases in numbers of vehicles are likely to result in more ‘stop-start’ vehicle movement, and
more pollution.
Table 4 Projected percentage increase in vehicle kilometres travelled between 2016 and 2026
Morning peak
5% to 10%
(7am – 9am)
Inter-peak
10% to 15%
(11am – 1pm)
Evening peak
7% to 12%
(4pm – 6pm)
Against this trend, however, regulatory and other changes will tend to reduce some of the
environmental impacts. Vehicle standards legislation is progressively requiring vehicles to reduce
health-damaging emissions. As newer vehicles replace older ones, the vehicle fleet will pollute less for
a given total distance travelled. The advent of progressively more fuel efficient engines, and the
growth in the number of hybrid and electric vehicles, will further reduce both health damaging
emissions and greenhouse gas emissions. The realisation of these benefits may be accelerated
through, for instance, national policies to further incentivise the use of electric vehicles.
However, community severance and visual intrusion will still occur irrespective of the type and
efficiency of vehicle engines.
How these countervailing trends – increased vehicle kilometres versus less polluting vehicles – will
balance each other out has not yet been modelled for the central city. As a result, it is not clear what
the net environmental impact of the Do Minimum scenario will be over the next 30 years.
Technological changes
In addition to the environmental benefits discussed in the previous section, vehicle technology
advances will also bring significant safety benefits. Modern vehicle safety systems, such as
autonomous braking, will improve safety outcomes not only for vehicle occupants but also for
pedestrians and cyclists.
Whether technological changes will be helpful in addressing the key problem of growing demand for
motor vehicle trips with constrained road network capacity remains uncertain, however. For example:
The increased use of mobility-as-a-service (the use of information systems to enable
customers to have more flexibility to choose the mode of travel for particular journeys on a
pay-per-use basis) may lead to reduced car ownership, and a willingness to use other modes
more often than is currently the case. However it may also lead to the increased circulation of
taxis and other vehicles around the network, worsening congestion
5
This is due to the growth in population and economic activity resulting in more trips. The modelling is
indicating this underlying growth in trips will outweigh the expected modal shift to public transport and
walking and cycling
24 The advent of autonomous vehicles may, in time, enable vehicles to travel at an optimum
distance for any given speed. This may make the system safer and, through smoother
acceleration and braking, more energy efficient. It will also make better use of transport
infrastructure by fitting more vehicles onto the network. However, it may also lead to more
vehicle kilometres being travelled on the network, increasing greenhouse gas emissions and
other pollutants. It may also act as a disincentive for people to use public transport, adding to
congestion.
A particular issue will be the impact of new technology on the effectiveness of parking controls. At
present the high cost of parking in the central city plays a crucial role in managing demand for private
vehicle use, particularly for commuting journeys. The use of mobility-as-a-service could see a
reduction in the effectiveness of this pricing mechanism as the main demand management tool.
In summary, technological changes may be helpful in addressing some of the problems identified in
this paper, but there is uncertainty about the net effect of technological changes on the key issue of
growing demand for motor vehicle trips with constrained road network capacity. It seems very
unlikely that technology will solve this problem without other changes also being made to the way the
transport system is operated.
Overall assessment of future trends on Do Minimum assumptions
In the absence of further significant improvements to the transport system, levels of service will
progressively deteriorate for all modes, resulting in poorer environmental conditions, unpredictable
journey times, and safety issues.
Figure 13 summarises the key issues facing Wellington’s transport system.
By 2026, without significant changes to the transport network, preliminary transport modelling
indicates:
There could be 10% to 15% more car and public transport trips to, from, and within
Wellington City by 2026. The increase in walking and cycling trips is expected to be much
greater due to the increase in the concentration and number of people living in the central
city
The volume of people crossing key intersections in the central city at peak periods will
increase, making it harder to manage orderly pedestrian flows, increasing safety risks for
people walking and cycling
Bus service peak travel times could be up to 25% longer on some bus services, with bus travel
times forecast to deteriorate across all routes
Average morning peak travel time for some trips on SH1 between Ngauranga Gorge and the
airport could increase by up to 25% by 2026, with a corresponding worsening in the
predictability of these journey times
The evening and morning peaks on SH1 between the Terrace Tunnel and Mt Victoria Tunnel
will come closer together and the route will remain at or close to capacity for much of the day
Some local roads will see much greater percentage increases in traffic flows than SH1, which
is already at or near capacity. Examples include 15% to 20% more vehicles on Oriental Parade,
and 10% to 15% more vehicles on Thorndon Quay
The total annual cost of weekday vehicle delay is most likely to increase by about 30%-50%.
25You can also read