Lightening the load: quantifying the potential for energy-efficient lighting to reduce peaks in electricity demand
←
→
Page content transcription
If your browser does not render page correctly, please read the page content below
Energy Efficiency
https://doi.org/10.1007/s12053-020-09870-8

 ORIGINAL ARTICLE

Lightening the load: quantifying the potential
for energy-efficient lighting to reduce peaks in electricity
demand
Carsten Dortans & Michael W. Jack                 &   Ben
Anderson & Janet Stephenson

Received: 17 November 2019 / Accepted: 12 May 2020
# The Author(s) 2020

Abstract One of the key challenges to greater renew-           efficient lighting adoption. Our estimates suggest that
able electricity supplies is the temporal mismatch be-         whilst lighting comprises ~ 4% of overall New Zealand
tween non-dispatchable renewable sources and peaks in          annual electricity consumption, it comprises up to 12%
electricity demand. In addition, increased electrification     of evening peak electricity consumption in winter. As a
coupled with the de-carbonisation of electricity genera-       result, we estimate that by 2029, more efficient residen-
tion is likely to increase the scale of demand peaks. This     tial lighting could reduce New Zealand’s total annual
could force investment in carbon-intensive peaker gen-         demand by 1 TWh and reduce the highest winter eve-
eration or capital intensive storage capacity as well as       ning peaks (at 17:00) by at least 500 MW (9%). The
additional transmission and distribution network capac-        winter evening demand reduction would be roughly
ity which may then be substantially underutilised.             equivalent to avoiding the need for additional generation
Whilst considerable effort has been devoted to testing         capacity of the scale of New Zealand’s Huntly Power
a range of demand response interventions to reduce or          Stations 1–4 (coal/gas) plus the Stratford peaker plant
shift consumption, less attention has been given to the        (gas open-cycle) and has clear implications for any
ability of certain appliances to permanently reduce de-        electricity system that is intending to transition towards
mand at peak through energy efficiency. In this paper,         ~ 100% renewable generation at least cost.
we use a published model of future energy-efficient
lighting uptake together with multi-year measured light-
ing demand data from a sample of residential house-            Keywords Peak electricity demand . Efficiency .
holds to model the potential power (MW) and energy             Lighting . Projection . New Zealand
(MWh) reductions of a ‘business as usual’ rate of

C. Dortans (*) : B. Anderson : J. Stephenson                   M. W. Jack
Centre for Sustainability, University of Otago, Dunedin, New   Department of Physics, University of Otago, Dunedin, New
Zealand                                                        Zealand
e-mail: carsten.dortans@postgrad.otago.ac.nz                   e-mail: michael.jack@otago.ac.nz

e-mail: carsten.dortans@web.de                                 B. Anderson (*)
                                                               Faculty of Engineering and the Environment, University of
                                                               Southampton, Southampton, UK
J. Stephenson                                                  e-mail: b.anderson@soton.ac.uk
e-mail: janet.stephenson@otago.ac.nz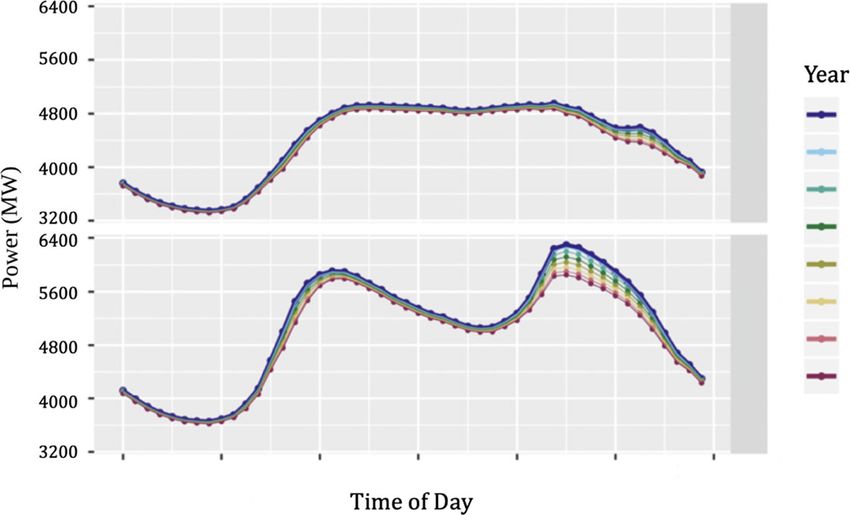
Energy Efficiency

Introduction                                                   is one demand side management option that could be
                                                               particularly effective in countries where the residential
Electrification and renewable electricity generation are       sector is a main contributor to peak demand (New
considered to be the two pillars of a low-carbon energy        Zealand Electricity Commission 2005; Losi et al. 2015)).
transition (Bull 2001; International Energy Agency             Several studies have explored the technical potential for
2019; Yuan and Zuo 2011) because an increase in the            residential load shifting and load curtailment to reduce
share of renewable electricity sources has significant         peak demand (Arteconi et al. 2013; Bronski et al. 2015;
scope to reduce energy-related greenhouse gas emis-            and Dyson et al. 2014). These studies suggest that demand
sions (Long et al. 2011). However, renewables collec-          response can shift up to 20% of the annual electricity
tively constitute a less predictable generation resource       demand and 8% of peak demand without compromising
(Beaudin et al. 2010; Su et al. 2014; Müller and Möst          comfort and service quality (Bronski et al. 2015) although
2018) and this is especially problematic when peak             the reproducibility and generalisability of many of these
residential electricity demand occurs in the morning           studies is in some doubt (Frederiks et al. 2016; Huebner
and evening in winter in many countries (Alham et al.          et al. 2017; Srivastava et al. 2018) (Frederiks, Stenner,
2017; Muenzel et al. 2015). With increased electrifica-        Hobman, & Fischle, 2016; Huebner et al. 2017;
tion of energy services, these peaks are likely to increase    Srivastava, Van Passel, & Laes, 2018).
leading to the need for additional peaking generation              On the other hand, whilst the ability of energy efficien-
and network capacity reinforcement. Since dispatchable         cy to reduce overall electricity consumption has been
fossil fuel generation can be used for demand peaks as         widely discussed (IEA 2018; Ministry of Business,
well as base demand, the high cost of providing over-          Innovation, and Employment 2017; Mori et al. 2011;
capacity of renewable supplies to meet peaks in demand         Saidur 2009; Tonn and Peretz 2007; Worrell et al. 2003),
is one argument against entirely eliminating fossil fuels      its role in reducing the temporal mismatch between supply
from power systems (Interim Climate Change                     and demand and thus contribute to demand side manage-
Committee 2019; Pereira et al. 2016).                          ment is less studied (Gellings 2009). Clearly, energy effi-
    One of the key challenges to greater renewable elec-       ciency has significant potential to reduce peaks when those
tricity supplies is therefore the temporal mismatch be-        peaks are driven by electricity uses which are open to
tween non-dispatchable renewable sources and peaks in          efficiency gains (Buonocore et al. 2016; International
electricity demand (Mirza et al. 2009; Müller and Möst         Energy Agency 2012; McNeil et al. 2019; Worrell et al.
2018; Reddy and Painuly 2004). This means the electric-        2003) and especially in the residential sector in countries
ity system needs to find a balance between the provision       where household electricity contributes disproportionately
of sufficient capacity to supply demand and the risk of        to demand peaks. In these circumstances, more efficient
endangering economic profitability of energy assets, par-      household appliances could permanently reduce demand
ticularly when renewable generation is high (Grunewald         both overall and, crucially, at peak times. In particular,
and Diakonova 2018; Müller and Möst 2018;                      efficient appliances that reduced demand during annual
Transpower New Zealand Limited 2018). Resolving this           peaks in electricity system demand could (a) reduce the
may require a mix of capital intensive over-capacity of        transmission and distribution network capacity needed in
renewable supply (Denholm and Hand 2011; Lund et al.           any electricity system, (b) reduce the need for emission-
2015), continued use of fossil-fuelled generation to meet      intensive peaking plants and (c) reduce the over-capacity
shortfalls (Painuly 2001) and demand side management           needed in a fully renewable system. As an example,
(Strbac 2008). Reducing peak demand, especially under          energy-efficient lighting technologies such as light emit-
future scenarios of greater electrification of heat and        ting diodes (LED) have rapidly reduced in price and
transport (Dyke et al. 2010; Pudjianto et al. 2013), is        provide a significant reduction in electricity demand for
therefore a particularly important strategy for reducing       the same luminescence (Schubert 2014). However, despite
the cost of integrating renewables (Energy Efficiency and      the apparent benefits, there has been limited work on
Conservation Authority 2019) as well as reducing the           quantifying the role of energy efficiency in reducing de-
need to invest in network re-enforcement caused by             mand peaks (Arteconi et al. 2012; Bronski et al. 2015;
increased electrification per se.                              Dyson et al. 2014).
    Residential demand response, where consumer electric-          In response, this paper models national scenarios of
ity demand is shifted and/or reduced in response to signals,   energy-efficient lighting uptake and quantifies the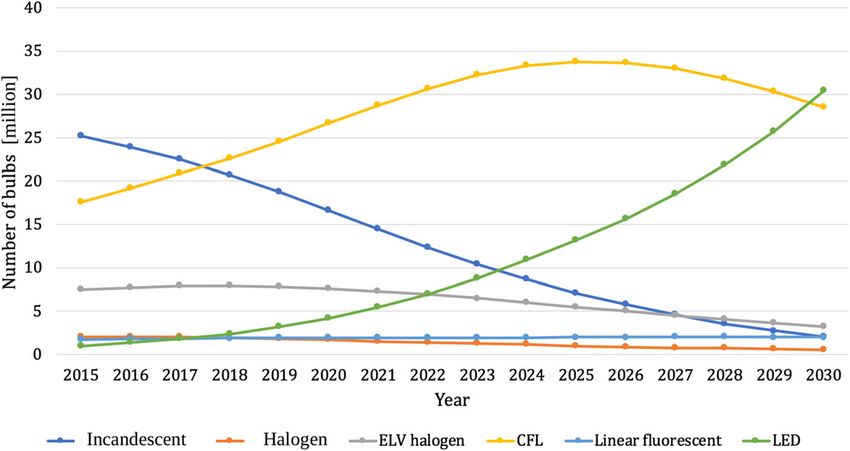
Energy Efficiency

resulting reduction in demand during peak demand pe-          therefore currently needed from fossil-fuelled genera-
riods. Specifically, we combine national forecasts of         tors (Khan et al. 2018).
energy-efficient lighting uptake in New Zealand with             In this paper, we quantify the potential effect of energy-
detailed time-of-use data on residential lighting demand      efficient lighting on reducing annual demand peaks in
to quantify the potential reduction in winter peak de-        New Zealand. We do this by combining detailed time-of-
mand. We then estimate the contribution this could            use data of residential lighting demand (Anderson et al.
make to overall system demand reduction in order to           2018) with national-level energy demand data (Energy
explore the value of strategically chosen energy efficien-    Efficiency and Conservation Authority 2017a) and a pub-
cy programmes in reducing both fossil fuel use and            lished future lighting technology uptake scenario
network capacity requirements in renewable-                   (EnergyConsult PTY LTD 2015).
dominated electricity systems. The main innovation of            New Zealand’s electricity demand is highest overall
this paper is quantifying the reduction in future electric-   in winter and there are two peaks daily, morning and
ity demand resulting from the uptake of energy-efficient      evening, throughout the year, although much more pro-
lighting.                                                     nounced in winter (Fig. 1). Daily average demand in
    This paper is organised as follows. The next section      2017 varied between 3.8 GW (summer early morning)
provides further context on the New Zealand energy and        and 6.2 GW (winter evening) and the relative size and
electricity supply system. We then introduce the data         ‘peakiness’ of winter demand is a challenge for the
and methods used to estimate the technical potential for      integration of non-dispatchable renewable generation
residential lighting to reduce peak demand at different       at significant scale (Ministry of Business, Innovation,
seasons of the year. “Results” presents the findings of       and Employment 2019).
our analysis, and “Discussion and conclusions” situates          Figure 2 uses the latest available New Zealand Ener-
our findings in the broader literature on demand-side         gy End Use Database (Energy Efficiency and
management. The final section draws implications for          Conservation Authority 2017a) to show total electricity
policy both in New Zealand and internationally and            consumption for New Zealand by sector in 2015 and the
identifies areas of further work.                             contribution to overall consumption by different house-
                                                              hold appliances. Thus, the residential sector was esti-
                                                              mated to be responsible for 32% of total electricity
                                                              consumption in 2015 and residential lighting made up
New Zealand context                                           4% of this total. Since lighting use is concentrated in
                                                              winter due to less daylight hours (Table 1) and occurs at
New Zealand is a particularly interesting case to inves-      times that are likely to correspond to peak demand
tigate the potential for lighting efficiency to reduce        periods, its contribution to peak winter demand is likely
annual peak demand because electricity makes up 24%           to be much larger than 4%. As a result, the introduction
of New Zealand’s total energy consumption (15% in the         of energy-efficient lighting in New Zealand homes is
UK, 14% in the USA) and in recent years has ranged            likely to reduce peak electricity demand by much more
between 80 and 85% renewable electricity (Department          than 4%.
for Business, Energy, and Industrial Strategy 2019;
Ministry of Business, Innovation, and Employment
2018; U.S. Energy Information Administration 2019)
with the aim of 100% renewable electricity in normal          Data and method
conditions by 2035 (New Zealand Productivity
Commission 2018). Renewable generation is dominated           We use several data sources to estimate the potential
by hydro, with wind and geothermal also contributing.         effect of increasing energy efficiency in residential light-
Hydro is generally dispatched first to meet demand            ing on national peak electricity demand. These sources
peaks but can suffer from low hydro inflows in autumn         are described below in more detail and comprise:
and early winter. As with many high latitude and tem-
perate nations, energy demand in New Zealand is               &   A published future New Zealand residential lighting
highest in winter and in the absence of international             technology uptake scenario for 2015 to 2029
interconnections, support to meet winter peaks is                 (EnergyConsult PTY LTD 2015) to provide annual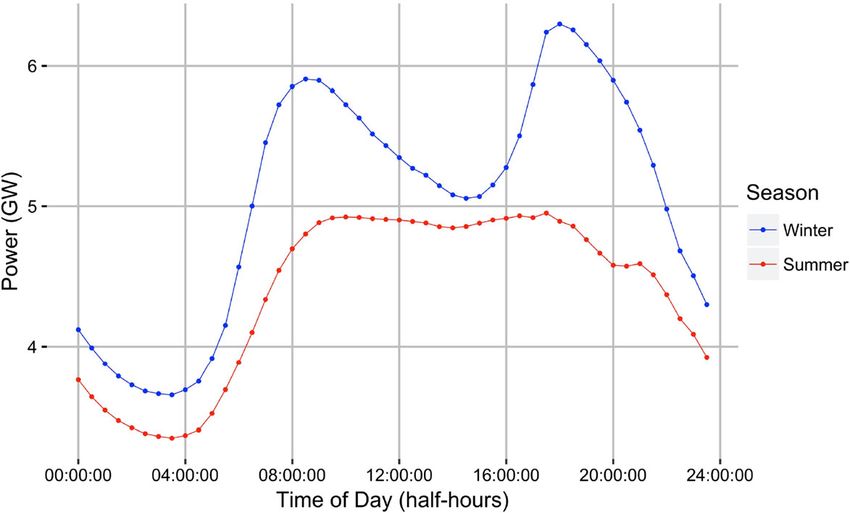
Energy Efficiency

Fig. 1 Mean daily electricity
demand (GW per half hour) in
summer and winter 2017 (Source:
Own calculations using
(Electricity Authority 2018))

    estimates of the future prevalence of different light-   2029 in the absence of any government intervention
    ing types and their overall electricity consumption      (EnergyConsult PTY LTD 2015).
&   National-level New Zealand total energy and elec-           The RBS model estimated that the number of lights
    tricity consumption data (Energy Efficiency and          per house increased at a steady rate to 2010 due to
    Conservation Authority 2017a) to provide informa-        increased dwelling size and use of downlights but then
    tion on current levels of consumption                    increases at a slower rate to 2030 (EnergyConsult 2015,
&   Circuit-level monitoring of lighting electricity de-     p. 19). Stock numbers were calculated from both histor-
    mand at one-minute intervals for 21 New Zealand          ical and projected dwelling numbers and projected an-
    houses over a multi-year period to provide data on       nual number of lights per dwelling. This stock was then
    the likely temporal profile of lighting demand           allocated to the following technologies based on
&   National electricity generation data (Electricity        projected proportions:
    Authority 2018) to provide the context for assessing
    the significance of the modelled demand reduction        a.   Incandescent lights
    due to lighting efficiency gains                         b.   Halogen lights
                                                             c.   Electric low voltage halogen lights
    We detail how each of these is used below, but in        d.   Linear fluorescent lights
summary, the method involves rescaling the published         e.   Compact fluorescent lights
annual lighting electricity consumption values from the      f.   Light-emitting diodes
New Zealand efficient lighting uptake scenario
(EnergyConsult PTY LTD 2015) to fit national level              The RBS assumes that future sales of incandescent
figures. We then use the seasonal lighting demand pro-       lights cease by 2020, and sales of LEDs are assumed to
files derived from the monitored data to proportionately     increase leading to a decline in halogen, compact fluo-
distribute these annual values by season and half-hour.      rescent, and linear fluorescent lights from 2017. Al-
The model therefore comprises a simple technological         though some of these assumptions could be critiqued,
substitution model with no change in complex and inter-      the RBS is the only publicly documented and apparently
connected habits and no rebound effects (Fouquet and         plausible future lighting scenario available in New
Pearson 2012).                                               Zealand for the purposes of this study.
                                                                The resulting residential lighting stock forecast,
Calculating annual electricity consumption for lighting      which accounts for both uptake and population growth,
under efficiency uptake                                      is shown in Fig. 3. In the baseline year 2015, 46% of
                                                             residential lighting units were incandescent lights,
EnergyConsult’s Residential Energy Baseline Study            followed by compact fluorescent lights with a penetra-
(RBS) contains a forecast of lighting stock proportions      tion of 32%. Energy-efficient technology such as light
by technology in the residential sector from 2015 to         emitting diodes comprised a relatively insignificant 2%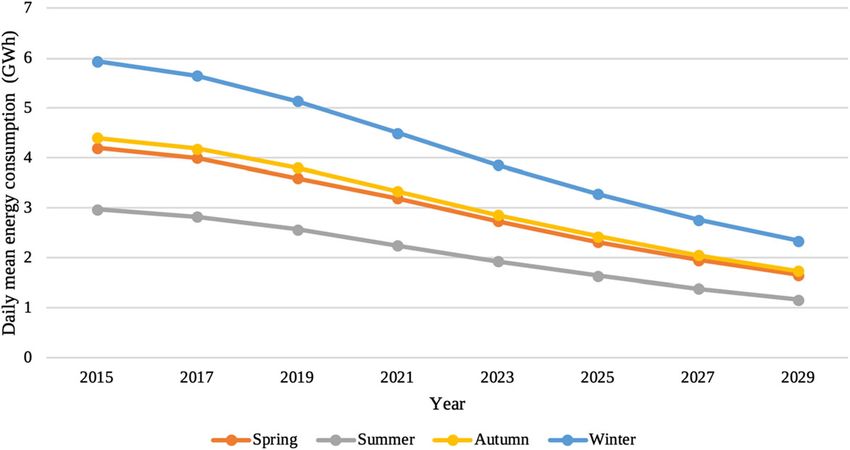
Energy Efficiency

Fig. 2 Electricity consumption in
New Zealand by sector and end-
use in 2015 (Energy Efficiency
and Conservation Authority
2017a)

of the stock. However, over time, a significant decrease
of incandescent lights and an increase of light emitting         2015 ¼ ∑ E 2015t ;
                                                               E EECA                                                      ð3Þ
                                                                          t
diodes are forecast with the proportion of incandescent
lights decreasing to 3% and light emitting diodes in-             We assume that the need for this re-weighting was
creasing to 46% by 2030.                                       caused by systematic underestimation in the uptake
   The RBS study then uses these stock projections to          scenario model, and so, we repeated it in each year with
estimate the energy demand for each technology and             the same upweighting ratio (EEECA/ERBS = 1.37).
year using the following:

                                                               Calculating annual seasonal lighting electricity
E RBS
  jt  ¼ eRBS
         t    S RBS
                 jt ;                                   ð1Þ
                                                               consumption profiles

where E RBS
        jt  is the energy consumption for each year j          In order to estimate the seasonal and temporal profile of
and technology t, eRBS
                     t   is the energy use per unit for each   lighting demand under the uptake scenario, we need to
technology t (which is assumed to not vary by year), and       estimate when lighting is actually used. If we assume
S RBS
   jt  is the average stock for each year j and technology     that the social practices that drive the temporal pattern of
t.                                                             lighting use (Walker 2014) will not change for different
      When summed, these energy consumption values             technologies (i.e. no time-shifting rebound effect), we
give the projected electricity consumption for lighting        can use measured lighting demand profile data for this
under this uptake scenario. However, the estimates for         purpose.
2015 proved to be 27% lower than national level resi-             The GREEN Grid household electricity study mea-
dential lighting electricity demand estimates for 2015         sured 1-min level electricity power demand data for 21
(Energy Efficiency and Conservation Authority 2017a).          New Zealand households in Hawke’s Bay and Taranaki
To account for this, the RBS values were re-weighted as        using commercially available monitors from 2014 to
follows:                                                       Table 1 Seasons and mean hours of direct sunshine for Taranaki
                                                               region (mid-New Zealand, Source: National Institute of Water and
                                                             Atmospheric Research 2010)
             EEECA
E jt ¼        2015
                     eRBS
                       t             jt ;
                                  S RBS                ð2Þ
             E RBS
               2015
                                                               Season                              Mean sunshine hours per
                                                                                                   month
where Ejt is the energy consumption for each year j and        Spring: September, October,         186
technology t used for our estimates, E EECA2015 is the total     November
lighting energy consumption for 2015 from EECA data,           Summer: December, January,          228
                                                                 February
E RBS
  2015 is the total estimated energy consumption for 2015      Autumn: March, April, May           178
using the RBS model and S RBS    jt   is the stock of each     Winter: June, July, August          139
technology and year. This ensures that: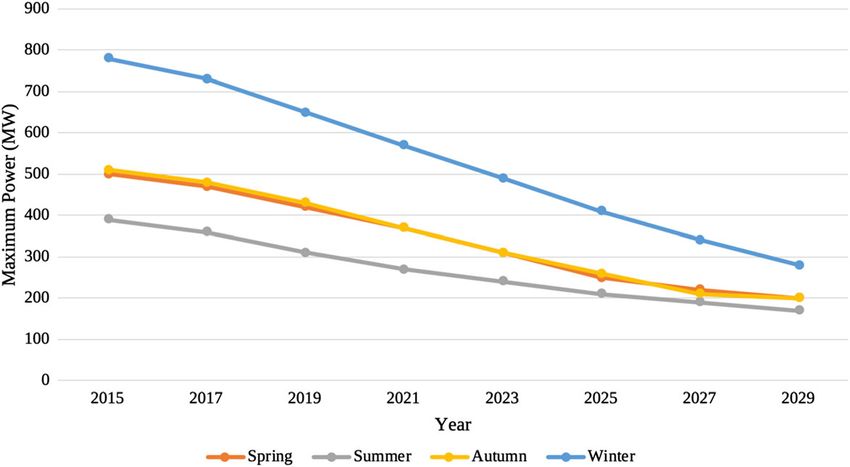
Energy Efficiency

Fig. 3 New Zealand household
lighting stock forecast by
technology (Source: Own
calculations based on
EnergyConsult PTY LTD (2015))

2016 (Anderson et al. 2018; Stephenson et al. 2018). In      were then used to apportion the total electricity demand
this paper, we use data for the year 2015 as it had the      (in MW) for lighting derived in the previous section to
maximum number of dwellings reporting data, had the          the 48 (half hours) × 4 (seasons) according to the shape
fewest data outages or quality issues and coincides with     of the measured profiles so that it summed to the total
the first year of the efficient lighting technology uptake   estimated consumption for that year, Ej. In addition, in
model described above. Whilst this sample cannot be          the absence of a robust alternative, we assume that the
considered representative of all New Zealand house-          efficiency of each specific lighting technology remains
holds due to its recruitment methods and focus on            constant and thus no additional benefits of efficiency
family households (Anderson et al. 2018), it provides        improvement within one lighting technology occur.
the most detailed data available on the temporal pattern     This is likely to mean that our efficiency savings are
of residential lighting demand in New Zealand. For           underestimates.
2015, the sample shows mean lighting consumption of
740 kWh (median = 618 kWh, s.d. = 691 kWh) or 9.6%
of mean total household consumption. If we assume that       Results
households are responsible for 32% of electricity con-
sumption (c.f. Fig. 2), then our sample suggests that        Estimated baseline lighting power demand for 2015
some 3.1% of total electricity consumption in New
Zealand is due to household lighting. This is marginally     Our analysis (Table 2) suggests that residential lighting
lower than EECA’s estimate of 4% (Fig. 2) and suggests       comprised ~ 12% of national winter evening peak pow-
that either our sample is not representative, or that the    er demand and ~ 10% of winter morning peak power
EECA data is an over-estimate, or some combination of        demand. The values are lower for winter daytime as we
the two.                                                     might expect, but winter off-peak evening lighting pow-
   As New Zealand spans 35 to 46.5° in latitude thus         er demand is roughly the same as during peak. Note that
producing considerable variation in daylight hours in        these results cannot be compared with Fig. 2 which
winter and summer, and the monitored households are at       shows annual electricity consumption rather than mean
around 39°, we consider them close to the mean daylight      power demand in a specific period.
length for New Zealand. Given this and our confirma-            To give further detail, Fig. 4 shows the estimated
tion that the sample’s lighting consumption is only          baseline national level lighting demand in MW by sea-
marginally lower than EECA’s estimate (see above),           son for 2015 calculated using the method described in
we assume that the mean demand profiles derived from         “Calculating annual seasonal lighting electricity con-
the sample will be at least indicative of the overall mean   sumption profiles”. Unsurprisingly, given the annual
New Zealand pattern.                                         variation in daylight hours, electricity demand due to
   We therefore use this data to calculate the sample        lighting was highest in winter and lowest in summer,
mean household electricity demand (in Watts) for light-      with spring and autumn intermediate. The maximum
ing for each half hour per season in 2015. These profiles    lighting demand for an average winter morning was
Energy Efficiency
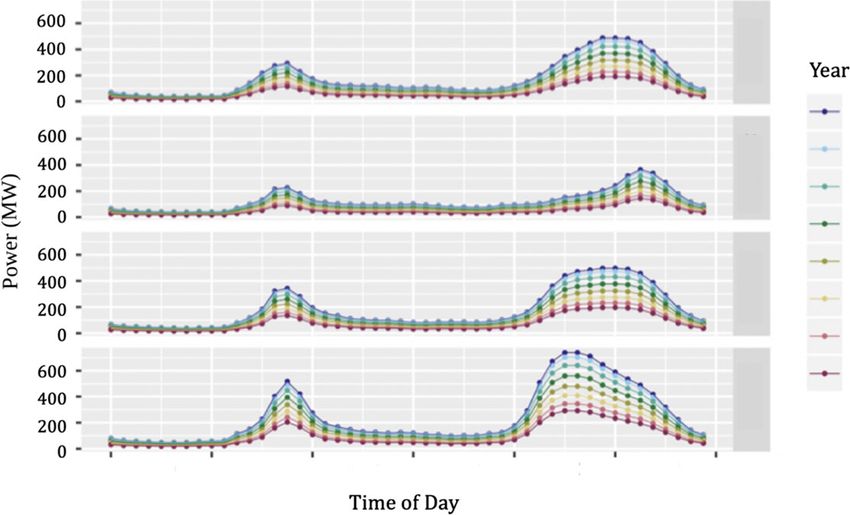
estimated to be 510 MW, more than double the summer Figure 6 shows that increased energy-efficient light-
morning peak of 220 MW. Lighting demand on winter ing could reduce mean peak demand in the morning by
evenings was much greater at 750 MW, whilst average up to 100 MW (summer) and 200 MW (winter) by
summer evening demand was 370 MW. 2029. The impact is particularly visible in the evenings
As Fig. 4 shows, the timing of morning lighting de- where evening peak demand is forecast to decrease to
mand varies little from season to season: demand rises 200 MW (spring), 170 MW (summer), 200 MW
from 05:00 onwards, reaches its maximum around 07:00 (autumn) and 280 MW (winter). This represents a de-
and falls rapidly over the following hour. In contrast, crease in national peak demand of up to 500 MW by
timing of demand in the evening varies considerably by 2029 as Fig. 7 shows.
season. In summer, demand starts to increase at 18:00 and Furthermore, we estimated that energy-efficient
reaches a short-lived maximum at 21:00 before falling lighting would reduce winter daily mean electricity con-
rapidly. In autumn and spring, demand starts to increase sumption by 2.34 GWh in winter by 2029. As Fig. 8
at 16:00, reaches the maximum between 18:00 and 19:00 shows, compared to 2015, when mean daily winter
and stays close to peak for 2 h (in spring) to 4 h (in residential lighting demand was ~ 6 GWh (12% of total
autumn). Demand in the winter evening starts to increase generation), this reduces to ~ 2 GWh (5% of total gen-
from as early as 16:00, reaches a maximum at 18:00 and eration) if no other demand changes are assumed. On a
stays high for several hours. seasonal basis, this means that overall electricity con-
Figure 5 shows the distribution of estimated mean sumption for lighting in winter would be 325 GWh
lighting demand for each season in 2015. Although the (60%) lower than it was in 2015.
plot is limited to 48 half-hour points for each season, it
indicates that whilst the majority of values fall below Consequences for national generation capacity
300 MW, there are some periods, especially in Winter requirements
but also in Spring and Autumn when much higher
demand levels occur. As a result, the mean-based model These results suggest that a higher penetration of energy-
used in this paper may underestimate the generation efficient lighting could permanently reduce national elec-
capacity needed to meet such large spikes in demand tricity demand, and thus required generation, especially in
(Transpower New Zealand Limited 2018). winter peak periods. Figure 9 shows the impact on na-
tional demand for summer and winter compared to the
2015 baseline reported in Fig. 1. Increasing energy effi-
Estimated energy consumption and demand reductions ciency associated with residential lighting, according to
over time our estimates, could reduce the highest winter evening
peaks (at 17:00; see Fig. 9) by at least 500 MW (9%) by
Table 3 shows the estimated total lighting electricity 2029 so that they fall to roughly the same level as the
consumption for each year of the forecast uptake of morning peaks. Smaller but potentially valuable reduc-
energy-efficient lighting (Fig. 3) per household and tions in peak demand can be obtained in winter mornings
nationally. These estimates show that residential light- and also in the evenings of all seasons.
ing electricity consumption would fall by ~ 60% be-
tween 2015 and 2029 so that, despite expected popula-
tion growth trends, approximately 1 TWh less genera- Discussion and conclusions
tion (3% of total energy consumption in 2015) would be
required due to the wider utilisation of energy-efficient By distributing baseline national lighting electricity con-
residential lighting. sumption from a published lighting efficiency uptake
Whilst the reduction in overall consumption is sub- model according to the half-hourly demand profiles of a
stantial, the reduction in peak demand is even more sample of measured residential households, we estimate
important for the reasons described above. Figure 6 that 12% of New Zealand’s winter evening peak period
shows the estimated national residential lighting de- electricity demand in 2015 was due to residential light-
mand (MW) profile for each year converted from the ing even though it only made up 4% of national annual
consumption estimates and illustrates the impact on electricity consumption. Whilst this estimate is limited
peak demand by season. by the small dataset of 21 lighting circuits from twoEnergy Efficiency
Table 2 Comparison of winter peak/off peak results for 2015 with national generation (i.e. demand) data for the same period (Source: own
calculations and Electricity Authority (2018))
Season Period Mean national GW Mean lighting GW Mean lighting contribution to Max lighting contribution to
generation demand period in % period in %
Winter Evening 5.98 0.66 11.07 12.35
peak
Winter Morning 5.66 0.36 6.48 9.95
peak
Winter Off peak 5.30 0.14 2.58 5.46
(day)
Winter Off peak 4.28 0.16 3.56 9.26
(night)
regions in New Zealand, these findings indicate the sector as a viable option to capital intensive peaker plant
relative contribution of lighting to peak electricity or energy storage investment.
demand. As an example, efficient lighting can provide a num-
Further, by using the same method to temporally ber of benefits at several scales of the electricity net-
distribute projected energy-efficient lighting uptake, work. Firstly, the significant lowering of the annual peak
we have estimated that more efficient residential light- (winter) demand offers an inexpensive way to help
ing could reduce New Zealand’s total annual demand by national aspirations for higher levels of renewable gen-
1 TWh and reduce the highest winter evening peaks (at eration. It reduces the need for either fossil-fuelled
17:00) by up to ~ 500 MW (9%) by 2029. To put this in peaking plants or significant over-building of renewable
perspective, the winter evening demand reduction by generation and/or storage which would only be used
2029 would be roughly equivalent to avoiding the need during periods of highest demand. This is particularly
for additional generation capacity of the scale of New relevant to nations that are seeking to reach 100% re-
Zealand’s Huntly Power Stations 1–4 (coal/gas) plus the newable electricity supply, as demand peaks are typi-
Stratford peaker plant (gas open-cycle) (700 MW). cally met by fossil fuelled peaking plants generation
Even though the paper reports an extremely simple (Pereira et al. 2016). Interestingly, this may have a
technology substitution model with no assumptions of limited impact on reducing GHG emissions in New
behavioural change or rebound effects, it provides an Zealand as hydro lakes can be used to meet winter peaks
indication of the potential value of promoting particular in demand (Khan et al. 2018). However, with govern-
energy efficiency measures in the residential household ment aspirations of electrifying transport and industrial
Fig. 4 Estimated mean half-
hourly residential lighting de-
mand (power in MW) by season
in 2015 for New Zealand (Source:
own calculations)Energy Efficiency
Fig. 5 Density plot to show
distribution of residential lighting
demand (mean power per half-
hour) by season for 2015 (Source:
own calculations)
heating to help meet its target of net-zero greenhouse such investment would be greater than the decrease in
gas emissions by 2050, and little ability to expand hydro revenue due to lower demand from more efficient tech-
generation, this advantage could be lost and winter nologies. In New Zealand, distribution network conges-
peaks instead met by peaker plants. Our results indicate tion periods are largely in the winter morning and eve-
that increasing lighting efficiency can help avoid the ning peaks so our estimate that energy-efficient lighting
need for additional fossil fuelled generation to meet could offer savings to the generation system by reducing
winter peaks, especially as electricity demand grows. total demand by up to 500 MW implies less need for
Secondly, it offers potential value to electricity dis- costly investment in underutilised distribution capacity.
tribution networks since permanently reducing winter These benefits arise from the less generally considered
evening peak demand may enable offsetting of costly reduction in peak demand rather than the more often
reinforcement of constrained lines, particularly where discussed overall reduction in electricity consumption
Table 3 Annual lighting consumption energy forecast under efficiency uptake
Year Number of households Lighting kWh per year (per household) Lighting GWh per year (total NZ)
2015 1,796,331 878 1577
2017 1,833,349 818 1501
2019 1,868,507 731 1366
2021 1,903,664 628 1196
2023 1,935,926 530 1026
2025 1,968,188 442 871
2027 1,998,382 367 734
2029 2,026,508 307 622Energy Efficiency Fig. 6 Mean half-hourly lighting electricity demand profiles by year and season (Source: own calculations) (Attari et al. 2010). However, these scenarios also offer greenhouse gas emissions. In New Zealand, there are savings to household electricity bills: a reduction of more some existing policy measures such as minimum energy than 500 kWh by 2029 represents a saving of ~ $100 per performance standards and energy labelling for electrical annum per household at 2019 prices and in a smart- appliances (Energy Efficiency and Conservation metered future with the potential for peak demand pricing Authority 2017b) and these could be further strengthened this could be considerably higher. to support reductions in overall electricity demand. In The findings suggest that active intervention to sup- addition, replacing inefficient lighting technologies with port households to take up efficient lighting could be more efficient versions could be seen as a relatively justified by the benefits of reductions in peak demand in ‘easy’ least-regret energy efficiency transition since little addition to reductions in overall energy consumption. disruption to infrastructure or to household habits is likely This is especially relevant for countries like New Zealand to occur. This study only estimates the technical potential that currently do not have subsidies for energy-efficient for residential lighting to reduce peak demand and does lighting uptake. Whilst the forecast model used in this consider neither the necessary policy, media or commer- paper estimates that energy-efficient lighting would be cial interventions nor any consumer behavioural change taken up over 14 years through market forces alone, this that may be needed to realise this potential. Further work process could be accelerated through policy measures by should therefore analyse the likely costs as well as ben- government or pricing (or even installation (Rushby et al. efits of accelerating the uptake model under a variety of 2018)) interventions by electricity sector businesses if it scenarios. was recognised as a cost-effective way to avoid genera- Inevitably, the results are limited by the assumptions tion and distribution infrastructure and reduce future made in the prediction of lighting unit uptake and Fig. 7 Trends in peak period maximum lighting demand by year and season (Source: own calculations)
Energy Efficiency

Fig. 8 Projected trends in mean
daily lighting electricity
consumption for by year and
season

estimates of population growth and, further, are restrict-        Finally, the use of mean electricity demand profiles
ed to the residential sector alone. The forecast of effi-     masks potential co-incident peaks in demand. In partic-
cient lighting uptake that we used had a variety of           ular, during winter peaks, the scaled modal demand is
different technologies with a range of efficiencies, but      approximately 100 MW (Fig. 5), but the estimated
a more widespread use of LEDs, for example, would             maximum is over 700 MW. Although this ignores the
result in even lower demand. Additional demand reduc-         role of diversity in smoothing aggregated demand, this
tions are likely if the commercial and industrial sectors     suggests that a mean-based model may significantly
also implemented energy-efficient lighting and if light-      underestimate the size of demand peaks (Strbac 2008)
ing technologies how incremental efficiency improve-          and may also, therefore, substantially underestimate the
ments over time in contrast to our assumption that this is    reduction that could be obtained due to energy-efficient
not the case. Further work could seek to quantify these       lighting. Future work should therefore explore alterna-
effects as they are likely to result in even larger overall   tive metrics that can provide improved estimates of the
national reductions than estimated in our model.              capacity needed to meet co-incident peaks and to ac-
    In addition, the accurate allocation of consumption to    count more appropriately for the true heterogeneity in
half-hours depends on the extent to which the sample of       the network.
21 households’ lighting usage reflects NZ households as           In conclusion, as the world moves towards
a whole. Further research should urgently re-implement        decarbonisation of electricity systems, it will be increas-
the models using a suitable nationally representative         ingly important to limit or control demand peaks. A critical
household electricity demand dataset to understand var-       first step will be to quantify the potential peak load reduc-
iations in results by household type and region.              tion available from the adoption of efficient appliances

Fig. 9 Impact of increasing
lighting efficiency scenario on
required electricity generation for
summer and winter (Source: own
calculations)
Energy Efficiency
whose usage has a strong coincidence with annual peaks in Beaudin, M., Zareipour, H., Schellenberglabe, A., & Rosehart, W.
(2010). Energy storage for mitigating the variability of re-
demand. The quantification approach used in this research
newable electricity sources: an updated review. Energy for
is readily applicable to other nations and other appliances. Sustainable Development, 14(4), 302–314. https://doi.
org/10.1016/j.esd.2010.09.007.
Funding information The work reported in this paper was Bronski, P., Dyson, M., Lehrman, M., Mandel, J., Morris, J.,
supported by a University of Otago Writing Bursary, the New Palazzi, T., Ramirez, S., & Touati, H. (2015). The economics
Zealand Ministry of Business, Innovation and Employment (Con- of demand flexibility: how “flexiwatts” create quantifiable
tract No. UOCX1203) and a Marie Sklodowska-Curie Individual value for customers and the grid. Rocky Mountain Institute.
Global Fellowship within the H2020 European Framework Pro- Bull, S. R. (2001). Renewable energy today and tomorrow.
gramme (2014–2020) under grant agreement no. 700386. Proceedings of the IEEE, 89(8), 1216–1226. https://doi.
org/10.1109/5.940290.
Compliance with ethical standards Buonocore, J. J., Luckow, P., Norris, G., Spengler, J. D., Biewald,
B., Fisher, J., & Levy, J. I. (2016). Health and climate
benefits of different energy-efficiency and renewable energy
Conflict of interest The authors declare that they have no con-
choices. Nature Climate Change, 6(1), 100–105. https://doi.
flict of interest.
org/10.1038/nclimate2771.
Denholm, P., & Hand, M. (2011). Grid flexibility and storage
required to achieve very high penetration of variable renew-
Open Access This article is licensed under a Creative Commons able electricity. Energy Policy, 39(3), 1817–1830. https://doi.
Attribution 4.0 International License, which permits use, sharing, org/10.1016/j.enpol.2011.01.019.
adaptation, distribution and reproduction in any medium or format, Department for Business, Energy & Industrial Strategy. (2019).
as long as you give appropriate credit to the original author(s) and UK energy statistics, 2018 & Q4 2018. Department for
the source, provide a link to the Creative Commons licence, and Business, Energy & Industrial Strategy. https://assets.
indicate if changes were made. The images or other third party p u b l i s h i n g . s e r v i c e . g o v .
material in this article are included in the article's Creative Com- uk/government/uploads/system/uploads/attachment_
mons licence, unless indicated otherwise in a credit line to the data/file/791297/Press_Notice_March_2019.pdf.
material. If material is not included in the article's Creative Com- Dyke, K. J., Schofield, N., & Barnes, M. (2010). The impact of
mons licence and your intended use is not permitted by statutory transport electrification on electrical networks. IEEE
regulation or exceeds the permitted use, you will need to obtain Transactions on Industrial Electronics, 57(12), 3917–3926.
permission directly from the copyright holder. To view a copy of https://doi.org/10.1109/TIE.2010.2040563.
this licence, visit http://creativecommons.org/licenses/by/4.0/. Dyson, M. E. H., Borgeson, S. D., Tabone, M. D., & Callaway, D.
S. (2014). Using smart meter data to estimate demand re-
sponse potential, with application to solar energy integration.
Energy Policy, 73, 607–619. https://doi.org/10.1016/j.
enpol.2014.05.053.
References Electricity Authority. (2018). Grid generation trends [Dashboard].
https://www.emi.ea.govt.nz/Wholesale/Reports/W_GG_C?_
si=v%7C3.
Alham, M. H., Elshahed, M., Ibrahim, D. K., & El Zahab, E. E. D. Electricity Commission. (2005). Auckland’s electrical demand
A. (2017). Optimal operation of power system incorporating characteristics and applicability of demand management.
wind energy with demand side management. Ain Shams https://www.google.de/url?sa=t&rct=j&q=&esrc=
Engineering Journal, 8(1), 1–7. https://doi.org/10.1016/j. s& s ou r c e = w e b & c d = 1& v e d = 2a hUK E w j w 4a O 1 u9
asej.2015.07.004. rgAhUKX30KHdsoC6QQFjAAegQICxAC&url=https%3
Anderson, B., Eyers, D., Ford, R., Giraldo Ocampo, D., A%2F%2Fwww.ea.govt.nz%2Fdmsdocument%2F4751
Peniamina, R., Stephenson, J., Suomalainen, K., Wilcocks, &usg=AOvVaw2_cKXYa1hPMX4LUiyHsV1Z.
L., & Jack, M. (2018). New Zealand GREEN Grid household Energy Efficiency and Conservation Authority. (2017a). Energy
electricity demand study 2014–2018. https://doi.org/10.5255 end use database. https://www.eeca.govt.nz/resources-and-
/UKDA-SN-853334. tools/tools/energy-end-use-database/.
Arteconi, A., Hewitt, N. J., & Polonara, F. (2012). State of the art Energy Efficiency and Conservation Authority. (2017b). E3
of thermal storage for demand-side management. Applied PRIORITISATION PLAN 2017–18. http://energyrating.gov.
Energy, 93, 371–389. au/document/e3-prioritisation-plan-2017–18.
Arteconi, A., Hewitt, N. J., & Polonara, F. (2013). Domestic Energy Efficiency and Conservation Authority. (2019). Energy
demand-side management (DSM): role of heat pumps and efficiency first: the electricity story technical report.
thermal energy storage (TES) systems. Applied Thermal https://www.eeca.govt.nz/assets/Resources-EECA/research-
Engineering, 51(1–2), 155–165. publications-resources/EECA-Energy-Efficiency-First-
Attari, S. Z., DeKay, M. L., Davidson, C. I., & Bruine de Bruin, Technical-Report.pdf.
W. (2010). Public perceptions of energy consumption and EnergyConsult. (2015). Residential energy baseline study: techni-
savings. Proceedings of the National Academy of Sciences, cal appendix. https://www.energyrating.gov.
107 (37 ), 160 54 –16 059 . htt ps:// doi .org/1 0.10 73 au/sites/default/files/documents/RBS2014_Technical_
/pnas.1001509107. Appendix._0.pdf.Energy Efficiency
EnergyConsult PTY LTD. (2015). Residential energy baseline Sustainable Development, 49, 65–77. https://doi.org/10.1016
study: New Zealand. http://energyrating.gov.au/sites/new. /j.esd.2019.01.001.
energyrating/files/documents/Report_Residential_Baseline_ Ministry of Business, Innovation & Employment. (2017).
Study_for_New_Zealand_2000_-_2030_0_0.pdf. Unlocking our energy productivity and renewable potential:
Fouquet, R., & Pearson, P. J. G. (2012). The long run demand for New Zealand energy efficiency and conservation strategy
lighting: elasticities and rebound effects in different phases of 2017–2022. http://www.mbie.govt.nz/info-services/sectors-
economic development. Economics of Energy & industries/energy/documents-image-library/NZEECS-2017-
Environmental Policy, 1(1). https://doi.org/10.5547/2160- 2022.pdf.
5890.1.1.8. Ministry of Business, Innovation & Employment. (2018). Energy
Frederiks, E. R., Stenner, K., Hobman, E. V., & Fischle, M. in New Zealand. https://www.mbie.govt.
(2016). Evaluating energy behavior change programs using nz/dmsdocument/2017-energy-in-nz-18-pdf.
randomized controlled trials: best practice guidelines for Ministry of Business, Innovation & Employment. (2019).
policymakers. Energy Research & Social Science, 22, 147– Electricity demand and generation scenarios: scenario and
164. https://doi.org/10.1016/j.erss.2016.08.020. results summary. https://www.mbie.govt.
Gellings, C. W. (2009). The smart grid: enabling energy efficiency nz/dmsdocument/5977-electricity-demand-and-generation-
and demand response. Fairmont Press [u.a.]. scenarios.
Grunewald, P., & Diakonova, M. (2018). Flexibility, dynamism Mirza, U. K., Ahmad, N., Harijan, K., & Majeed, T. (2009).
and diversity in energy supply and demand: a critical review. Identifying and addressing barriers to renewable energy de-
Energy Research & Social Science, 38, 58–66. https://doi. velopment in Pakistan. Renewable and Sustainable Energy
org/10.1016/j.erss.2018.01.014. Reviews, 13(4), 927–931. https://doi.org/10.1016/j.
Huebner, G. M., Nicolson, M. L., Fell, M. J., Kennard, H., Elam, rser.2007.11.006.
S., Hanmer, C., Johnson, C., & Shipworth, D. (2017). Are we Mori, M., Fujishima, M., Inamasu, Y., & Oda, Y. (2011). A study
heading towards a replicability crisis in energy efficiency on energy efficiency improvement for machine tools. CIRP
research? A toolkit for improving the quality, transparency Annals, 60(1), 145–148. https://doi.org/10.1016/j.
and replicability of energy efficiency impact evaluations. cirp.2011.03.099.
Proceedings of the European Council for an Energy Muenzel, V., Mareels, I., de Hoog, J., Vishwanath, A.,
Efficient Economy ECEEE. Kalyanaraman, S., & Gort, A. (2015). PV generation and
IEA. (2018). Energy efficiency 2018: analysis and outlooks to demand mismatch: evaluating the potential of residential
2040. International Energy Agency. https://www.iea. storage. IEEE Power & Energy Society Innovative Smart
org/efficiency2018/ Grid Technologies Conference (ISGT), 2015, 1–5.
Interim Climate Change Committee. (2019). Accelerated electri- https://doi.org/10.1109/ISGT.2015.7131849.
fication: evidence, analysis and recommendations. Müller, T., & Möst, D. (2018). Demand response potential: avail-
https://www.iccc.mfe.govt.nz/assets/PDF_ able when needed? Energy Policy, 115, 181–198.
Library/daed426432/FINAL-ICCC-Electricity-report.pdf. National Institute of Water and Athmospheric Research. (2010).
International Energy Agency. (2012). Spreading the net: the mul- Mean monthly sunshine (hours). https://www.niwa.co.
tiple enefits of energy efficiency improvements (IEA Energy n z / e d u c a t i o n - a n d -
Papers 2012/08). https://doi.org/10.1787/5k9crzjbpkkc-en. training/schools/resources/climate/sunshine.
International Energy Agency. (2019). Perspectives for the clean New Zealand Productivity Commission. (2018). Low-emissions
energy transition—the critical role of buildings. economy: final report. https://www.productivity.govt.
https://webstore.iea.org/download/direct/2496?fileName= nz/low-emissions.
Perspectives_for_the_Clean_Energy_Transition_2019.pdf. Painuly, J. P. (2001). Barriers to renewable energy penetration; a
Khan, I., Jack, M. W., & Stephenson, J. (2018). Analysis of framework for analysis. Renewable Energy, 24(1), 73–89.
greenhouse gas emissions in electricity systems using time- https://doi.org/10.1016/S0960-1481(00)00186-5.
varying carbon intensity. Journal of Cleaner Production, Pereira, S., Ferreira, P., & Vaz, A. I. F. (2016). Optimization
184, 1091–1101. https://doi.org/10.1016/j. modeling to support renewables integration in power sys-
jclepro.2018.02.309. tems. Renewable and Sustainable Energy Reviews, 55, 316–
Long, J., John, M., & Greenblatt, J. (2011). California’s energy 325. https://doi.org/10.1016/j.rser.2015.10.116.
future—the view to 2050. California Council on Science and Pudjianto, D., Djapic, P., Aunedi, M., Gan, C. K., Strbac, G.,
Technology. https://cloudfront.escholarship. Huang, S., & Infield, D. (2013). Smart control for minimizing
org/dist/prd/content/qt2tb1c1mv/qt2tb1c1mv.pdf. distribution network reinforcement cost due to electrification.
Losi, A., Mancarella, P., & Vicino, A. (Eds.). (2015). Integration Energy Policy, 52, 76–84. https://doi.org/10.1016/j.
of demand response into the electricity chain: challenges, enpol.2012.05.021.
opportunities, and smart grid solutions. John Wiley & Sons, Reddy, S., & Painuly, J. P. (2004). Diffusion of renewable energy
Inc.. https://doi.org/10.1002/9781119245636. technologies—barriers and stakeholders’ perspectives.
Lund, P. D., Lindgren, J., Mikkola, J., & Salpakari, J. (2015). Renewable Energy, 29(9), 1431–1447. https://doi.
Review of energy system flexibility measures to enable high org/10.1016/j.renene.2003.12.003.
levels of variable renewable electricity. Renewable and Rushby, T., Anderson, B., Bahaj, A., & James, P. (2018). Seeing
Sustainable Energy Reviews, 45, 785–807. the light: the effects of LED light bulb installation on elec-
McNeil, M. A., Karali, N., & Letschert, V. (2019). Forecasting tricity demand in UK households: results of a large n
Indonesia’s electricity load through 2030 and peak demand randomised control trial. 12th OERC Energy & Climate
reductions from appliance and lighting efficiency. Energy for Change Symposium 2018. 12th OERC Energy & ClimateEnergy Efficiency
Change Symposium 2018, Dunedin, New Zealand. 24–25 Tonn, B., & Peretz, J. H. (2007). State-level benefits of energy
Nov 2018. https://speakerdeck.com/dataknut/seeing-the- efficiency. Energy Policy, 35(7), 3665–3674. https://doi.
light-the-effects-of-led-light-bulb-installation-on-electricity- org/10.1016/j.enpol.2007.01.009.
demand-in-uk-households-results-of-a-large-n-randomised- Transpower New Zealand Limited. (2018). Te Mauri Hiko—energy
control-trial. futures [white paper]. Transpower. https://www.transpower.co.
Saidur, R. (2009). Energy consumption, energy savings, and nz/sites/default/files/publications/resources/TP%20Energy%20
emission analysis in Malaysian office buildings. Energy Futures%20-%20Te%20Mauri%20Hiko%2011%20
Policy, 37(10), 4104–4113. https://doi.org/10.1016/j. June%2718.pdf.
enpol.2009.04.052. U.S. Energy Information Administration. (2019). Monthly energy
Schubert, E. F. (2014). Light-emitting diodes. In J. G. Webster, review [review]. U.S. Energy Information Administration.
Wiley encyclopedia of electrical and electronics engineering https://www.eia.gov/totalenergy/data/monthly/pdf/mer.pdf.
(pp. 1–10). John Wiley & Sons, Inc. https://doi.org/10.1002 Walker, G. (2014). The dynamics of energy demand: change, rhythm
/047134608X.W3144.pub2. and synchronicity. Energy Research & Social Science, 1, 49–55.
Srivastava, A., Van Passel, S., & Laes, E. (2018). Assessing the https://doi.org/10.1016/j.erss.2014.03.012.
success of electricity demand response programs: a meta- Worrell, E., Laitner, J. A., Ruth, M., & Finman, H. (2003).
analysis. Energy Research & Social Science, 40, 110–117. Productivity benefits of industrial energy efficiency mea-
https://doi.org/10.1016/j.erss.2017.12.005. sures. Energy, 28(11), 1081–1098. https://doi.org/10.1016
Stephenson, J., Ford, R., Nair, N.-K., Watson, N., Wood, A., & /S0360-5442(03)00091-4.
Miller, A. (2018). Smart grid research in New Zealand–A
Yuan, X., & Zuo, J. (2011). Transition to low carbon energy
review from the GREEN Grid research programme.
policies in China—from the Five-Year Plan perspective.
Renewable and Sustainable Energy Reviews, 82, 1636–
Energy Policy, 39(6), 3855–3859. https://doi.org/10.1016/j.
1645. https://doi.org/10.1016/j.rser.2017.07.010.
enpol.2011.04.017.
Strbac, G. (2008). Demand side management: benefits and chal-
lenges. Energy Policy, 36(12), 4419–4426.
Su, W., Wang, J., & Roh, J. (2014). Stochastic energy scheduling Publisher’s note Springer Nature remains neutral with regard to
in microgrids with intermittent renewable energy resources. jurisdictional claims in published maps and institutional
IEEE Transactions on Smart Grid, 5(4), 1876–1883. affiliations.
https://doi.org/10.1109/TSG.2013.2280645.You can also read