Tropical cyclone storm surge probabilities for the east coast of the United States: a cyclone-based perspective
←
→
Page content transcription
If your browser does not render page correctly, please read the page content below
Nat. Hazards Earth Syst. Sci., 22, 1287–1300, 2022
https://doi.org/10.5194/nhess-22-1287-2022
© Author(s) 2022. This work is distributed under
the Creative Commons Attribution 4.0 License.

Tropical cyclone storm surge probabilities for the east coast of the
United States: a cyclone-based perspective
Katherine L. Towey1 , James F. Booth1,2 , Alejandra Rodriguez Enriquez3 , and Thomas Wahl3
1 Earth  and Environmental Science, The Graduate Center, City University of New York, New York, NY, 10016, USA
2 Earth  and Atmospheric Science, The City College of New York, City University of New York, New York, NY, 10031, USA
3 Civil, Environmental, and Construction Engineering and National Center for Integrated Coastal Research,

University of Central Florida, Orlando, FL, 32816, USA

Correspondence: Katherine L. Towey (ktowey@gradcenter.cuny.edu)

Received: 22 August 2021 – Discussion started: 7 September 2021
Revised: 22 February 2022 – Accepted: 13 March 2022 – Published: 12 April 2022

Abstract. To improve our understanding of the influence of       tensity, which are, probabilistically, the two most influential
tropical cyclones (TCs) on coastal flooding, the relationships   TC characteristics on storm surge.
between storm surge and TC characteristics are analyzed for
12 sites along the east coast of the United States. This anal-
ysis offers a unique perspective by first examining the re-
lationship between the characteristics of TCs and their re-      1   Introduction
sulting storm surge and then determining the probabilities
of storm surge associated with TCs based on exceeding cer-       Population increases and development without adequate
tain TC characteristic thresholds. Using observational data,     planning for hazards in coastal regions have led to an in-
the statistical dependencies of storm surge on TCs are exam-     crease in exposure and vulnerability to coastal flooding in
ined for these characteristics: TC proximity, intensity, path    low-lying areas (e.g., Strauss et al., 2012; Hallegatte et al.,
angle, and propagation speed, by applying both exponential       2013). Some of the factors that affect storm surges, which
and linear fits to the data. At each tide gauge along the east   drive the largest coastal flooding events, are likely to become
coast of the United States, storm surge is influenced differ-    worse in the future, through rising sea levels (e.g., Tebaldi
ently by these TC characteristics, with some locations more      et al., 2012; Sweet and Park, 2014; Moftakhari et al., 2015)
strongly influenced by TC intensity and others by TC prox-       and increasing storm intensities with anthropogenic climate
imity. The correlation for individual and combined TC char-      change (e.g., Sobel et al., 2016). The changes to these fac-
acteristics increases when conditional sorting is applied to     tors will influence how much destruction storm surge may
isolate strong TCs close to a location. The probabilities of     cause in low-lying communities in the future (e.g., Rahm-
TCs generating surge exceeding specific return levels (RLs)      storf, 2017), and therefore we must fully understand the re-
are then analyzed for TCs passing within 500 km of a tide        lationship between surge and these factors in the current cli-
gauge, where between 6 % and 28 % of TCs were found to           mate. The study herein will thus focus on the relationship be-
cause surge exceeding the 1-year RL. If only the closest and     tween tropical cyclone (TC) characteristics and storm surge
strongest TCs are considered, the percentage of TCs that gen-    for the east coast of the United States (US).
erate surge exceeding the 1-year RL is between 30 % and             Along the US east coast, both TCs and extratropical cy-
70 % at sites north of Sewell’s Point, VA, and over 65 %         clones (ETCs) can create storm surges that generate major
at almost all sites south of Charleston, SC. When examin-        hazards to coastal areas (e.g., Zhang et al., 2000; Colle et
ing storm surge produced by TCs, single-variable regression      al., 2010; Booth et al., 2016). For ETCs, different atmo-
provides a good fit, while multi-variable regression improves    spheric circulation patterns can produce large surge, with the
the fit, particularly when focusing on TC proximity and in-      highest median surge occurring with a slow-moving ETC in
                                                                 conjunction with an anticyclone located to its north (Cata-

Published by Copernicus Publications on behalf of the European Geosciences Union.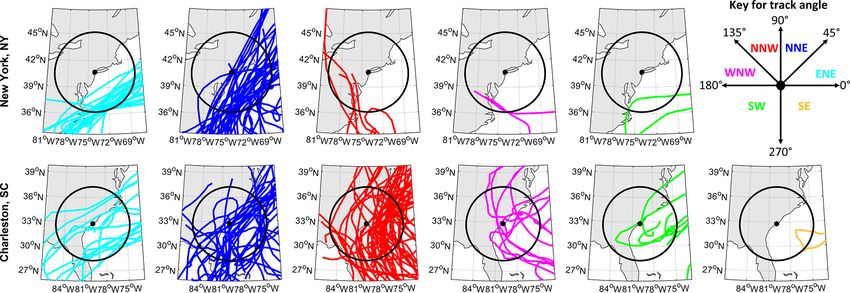
1288                  K. L. Towey et al.: Tropical cyclone storm surge probabilities for the east coast of the United States

lano and Broccoli, 2018). The most common track paths of            and tracks of TCs are likely to impact storm surge (Knutson
ETCs causing storm surge differ for the mid-Atlantic and the        et al., 2020). While many studies have focused on utilizing
northeast US (Booth et al., 2016). Additionally, cities that are    synthetic tracks and models to better understand the relation-
farther north tend to have fewer TC-related storm surge ex-         ship between storm surge and TCs, to our knowledge, no pre-
tremes (Needham et al., 2015). This is because at higher lat-       vious assessment has examined historical surge observations
itudes, TCs encounter environmental conditions that do not          with a focus on surge variability relative to TC characteris-
promote the sustainability of TCs, including lower sea sur-         tics in addition to calculating storm surge exceedance prob-
face temperatures and increased wind shear associated with          abilities based on TC characteristics. Therefore, we have de-
the jet stream, particularly later in the Atlantic hurricane sea-   signed an analysis to utilize past observations to determine
son. However, even as far north as Boston, MA, 4 of the top         the correlation between storm surge and TC characteristics
10 surge events since 1979 were caused by TCs (Booth et al.,        as well as utilize those characteristics to determine the likeli-
2016).                                                              hood of surge exceeding some threshold at various locations
   Although both TCs and ETCs can generate surge, it is             along the eastern US.
important to note that some of the energetics of the atmo-             The magnitude of storm surge at a location is also im-
sphere differ for TCs and ETCs. While both TCs and ETCs             pacted by coastal characteristics, such as its bathymetry
are fundamentally low-pressure systems, TCs derive their en-        (Weaver and Slinn, 2010), wind drag coefficients and bot-
ergy through latent heat release over warm ocean waters,            tom friction (Akbar et al., 2017), coastal complexities (Bloe-
whereas ETCs gain their energy from the presence of air             mendaal et al., 2019), depth of near-shore waters combined
masses with different temperature and moisture characteris-         with the astronomical tide cycle (Rego and Li, 2010; Talke
tics (e.g., Jones et al., 2003; Yanase and Niino, 2015). Due to     et al., 2014), and geomorphic changes in the coastal re-
these differences in storm dynamics, flood exceedance curves        gions (e.g., Familkhalili et al., 2020). While these factors are
for TCs and ETCs can exhibit different characteristics when         important to surge, our focus will be on characteristics re-
considering long timescales (i.e., 100-year events) as more         lated to TCs, including the TC proximity to a tide gauge;
extreme events are likely to be associated with TCs (Orton et       TC intensity, measured through its mean sea level pressure
al., 2016). Thus, even though TCs occur much less frequently        (MSLP); TC path angle; and TC propagation speed, all of
than ETCs along the US east coast (e.g., Booth et al., 2016),       which can be ascertained from historical cyclone track infor-
individual TCs can cause more damage as they often are as-          mation. Since this TC information and storm surge data are
sociated with more moisture and stronger winds than ETCs.           timestamped, we can relate the two datasets together. By uti-
Therefore, it is the focus of this research to understand how       lizing this method of storm attribution, the analysis herein
differences in certain characteristics of TCs relate to storm       examines surge events and TCs in the observed record to
surge.                                                              understand empirically how TC characteristics can influence
   Several studies have utilized numerical models to assess         storm surge.
the relationship between storm surge and TC characteristics.           In this paper, we present a two-part analysis that examines
Synthetic TC tracks along the mid-Atlantic and the northeast        how the magnitude of storm surge events associated with TCs
US have been heavily utilized to identify various relation-         varies based on the characteristics of the TCs themselves at
ships between surge and wind speed (Lin et al., 2010), TC           various locations along the east coast of the US. Section 2 de-
tracks (Garner et al., 2017), and landfall angle (Ramos-Valle       scribes the data and methods used in calculating storm surge
et al., 2020). Additionally, Camelo et al. (2020) simulated         and associating storm surge events with TCs. Section 3 is di-
21 storms in the Gulf of Mexico and along the east coast of         vided into two parts, with part one first analyzing how TC
the US and found no individual TC characteristic correlates         characteristics both individually and in conjunction with one
well with storm surge. The effect of the size of hurricanes on      another correlate with the magnitude of storm surge. We fur-
storm surge was found to be significant in the Gulf of Mex-         ther explore whether examining TC characteristics individu-
ico (e.g., Irish et al., 2008; Needham and Keim, 2014). While       ally or combined with one another improves the predictabil-
comparing both observed and modeled surge heights, Bloe-            ity of storm surge. Part two computes the return levels of
mendaal et al. (2019) affirmed that surge height is influenced      storm surge and examines the likelihood of the return level
by the intensity and size of TCs in addition to coastal com-        of storm surge being exceeded by TCs that meet certain cri-
plexities and slope. Peng et al. (2006) examined the sensitiv-      teria. The paper concludes with a discussion of the results in
ity of surge induced by both offshore and onshore winds to          Sect. 4.
wind speed and direction. Needham and Keim (2014) em-
pirically found that storm surge correlates better with TC
winds pre-landfall as opposed to winds at landfall; Roberts et      2   Data and methodology
al. (2015) found a similar result for all storm types. Modeling
work also suggests that with anthropogenic climate change,          Section 2.1 describes how the storm surge data are calcu-
TCs will become stronger and peak intensity will occur at           lated from the original water level data. Section 2.2 details
higher latitudes, and thus, changes to the intensity, frequency,    the algorithm which associates storm surge events with TCs

Nat. Hazards Earth Syst. Sci., 22, 1287–1300, 2022                                  https://doi.org/10.5194/nhess-22-1287-2022
K. L. Towey et al.: Tropical cyclone storm surge probabilities for the east coast of the United States                        1289

as well as the TC characteristics that are examined in relation     sizes of TCs, but we also examine smaller search radii of 250
to the storm surge.                                                 and 100 km. Generally, a search radius beyond 500 km is too
                                                                    large when considering the spatial size of TCs (e.g., Booth
2.1   Storm surge data                                              et al., 2016) as TCs located beyond 500 km from a location
                                                                    will have limited impacts. Distance from tide gauges to the
The water level data utilized in this analysis are obtained         TC centers are calculated using great circles. We then find
from the National Oceanic and Atmospheric Administration            all time steps along the TC track when the TC was within
(NOAA) Tides and Currents website (NOAA, 2021). Twelve              500 km and examined what the maximum daily storm surge
tide gauges, which record the water levels, that span along         was at each of those time steps. We consider all TCs in the
the east coast of the US were selected for this analysis (Ta-       HURDAT2 database that are categorized as a tropical storm
ble 1). Our analysis begins in 1946 for most sites, unless the      or hurricane when the storm is within 500 km, meaning their
station has data available beginning in a year later than 1946,     maximum sustained wind speed is at least 34 kn. Thus, if
as shown in Table 1, and ends in 2019 for all sites. It is impor-   a cyclone in the database only reaches tropical depression
tant to note that the water level data are not continuous for all   strength during the time that it is within 500 km of a spe-
locations, and thus, some sites may contain gaps in the data.       cific site, it is not included in our analysis. Additionally, we
The year 1946 is selected as the starting year in our analysis      exclude any TCs that undergo extratropical transition (ET)
because in 1945, the NOAA-predicted tide and/or sea level           and are classified as “extratropical” in HURDAT2 while the
data appeared to have a timing issue at some locations where        TC is within 500 km of a tide gauge since these TCs can no
the data were offset, which caused the difference between the       longer be considered purely tropical in nature. The percent-
sea level and the tide to have a tidal pattern.                     age of TCs that undergo ET increases with latitude, with the
   The water level data are initially provided in hourly time       six most northern sites in this analysis observing over 40 % of
intervals. Each water level time series results from a com-         TCs that undergo ET (Table 1). Additional analysis for these
bination of the mean sea level, astronomical tides, and non-        six sites comparing non-ET TCs and ET TCs is presented in
tidal residual, which mainly contains the surge component.          Sect. 3.
While the wave setup is an important component to the wa-              To determine the maximum storm surge associated with a
ter level (e.g., Phan et al., 2013; Marsooli and Lin, 2018), we     TC at a given location, only the time steps for when a TC
neglect this component in our calculation of storm surge due        was within 500 km of a tide gauge are considered as when
to its overall complexities and its variations based on loca-       the storm surge could be realistically attributable to a TC.
tion and storm intensity. Additionally, the wave setup in the       First, the maximum daily storm surge that occurred on the
non-tidal residual is minimal because tide gauges are typi-         day of each time step is assigned to each time step along the
cally located in protected areas, such as harbors and bays. To      TC track. For example, if there are five time steps spaced
obtain surge heights, we first remove the astronomical tide,        apart by 6 h and three of the five time steps are on the same
which is provided on the NOAA Tides and Currents website            day, those three time steps would be assigned the same storm
(NOAA, 2021), from the water level data and then remove             surge value – the maximum surge for that day. Then, the
low-frequency trends by subtracting a 365 d running mean            highest storm surge of all of these time steps within 500 km
of the water level for each site’s water level time series. We      is the storm surge value attributed to a TC as it is the maxi-
refer to the resulting value as surge. Using hourly surge, we       mum surge produced by the TC. We note that the storm surge
find the maximum surge per day and refer to this value as the       we find in this manner is not necessarily the storm surge
maximum daily storm surge.                                          that occurs at the time when the TC was closest to the tide
                                                                    gauge. However, if there are multiple time steps while the
2.2   Methods                                                       TC was within 500 km that have the same surge value, the
                                                                    closest time step along the TC track is utilized in the analy-
Using our dataset of maximum daily storm surge for each             sis. While it is near physically impossible for two TCs to be
site, we associate the surge events with TCs. The National          within 500 km of each other, the algorithm is set up such that
Hurricane Center’s Atlantic hurricane database (HURDAT2;            in the case that there are multiple TCs within 500 km of a tide
Landsea and Franklin, 2013) is used to identify TCs. The            gauge, the closest one is the one more likely to be attributable
HURDAT2 database provides at least 6-hourly observations            to the storm surge and thus is the one that is retained for the
of each TC, and in some rare instances, at a shorter time in-       analysis.
terval of 3 h; therefore, we use only the 6-hourly data for            The first part of our analysis utilizes variables provided in
all TCs. The TC variables we utilize are its location, cen-         the HURDAT2 dataset to examine how the maximum daily
tral MSLP minimum (hPa), and maximum sustained surface              storm surge varies with TC proximity, intensity, path angle,
wind speed, defined as the maximum 1 min average wind               and propagation speed. In our analysis of the relationships
speed at 10 m (knots). All TCs that pass within 500 km of           between storm surge and TC characteristics, we apply both
a tide gauge are retained for this analysis. We initially con-      linear and exponential fits. The residual standard error (RSE)
sider a search radius of 500 km due to the typical spatial          is calculated to assess both the linear and exponential fits of

https://doi.org/10.5194/nhess-22-1287-2022                                 Nat. Hazards Earth Syst. Sci., 22, 1287–1300, 2022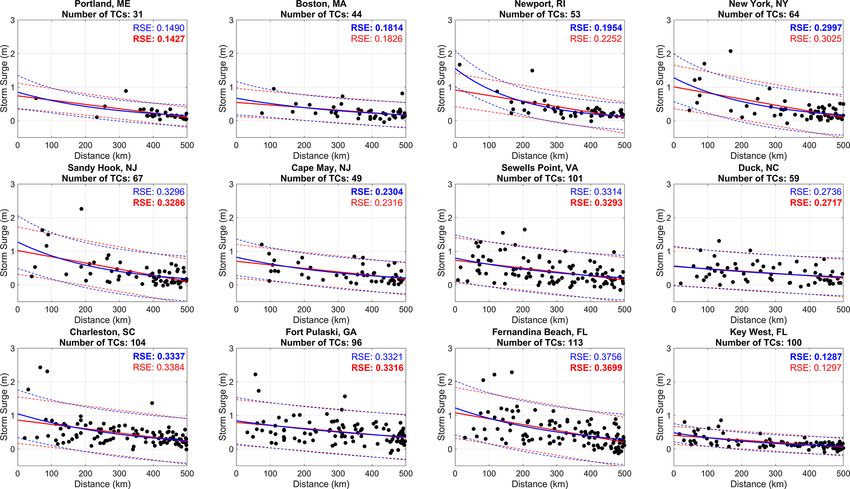
1290                    K. L. Towey et al.: Tropical cyclone storm surge probabilities for the east coast of the United States

Table 1. Locations of tide gauges used in analysis with their location and length of data record, which spans through 2019 for all sites. TCs
are separated based on whether they undergo extratropical transition (ET TCs) or do not (non-ET TCs). The number of TCs within 500 km
before and after the removal of missing MSLP values is included here. The average MSLP of TCs through the time-averaging technique
within 500, 250, and 100 km, which are referenced throughout the paper, is included here.

 Location                  Latitude   Longitude    Starting    Number of       Number of           Average        Average         Average
                                                    year of   non-ET TCs     non-ET TCs              MSLP           MSLP            MSLP
                                                    record      (ET TCs)         (ET TCs)        of non-ET      of non-ET       of non-ET
                                                                   within   within 500 km       TCs within     TCs within      TCs within
                                                                  500 km      with MSLP       500 km (hPa)   250 km (hPa)    100 km (hPa)
                                                                                  available
 Portland, ME             43.66◦ N    70.25◦ W       1945         34 (62)          31 (52)           983.5           987.8           981.1
 Boston, MA               42.36◦ N    71.05◦ W       1945         50 (68)          44 (58)           983.1           983.3           985.0
 Newport, RI              41.51◦ N    71.33◦ W       1946         58 (68)          53 (55)           981.7           984.0           988.7
 New York, NY             40.70◦ N    74.02◦ W       1946         70 (59)          64 (51)           984.8           984.5           984.6
 Sandy Hook, NJ           40.47◦ N    74.01◦ W       1946         73 (59)          67 (50)           984.6           984.2           984.6
 Cape May, NJ             38.97◦ N    74.96◦ W       1966         49 (36)          49 (36)           985.6           985.2           977.6
 Sewell’s Point, VA       36.95◦ N    76.33◦ W       1946        109 (52)         101 (44)           987.0           985.1           990.9
 Duck, NC                 36.18◦ N    75.75◦ W       1979         59 (28)          59 (28)           986.2           985.7           988.1
 Charleston, SC           32.78◦ N    79.92◦ W       1946        122 (37)         104 (31)           986.6           987.1           988.9
 Fort Pulaski, GA         32.04◦ N    80.90◦ W       1950        110 (27)          96 (23)           986.4           989.1           992.0
 Fernandina Beach, FL     30.67◦ N    81.47◦ W       1946        128 (26)         113 (20)           989.5           988.7           991.4
 Key West, FL             24.55◦ N    81.81◦ W       1950         113 (4)          100 (4)           990.7           985.4           982.0

each relationship where a lower RSE indicates a better fit.              those TCs from our analysis. We also analyzed the maximum
This method was utilized in Needham and Keim (2014) in                   surface wind speed as a measure of TC intensity but found
examining the relationship between surge and wind speed.                 that wind speed and MSLP are highly correlated (Fig. S1),
When analyzing linear fits, correlation coefficients are calcu-          and thus, we just consider MSLP as a measure of TC inten-
lated using the Pearson method. To test for statistical signifi-         sity for this analysis.
cance, we use the p-value method, where we select a signifi-                For the calculation of TC path angle, we calculate the
cance level of 5 %. The null hypothesis is that the correlation          change in latitude and longitude between time steps sep-
coefficient of our data sample is not significantly different            arated by five time steps along the track of the TC. This
from zero. If the p value is less than the significance level            method allows us to examine the change in the direction of
of 5 %, we reject the null hypothesis and thus conclude that             the TC over a longer period of time as opposed to between
there is a statistically significant relationship among our data.        consecutive time steps. The atan2d function in MATLAB is
   For TC intensity, our primary analysis uses MSLP. Since               then utilized to find the TC path angle, as this function returns
MSLP data are missing for some instances, we use the aver-               the four-quadrant inverse tangent. The TC path angles range
age of MSLP values that are recorded over the time window                from 0 or 360◦ (eastward) to 90◦ (northward) to 180◦ (west-
from 18 h prior to the surge maximum to 6 h post surge max-              ward) to 270◦ (southward). Examples of TC tracks and their
imum. This choice of timing is motivated by the results of               respective path angles for New York, NY, and Charleston,
Needham and Keim (2014), who found storm surge best cor-                 SC, are shown in Fig. 1. The TC path angles are not grouped
relates with TC winds 18 h prior to landfall. Additionally, we           relative to the site of the tide gauge; rather they are relative to
tested different time windows, shifting it forward or back-              the direction the TC is moving around the time of the surge
ward in time relative to the time of the surge maximum, in-              maximum. For both New York and Charleston, the majority
cluding 24 h prior to 12 h post, 12 h prior to 6 h post, and 6 h         of TCs propagate toward the northeast around the time of the
prior to 6 h post, and found the correlation between surge and           surge maximum, though there are many TCs that also move
MSLP for each time window does not vary significantly. The               toward the northwest in Charleston.
time window from 18 h prior to 6 h post displayed the high-                 Propagation speed is calculated using the distance traveled
est correlation and was thus chosen as the time window to                per 6-hourly time step based on great circles. We then apply
average TC characteristics over. Hereafter, this will be refer-          the time-averaging technique. For the data that we analyzed,
enced with respect to other variables throughout this analy-             however, the relationship between the surge maximum and
sis as the time-averaging technique. If there are no recorded            TC propagation speed is negligible and is not included in this
MSLP values during this time-averaging window, we remove                 analysis. This does not mean that propagation speed does not
the TC from our analysis. Table 1 indicates the number of                have some physical impact on the surge generated by a TC,
TCs within 500 km for each site before and after we remove

Nat. Hazards Earth Syst. Sci., 22, 1287–1300, 2022                                        https://doi.org/10.5194/nhess-22-1287-2022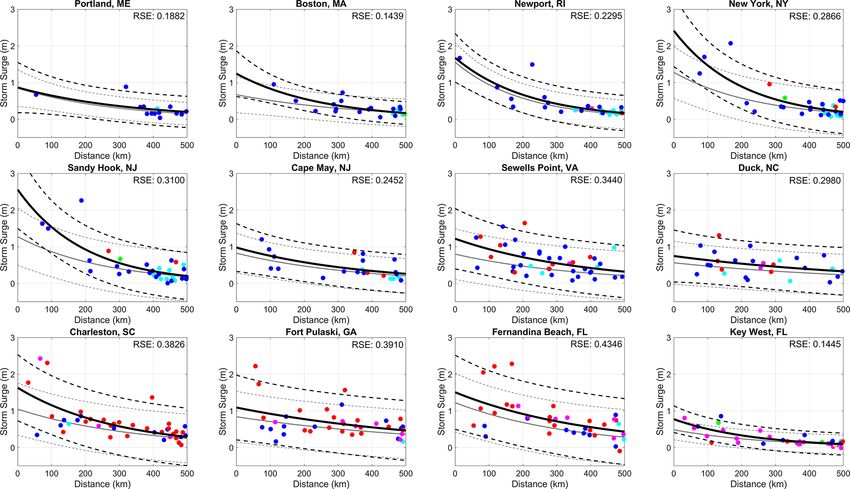
K. L. Towey et al.: Tropical cyclone storm surge probabilities for the east coast of the United States                                  1291

Figure 1. Tracks of TCs within 500 km for New York, NY (top row), and Charleston, SC (bottom row), separated by path angles around the
time of the surge maximum. Colors of tracks indicate the path angle as portrayed in the key and include toward the ENE (light blue, column 1),
NNE (dark blue, column 2), NNW (red, column 3), WNW (magenta, column 4), SW (green, column 5), and SE (orange, column 6). The tide
gauge location is indicated by the black dot, and the search radius of 500 km around the location is indicated by the black circle.

but rather that its sole influence on surge is more complex              a given site (Fig. 2). Many of the largest storm surge events
compared to the other variables that influence surge.                    do tend to be at distances less than 200 km for most loca-
   The second part of this analysis examines the exceedance              tions. However, as seen in Fig. 2, there are also instances
probability of a storm surge event through calculating the               where TCs close to a location generate relatively small storm
storm surge heights for various return periods at each                   surge. Conversely, there are also instances where TCs are
site. Surge return levels are calculated using a peaks-over-             further away from a location but result in high storm surge
threshold method (Coles, 2001) by fitting a generalized                  (e.g., Charleston, SC, in Fig. 2). For most locations, RSE is
Pareto distribution (GPD) to the top 1 % of daily storm surge            very similar when applying both linear and exponential fits,
events at each location. Before performing the fitting to the            with the greatest difference seen at Newport, RI. Since we
GPD, the events over the threshold are de-clustered using a              focus only on TCs that are considered purely tropical, i.e.,
2 d window, so we satisfy the assumption of independence                 they do not undergo ET (non-ET TCs), in this analysis, we
(e.g., Wahl et al., 2017). Return levels at 1-, 2-, 5-, 10-, and         include figures in the Supplement to compare the relationship
25-year intervals are determined from the GPD and are in-                between surge and TC proximity for non-ET TCs against ET-
cluded in Table 3. The likelihood that a TC meets certain                TCs for the six most northern sites, which have at least 40 %
criteria (i.e., TC proximity of within 500 km of a location)             of their TCs undergo ET. When examining storm surge as a
and produces storm surge exceeding the threshold associated              function of distance for ET TCs, the fit worsens compared to
with a 1-year return level is examined through a probabilistic           that for non-ET TCs for these six sites (Fig. S2).
analysis.                                                                   The second characteristic we consider is TC intensity,
                                                                         based on the MSLP of the TC, as discussed in Sect. 2.2. All
                                                                         locations display a similar relationship in which the mag-
3     Results                                                            nitude of storm surge is larger for TCs with lower MSLP,
                                                                         which generally signifies a more intense TC (Fig. 3). Expo-
Section 3.1 examines the correlation between storm surge
                                                                         nential fits are only shown for subsequent figures since for
and TC characteristics individually, combined, and through
                                                                         all figures, linear and exponential fits were found to be very
conditional sorting. Section 3.2 assesses the probabilities as-
                                                                         similar, as was seen in Fig. 2. The lowest RSE is seen at Port-
sociated with TCs producing storm surge exceeding the 1-
                                                                         land, ME; Boston, MA; and Key West, FL. As seen in Fig. 2
year return level given certain TC characteristics.
                                                                         with TC proximity, Fig. 3 indicates a similar conclusion, in
3.1    Storm surge correlation with TC characteristics                   which TC intensity alone does not fully explain the variabil-
                                                                         ity in storm surge. For some locations, such as Sandy Hook,
For our correlation analysis, the first characteristic we ana-           NJ; Sewell’s Point, VA; and Duck, NC, the lower RSE, com-
lyze is the distance between the TC center and the tide gauge,           pared to the TC proximity analysis, would indicate that there
hereafter referred to simply as TC proximity. When consider-             is value added by examining the intensity of TCs in addition
ing TCs that pass within 500 km of a location, the magnitude             to TC proximity. We also examined the time rate of change in
of storm surge generally increases for TCs that are closer to            the MSLP of TCs and found that there was considerable vari-

https://doi.org/10.5194/nhess-22-1287-2022                                       Nat. Hazards Earth Syst. Sci., 22, 1287–1300, 2022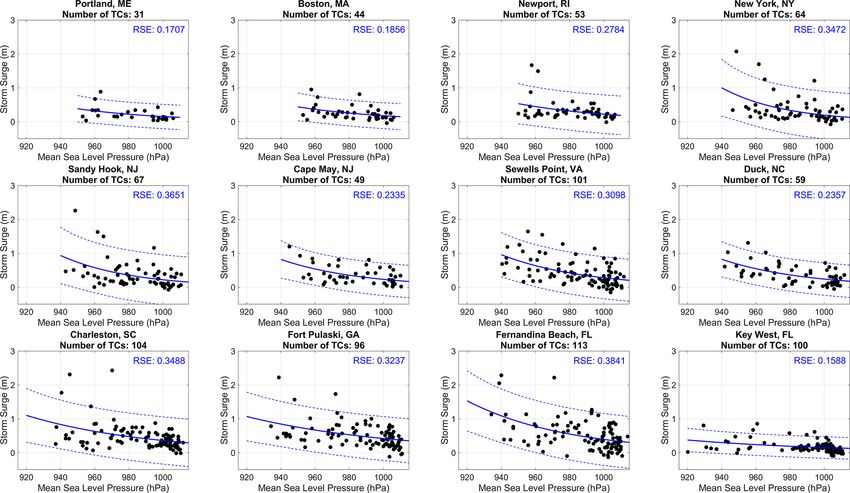
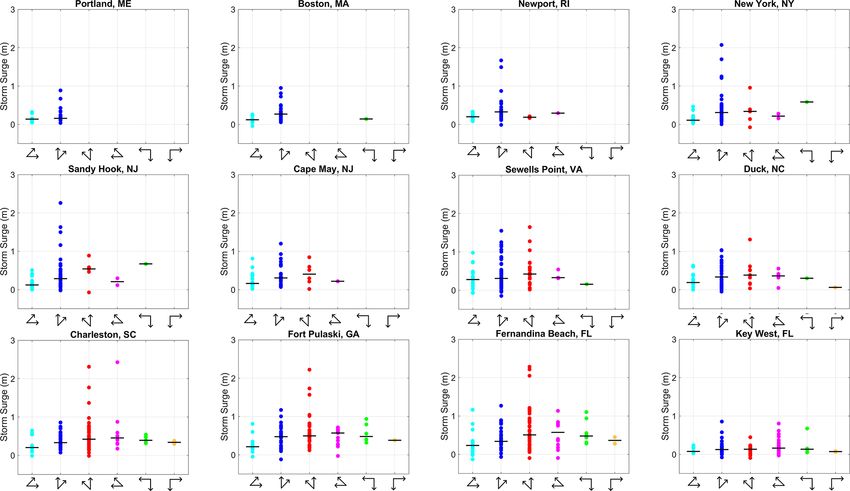
1292                   K. L. Towey et al.: Tropical cyclone storm surge probabilities for the east coast of the United States

Figure 2. Linear (red solid line) and exponential (blue solid line) fit between storm surge (m) and TC proximity (km) with 95 % confidence
intervals (dashed lines) for all TCs within 500 km. Residual standard error (RSE) is provided for each type of fit with the lower value bolded.

ability from case to case and no strong statistical relationship.         unique system in part to due to its southeasterly track toward
When examining storm surge as a function of MSLP for ET                   the New Jersey coastline, which varied considerably from
TCs, the fit worsens slightly for Portland, ME; Boston, MA;               the general track direction toward the northeast that is more
and Newport, RI, but improves slightly for New York, NY;                  commonly observed in this region (Hall and Sobel, 2013).
Sandy Hook, NJ; and Cape May, NJ (Fig. S3). This analysis                 Since our primary focus in this analysis is on TCs that do
of ET TCs highlights the complexities associated with the                 not undergo ET, Sandy is not included in this analysis as it
change in storm dynamics as a TC transitions into an ETC                  underwent ET upon approaching New Jersey. For most lo-
and is why we exclude these TCs from our primary analysis.                cations, however, there is not a significant difference in the
   The path that a TC takes relative to each location is also             median storm surge between different track paths (Fig. 4).
likely to influence the magnitude of the resulting storm surge.           The starkest difference in storm surge based on track path is
This would be due to the direction of the onshore winds                   seen in Fernandina Beach, FL, where TCs moving toward the
around the TC toward a tide gauge that can greatly influence              east-northeast have a median storm surge of 0.23 m, whereas
storm surge. Figure 4 shows how the magnitude of storm                    TCs moving toward the west-northwest have a median storm
surge varies based on the angle of the TC track relative to               surge of 0.57 m.
each location around the time of storm surge event for all TCs               Individually, we have shown how the magnitude of storm
within 500 km. The TCs near the most northern sites along                 surge varies based on TC proximity, intensity, and track
the New England coastline (e.g., Portland, ME, and Boston,                path. We also examined the influence of propagation speed
MA) almost exclusively move toward the northeast. For loca-               (Fig. S4) and found a negligible correlation with storm surge,
tions at lower latitudes, the range of track paths grows, with            suggesting that the magnitude of storm surge does not have a
more TCs moving toward the northwest and southwest, espe-                 clear relationship with propagation speed. Next, we use con-
cially for locations south of Sewell’s Point, VA. For locations           ditional sorting to explore whether a stronger relationship ex-
north of Cape May, NJ, the largest storm surge events tend to             ists among these TC characteristics with storm surge.
occur as TCs move toward the northeast, in which onshore                     To see how the combination of these variables can in-
winds associated with the counterclockwise flow around the                fluence the predictability of storm surge, we examine how
TC would push water toward the coastline. Hurricane Sandy,                the magnitude of storm surge correlates against distance for
one of the most infamous events to occur in this region, was a            only TCs that are stronger than the climatological average

Nat. Hazards Earth Syst. Sci., 22, 1287–1300, 2022                                         https://doi.org/10.5194/nhess-22-1287-2022
K. L. Towey et al.: Tropical cyclone storm surge probabilities for the east coast of the United States                               1293

Figure 3. Exponential fit (blue solid line) between storm surge (m) and MSLP (hPa) with 95 % confidence intervals (dashed line) for all TCs
within 500 km. Residual standard error (RSE) is provided for the exponential fit.

MSLP for all TCs within 500 km of a site which hereafter                those for surge and TC proximity after conditionally sorting
are referred to as strong TCs (Fig. 5). The average MSLP                to isolate for stronger TCs (Fig. 5) indicates that many loca-
is calculated for each location and is provided in Table 1.             tions exhibit an increase in their correlation coefficient. Ta-
The strongest relationship is seen in Boston, MA, and Key               ble 2 displays the correlation coefficients for individual, com-
West, FL. Each data point in Fig. 5 is color coded based on             bined, and conditionally sorted variables in their ability to
the average track path angle for each storm surge event. For            predict storm surge at each location. Each location exhibits a
strong TCs, most locations show no discernible relationship             negative correlation that is statistically significant (p
1294                  K. L. Towey et al.: Tropical cyclone storm surge probabilities for the east coast of the United States

Figure 4. Storm surge (m) separated by track path angle. Arrows along the x axis indicate range of TC track movement, which is similar to
track path angle key in Fig. 1. From left to right, arrows correspond to ENE (light blue), NNE (dark blue), NNW (red), WNW (magenta),
SW (green), and SE (orange). The horizontal black line indicates the median value of storm surge for each group of track path angles.

and is statistically significant (p
K. L. Towey et al.: Tropical cyclone storm surge probabilities for the east coast of the United States                                 1295

Figure 5. Exponential fit (black solid line) between storm surge (m) and TC proximity (km) for only strong TCs within 500 km with 95 %
confidence intervals (dashed black line). Exponential fit (gray solid line) and 95 % confidence intervals (dashed gray line) from Fig. 2 are
also included for comparison to all TCs regardless of intensity. Data points are color coded based on average track path angle as outlined in
Fig. 4. Residual standard error (RSE) is provided for the exponential fit.

Table 2. Correlation coefficients from linear analysis of storm surge with TC proximity, TC intensity, combination of TC proximity and
intensity, and TC proximity for only strong TCs. Correlation coefficients that are not statistically significant have an asterisk.

                           Location                        TC          TC     TC proximity     TC proximity for
                                                     proximity    intensity    and intensity    only strong TCs
                           Portland, ME                 −0.65        −0.43            −0.70               −0.66
                           Boston, MA                   −0.43        −0.41            −0.57               −0.70
                           Newport, RI                  −0.65        −0.35            −0.73               −0.77
                           New York, NY                  -0.62        -0.41            -0.71               -0.77
                           Sandy Hook, NJ               −0.58        −0.41            −0.69               −0.75
                           Cape May, NJ                 −0.52        −0.48            −0.66               −0.60
                           Sewell’s Point, VA           −0.45        −0.56            −0.68               −0.48
                           Duck, NC                     −0.35        −0.58            −0.62              −0.34∗
                           Charleston, SC               −0.46        −0.42            −0.63               −0.61
                           Fort Pulaski, GA             −0.37        −0.43            −0.55               −0.39
                           Fernandina Beach, FL         −0.54        −0.48            −0.68               −0.57
                           Key West, FL                 −0.64        −0.37            −0.70               −0.75

est distance threshold analyzed, 100 km, all locations with              all TCs resulting in storm surge exceeding the 1-year return
the exception of Cape May, NJ, and Duck, NC, have at least               level (Fig. 6b). In addition to these locations, however, the
a third of all TCs resulting in storm surge exceeding the 1-             three most northern locations, Portland, ME; Boston, MA;
year return level. Similar to before, three of the four most             and Newport, RI experienced at least 50 % of all TCs result-
southern sites, including Charleston, SC; Fernandina Beach,              ing in storm surge exceeding the 1-year return level. While
FL; and Key West, FL, have experienced more than 67 % of                 the number of TCs that are considered both close (
1296 K. L. Towey et al.: Tropical cyclone storm surge probabilities for the east coast of the United States
Table 3. Return levels (m) for each location for return periods of 1-, 2-, 5-, 10-, and 25-year intervals.
Location 1 year 2 years 5 years 10 years 25 years
Portland, ME 0.60 m 0.71 m 0.86 m 0.97 m 1.13 m
Boston, MA 0.68 m 0.81 m 0.98 m 1.11 m 1.27 m
Newport, RI 0.60 m 0.72 m 0.89 m 1.04 m 1.27 m
New York, NY 0.81 m 0.98 m 1.22 m 1.41 m 1.69 m
Sandy Hook, NJ 0.83 m 1.00 m 1.26 m 1.47 m 1.79 m
Cape May, NJ 0.73 m 0.85 m 1.00 m 1.10 m 1.22 m
Sewell’s Point, VA 0.73 m 0.88 m 1.07 m 1.22 m 1.43 m
Duck, NC 0.61 m 0.71 m 0.83 m 0.92 m 1.04 m
Charleston, SC 0.53 m 0.63 m 0.80 m 0.97 m 1.25 m
Fort Pulaski, GA 0.63 m 0.75 m 0.92 m 1.06 m 1.27 m
Fernandina Beach, FL 0.76 m 0.88 m 1.06 m 1.21 m 1.45 m
Key West, FL 0.20 m 0.24 m 0.31 m 0.39 m 0.55 m
Table 4. Percentages for each location of TCs within 500, 250, and 100 km under two criteria: (1) within a specified distance that produced
surge exceeding the 1-year return level and (2) within a specified distance and whose MSLP is less than or equal to the average MSLP of
all TCs within a specified distance that produced surge exceeding the 1-year return level. The number of individual TCs that met all criteria
is given by N, and the total number of TCs that met the distance and/or intensity criteria but did not exceed the return level is given by the
bracketed number. The N number divided by the bracketed number will give the percentage in the same box.
Location For TCs within X distance, how many produce For strong TCs within X distance, how many
surge exceeding 1-year return level? produce surge exceeding 1-year return level?
500 km 250 km 100 km 500 km 250 km 100 km
Portland, ME 6.45 % 18.18 % 50.00 % 13.33 % 50.00 % 100.00 %
N = 2 [31] N = 2 [11] N = 1 [2] N = 2 [15] N = 2 [4] N = 1 [1]
Boston, MA 6.82 % 12.50 % 20 % 13.04 % 28.57 % 50.00 %
N = 3 [44] N = 2 [16] N = 1 [5] N = 3 [23] N = 2 [7] N = 1 [2]
Newport, RI 7.55 % 11.54 % 25.00 % 14.29 % 23.08 % 66.67 %
N = 4 [53] N = 3 [26] N = 2 [8] N = 4 [28] N = 3 [13] N = 2 [3]
New York, NY 7.81 % 20.83 % 25.00 % 12.12 % 36.36 % 40.00 %
N = 5 [64] N = 5 [24] N = 3 [12] N = 4 [33] N = 4 [11] N = 2 [5]
Sandy Hook, NJ 7.46 % 20.83 % 25.00 % 11.43 % 36.36 % 33.33 %
N = 5 [67] N = 5 [24] N = 3 [12] N = 4 [35] N = 4 [11] N = 2 [6]
Cape May, NJ 12.24 % 15.79 % 0.00 % 20.00 % 25.00 % 0.00 %
N = 6 [49] N = 3 [19] N = 0 [4] N = 5 [25] N = 3 [12] N = 0 [2]
Sewell’s Point, VA 15.84 % 21.82 % 16.67 % 27.91 % 34.62 % 33.33 %
N = 16 [101] N = 12 [55] N = 3 [18] N = 12 [43] N = 9 [26] N = 3 [1]
Duck, NC 16.95 % 14.29 % 8.33 % 33.33 % 29.41 % 20.00 %
N = 10 [59] N = 5 [35] N = 1 [12] N = 9 [27] N = 5 [17] N = 1 [5]
Charleston, SC 27.88 % 33.90 % 30.00 % 50.00 % 60.71 % 71.43 %
N = 29 [104] N = 20 [59] N = 6 [20] N = 22 [44] N = 17 [28] N = 5 [7]
Fort Pulaski, GA 26.04 % 27.78 % 26.32 % 40.00 % 42.86 % 42.86 %
N = 25 [96] N = 15 [54] N = 5 [19] N = 16 [40] N = 9 [21] N = 3 [7]
Fernandina Beach, FL 24.78 % 40.68 % 36.84 % 45.00 % 68.00 % 66.67 %
N = 28 [113] N = 24 [59] N = 7 [19] N = 18 [40] N = 17 [25] N = 4 [6]
Key West, FL 26.00 % 52.38 % 55.56 % 34.38 % 61.54 % 71.43 %
N = 26 [100] N = 22 [42] N = 10 [18] N = 11 [32] N = 8 [13] N = 5 [7]
Nat. Hazards Earth Syst. Sci., 22, 1287–1300, 2022 https://doi.org/10.5194/nhess-22-1287-2022K. L. Towey et al.: Tropical cyclone storm surge probabilities for the east coast of the United States 1297
cated to the southwest of each location, allowing for onshore
winds to push water towards the coastline. For locations that
are further south, the picture is more complicated as TCs
approach from different directions. For these southern loca-
tions, there seems to be greater dependence on TC intensity
than on TC path angle. While a majority of the TCs that pro-
duce surge exceeding the 1-year return levels at Charleston,
SC; Fort Pulaski, GA; and Fernandina Beach, FL, generally
move in a north-westward direction over Florida, nearly all
of them have an average intensity around the time of surge
maximum of 980 hPa or less.
4 Conclusions
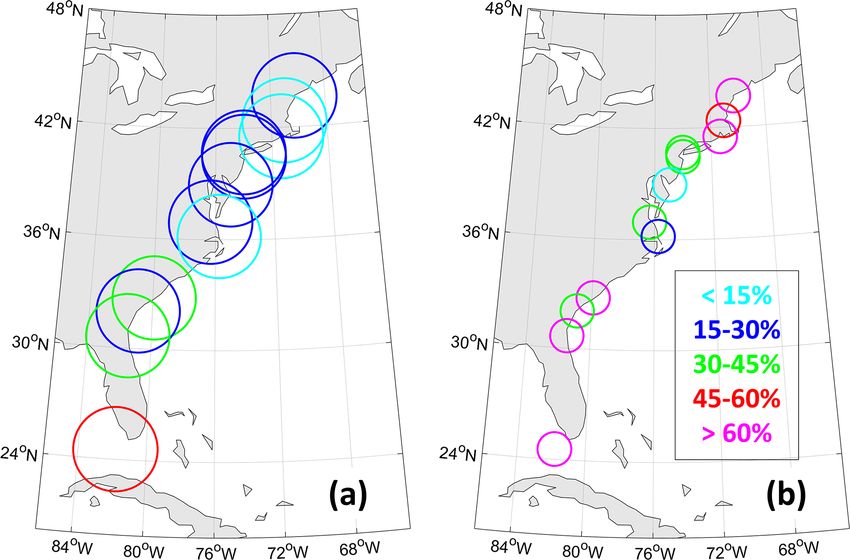
Figure 6. Percentage of TCs that produce surge exceeding the lo-
cation’s 1-year return level and (a) are within 250 km and (b) are This study uses observations to examine the predictability
within 100 km and whose MSLP is less than or equal to the aver- of storm surge based on the following TC characteristics:
age MSLP of all TCs within 100 km. Size of circles indicates the TC proximity, intensity, path angle, and propagation speed.
search radius around each location. Color coding is based on the At each tide gauge along the east coast of the US, storm
percentage value with 60 % (magenta). with some locations more strongly influenced by TC inten-
sity (e.g., Sewell’s Point, VA; Duck, NC; and Fort Pulaski,
GA), but most sites were more strongly influenced by TC
and strong are small at these high latitudes, this analysis proximity. All locations except Duck, NC, see an increase in
shows that these types of TCs at these latitudes may result the correlation of TC proximity with storm surge once only
in high surge if they meet these criteria. strong TCs are considered.
While proximity and intensity of the TCs are important When correlating storm surge with TC characteristics,
factors in predicting storm surge, we cannot ignore the role we found the following for single-variable correlations: TC
of the TC path angle relative to each location around the time propagation speed does not have statistically significant rela-
of the surge maximum. While we have shown that some loca- tionships with surge amplitude; TC proximity and intensity
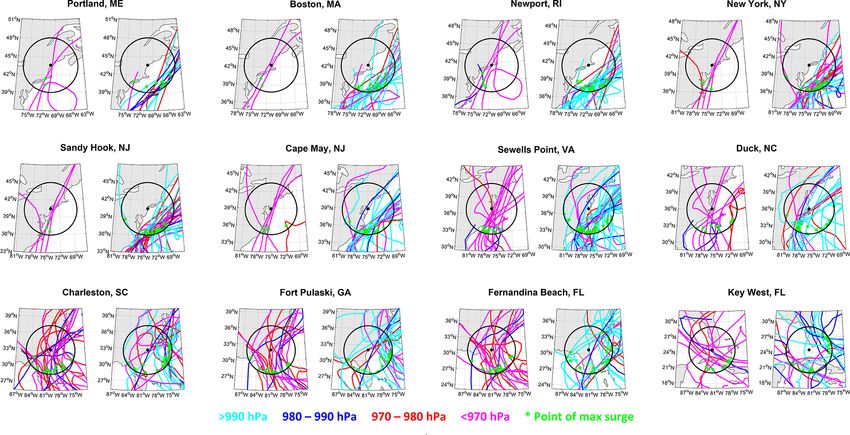
tions experience TCs from a specific range of angles (Fig. 4), both have a statistically significant (p1298 K. L. Towey et al.: Tropical cyclone storm surge probabilities for the east coast of the United States Figure 7. For each location, strong TC tracks for those TCs that do result in surge exceeding 1-year return level (left) and those that do not (right). Tracks are color coded based on average MSLP as follows: >990 hPa (light blue), 980–990 hPa (dark blue), 970–980 hPa (red), and
K. L. Towey et al.: Tropical cyclone storm surge probabilities for the east coast of the United States                                   1299

this information can be applied to the understanding of how             Review statement. This paper was edited by Piero Lionello and re-
storm surge and subsequently the characteristics of TCs may             viewed by Nadia Bloemendaal and one anonymous referee.
change under a warming climate. While no single TC char-
acteristic determines how much surge will be generated, this
analysis does offer a unique perspective on the probabilities
                                                                        References
of surge events associated with all TCs rather than only those
that cause extreme surge.                                               Akbar, M. K., Kanjanda, S., and Musinguzi, A.: Effect of
   This type of analysis, while limited to the east coast of               bottom friction, wind drag coefficient, and meteorologi-
the US, can be applied to any region with a record of ob-                  cal forcing in hindcast of hurricane Rita storm surge us-
servations associated with any type of hazard to be used in                ing SWAN + ADCIRC model, J. Mar. Sci. Eng., 5, 38,
conjunction with any cyclone dataset. This cyclone–hazard                  https://doi.org/10.3390/jmse5030038, 2017.
association algorithm has been applied to associating pre-              Bauer, M., Tselioudis, G., and Rossow, W. B.: A new cli-
cipitation and streamflow events with both TCs and ETCs                    matology for investigating storm influences in and on
in the Catskill Mountains of New York State (Towey et al.,                 the extratropics, J. Appl. Meteorol. Clim., 55, 1287–1303,
2018). In this instance, ETC tracks were identified by ap-                 https://doi.org/10.1175/JAMC-D-15-0245.1, 2016.
                                                                        Bloemendaal, N., Muis, S., Haarsma, R. J., Verlaan, M., Apecechea,
plying a Lagrangian tracking algorithm (Bauer et al., 2016),
                                                                           M. I., de Moel, H., Ward, P. J., and Aerts, J. C. J.
which follows centers of low sea level pressure, to reanal-                H.: Global modeling of tropical cyclone storm surges us-
ysis data. Similar to our analysis presented herein, Lionello              ing high-resolution forecasts, Clim. Dynam., 52, 5031–5044,
et al. (2019) linked sea level anomalies to the intensity and              https://doi.org/10.1007/s00382-018-4430-x, 2019.
position of cyclones in the Mediterranean Sea through the               Booth, J. F., Rieder, H. E., and Kushnir, Y.: Comparing hur-
use of a cyclone tracking algorithm. Given any observational               ricane extratropical storm surge for the Mid-Atlantic and
dataset for a location and a cyclone tracking algorithm, this              Northeast coast of the United States from 1979–2013, En-
type of analysis can be utilized to conduct similar research               viron. Res. Lett., 11, 094004, https://doi.org/10.1088/1748-
for any region.                                                            9326/11/9/094004, 2016.
                                                                        Camelo, J., Mayo, T. L., and Gutmann, E. D.: Projected cli-
                                                                           mate change impacts on hurricane storm surge inundation in
Data availability. Water level data that are used for the calculation      the coastal United States, Front. Built Environ., 6, 588049,
of storm surge are publicly available and can be accessed at https:        https://doi.org/10.3389/fbuil.2020.588049, 2020.
//tidesandcurrents.noaa.gov/ (NOAA, 2021). The dataset of tropical      Catalano, A. J. and Broccoli, A. J.: Synoptic characteristics of
cyclones is also publicly available and can be accessed at https://        surge-producing extratropical cyclones along the northeast coast
www.nhc.noaa.gov/data/ (Landsea and Franklin, 2013).                       of the United States, J. Appl. Meteorol. Clim., 57, 171–184,
                                                                           https://doi.org/10.1175/JAMC-D-17-0123.1, 2018.
                                                                        Coles, S.: An introduction to statistical modelling of extreme values,
                                                                           Springer-Verlag London, 209 pp., https://doi.org/10.1007/978-1-
Supplement. The supplement related to this article is available on-
                                                                           4471-3675-0, 2001.
line at: https://doi.org/10.5194/nhess-22-1287-2022-supplement.
                                                                        Colle, B. A., Rojowsky, K., and Buonaito, F.: New York City
                                                                           storm surges: Climatology and an analysis of the wind and
                                                                           cyclone evolution, J. Appl. Meteorol. Clim., 49, 85–100,
Author contributions. KLT wrote the paper with input from JFB,             https://doi.org/10.1175/2009JAMC2189.1, 2010.
ARE, and TW. JFB downloaded data and calculated surge. KLT              Familkhalili, R., Talke, S. A., and Jay, D. A.: Tide-storm surges
completed data analysis and analyzed results with JFB, ARE, and            interactions in highly altered estuaries: How channel deepen-
TW. JFB provided the code framework for cyclone association                ing increases surge vulnerability, J. Geophys. Res.-Oceans, 125,
code. ARE provided the code framework for calculation of return            e2019JC015286, https://doi.org/10.1029/2019JC015286, 2020.
levels.                                                                 Garner, A. J., Mann, M. E., Emanuel, K. A., Kopp, R. E., Lin, N.,
                                                                           Alley, R. B., Horton, B. P., DeConto, R. M., Donnelly, J. P.,
                                                                           and Pollard, D.: Impact of climate change on New York City’s
Competing interests. The contact author has declared that neither          coastal flood hazard: Increasing flood heights from the preindus-
they nor their co-authors have any competing interests.                    trial to 2300 CE, P. Natl. Acad. Sci. USA, 114, 11861–11866,
                                                                           https://doi.org/10.1073/pnas.1703568114, 2017.
                                                                        Hall, T. M. and Sobel, A. H.: On the impact angle of Hurricane
Disclaimer. Publisher’s note: Copernicus Publications remains              Sandy’s New Jersey landfall, Geophys. Res. Lett., 40, 2312–
neutral with regard to jurisdictional claims in published maps and         2315, https://doi.org/10.1002/grl.50395, 2013.
institutional affiliations.                                             Hallegatte, S., Green, C., Nicholls, R. J., and Corfee-Morlot, J.: Fu-
                                                                           ture flood losses in major coastal cities, Nat. Clim. Change, 3,
                                                                           802–806, 2013.
Financial support. This research has been supported by the Na-          Irish, J. L., Resio, D. T., and Ratcliff, J. J.: The influence of storm
tional Science Foundation (grant nos. 1854773 and 1854896).                size on hurricane surge, J. Phys. Oceanogr., 38, 2003–2013,
                                                                           https://doi.org/10.1175/2008JPO3727.1, 2008.

https://doi.org/10.5194/nhess-22-1287-2022                                     Nat. Hazards Earth Syst. Sci., 22, 1287–1300, 2022
1300 K. L. Towey et al.: Tropical cyclone storm surge probabilities for the east coast of the United States Jones, S. C., Harr, P. A., Abraham, J., Bosart, L. F., Bowyer, P. J., Rahmstorf, S.: Rising hazard of storm-surge flood- Evans, J. L., Hanley, D. E., Hanstrum, B. N., Hart, R. E., Lalau- ing, P. Natl. Acad. Sci. USA, 114, 11806–11808, rette, F., Sinclair, M. R., Smith, R. K., and Thorncroft, C.: The https://doi.org/10.1073/pnas.1715895114, 2017. extratropical transition of tropical cyclones: Forecast challenges, Ramos-Valle, A. N., Curchitser, E. N., and Bruyère, C. L.: Impact current understanding, and future directions, Weather Forecast., of tropical cyclone landfall angle on storm surge along the Mid- 18, 1052–1092, 2003. Atlantic Bight, J. Geophys. Res.-Atmos., 125, e2019JD031796, Knutson, T., Camargo, S. J., Chan, J. C. L., Emanuel, K., Ho, C-H., https://doi.org/10.1029/2019JD031796, 2020. Kossin, J., Mohapatra, M., Satoh, M., Sugi, M., Walsh, K., and Rego, J. L. and Li, C.: Nonlinear terms in storm surge Wu, L.: Tropical cyclones and climate change assessment: Part prediction: Effect of tide and shelf geometry with case II: Projected response to anthropogenic warming, B. Am. Mete- study from Hurricane Rita, J. Geophys. Res., 115, C06020, orol. Soc., 101, E303–E322, https://doi.org/10.1175/BAMS-D- https://doi.org/10.1029/2009JC005285, 2010. 18-0194.1, 2020. Roberts, K. J., Colle, B. A., Georgas, N., and Munch, S. B.: A Landsea, C. W. and Franklin, J. L.: Atlantic hurricane database regression-based approach for cool-season storm surge predic- uncertainty and presentation of a new database format, Mon. tions along the New York-New Jersey coast, J. Appl. Meteo- Weather Rev., 141, 3576–3592, https://doi.org/10.1175/MWR- rol. Clim., 54, 1773–1791, https://doi.org/10.1175/JAMC-D-14- D-12-00254.1, 2013 (data available at: https://www.nhc.noaa. 0314.1, 2015. gov/data/, last access: 31 July 2021). Sobel, A. H., Camargo, S. J., Hall, T. M., Lee, C-Y., Tippett, M. K., Lin, N., Emanuel, K. A., Smith, J. A., and Vanmar- and Wing, A. A.: Human influence on tropical cyclone intensity, cke, E.: Risk assessment of hurricane storm surge for Science, 353, 242–246, https://doi.org/10.1126/science.aaf6574, New York City, J. Geophys. Res.-Atmos., 115, D18121, 2016. https://doi.org/10.1029/2009JD013630, 2010. Strauss, B. H., Ziemlinski R., Weiss, J. L., and Overpeck, J. Lionello, P., Conte, D., and Reale, M.: The effect of cyclones T.: Tidally adjusted estimates of topographic vulnerability to crossing the Mediterranean region on sea level anomalies on sea level rise and flooding for the contiguous United States, the Mediterranean Sea coast, Nat. Hazards Earth Syst. Sci., 19, Environ. Res. Lett., 7, 014033, https://doi.org/10.1088/1748- 1541–1564, https://doi.org/10.5194/nhess-19-1541-2019, 2019. 9326/7/1/014033, 2012. Marsooli, R. and Lin, N.: Numerical modeling of historical storm Sweet, W. V. and Park, J.: From the extreme to the tides and waves and their interactions along the U.S. East mean: Acceleration and tipping points of coastal inun- and Gulf Coasts, J. Geophys. Res.-Oceans, 123, 3844–3874, dation from sea level rise, Earth’s Future, 2, 579–600, https://doi.org/10.1029/2017JC013434, 2018. https://doi.org/10.1002/2014EF000272, 2014. Moftakhari, H. R., AghaKouchak A., Sanders, B. F., Feldman, D. Talke, S. A., Orton, P. M., and Jay, D. A.: Increasing storm tides in L., Sweet, W., Matthew, R. A., and Luke, A.: Increased nuisance New York Harbor, 1844–2013, Geophys. Res. Lett., 41, 3149– flooding along the coasts of the United States due to sea level 3155, https://doi.org/10.1002/2014GL059574, 2014. rise: Past and future, Geophys. Res. Lett., 42, 9846–9852, 2015. Tebaldi, C., Strauss, B. H., and Zervas, C. E.: Modelling sea level Needham, H. F. and Keim, B. D.: Correlating storm surge heights rise impacts on storm surges along US coasts, Environ. Res. Lett., with tropical cyclone winds at and before landfall, Earth Inter- 7, 014032, https://doi.org/10.1088/1748-9326/7/1/014032, 2012. act., 18, 7, https://doi.org/10.1175/2013EI000527.1, 2014. Towey, K. L., Booth, J. F., Frei, A., and Sinclair, M. R.: Track Needham, H. F., Keim, B. D., and Sathiaraj, D.: A re- and circulation analysis of tropical and extratropical cyclones view of tropical cyclone-generated storm surges: Global data that cause strong precipitation and streamflow events in the sources, observations, and impacts, Rev. Geophys., 53, 545–591, New York City watershed, J. Hydrometeorol., 19, 1027–1042, https://doi.org/10.1002/2014RG000477, 2015. https://doi.org/10.1175/JHM-D-17-0199.1, 2018. NOAA: https://tidesandcurrents.noaa.gov/, NOAA [data set], last Wahl, T., Haigh, I. D., Nicholls, R. J., Arns, A., Dangendorf, S., access: 31 May 2021. Hinkel, J., and Slangen, A. B. A.: Understanding extreme sea Orton, P. M., Hall, T. M., Talke, S. A., Blumberg, A. F., Georgas, N., levels for broad-scale coastal impact and adaptation analysis, and Vinogradov, S.: A validated tropical-extratropical flood haz- Nat. Commun., 8, 16075, https://doi.org/10.1038/ncomms16075, ard assessment for New York Harbor, J. Geophys. Res.-Oceans, 2017. 121, 8904–8929, https://doi.org/10.1002/2016JC011679, 2016. Weaver, R. and Slinn, D. N.: Influence of bathymetric fluc- Peng, M., Xie, L., and Pietrafesa, L. J.: Tropical cyclone induced tuations on coastal storm surge, Coast. Eng., 57, 62–70, asymmetry of sea level surge and its presentation in a storm surge https://doi.org/10.1016/j.coastaleng.2009.09.012, 2010. model with parametric wind fields, Ocean Model., 14, 81–101, Yanase, W. and Niino, H., Idealized numerical experiments on cy- https://doi.org/10.1016/j.ocemod.2006.03.004, 2006. clone development in the tropical, subtropical, and extratropical Phan, L. T., Slinn, D. N., and Kline, S. W.: Wave effects on hur- environments, J. Atmos. Sci., 72, 3699–3714, 2015. ricane storm surge simulation, ATC & SEI Conference on Ad- Zhang, K., Douglas, B. C., and Leatherman, S. P.: Twentieth- vances in Hurricane Engineering 2012, Miami, FL, USA, 24– century storm activity along the U.S. east coast, J. Climate, 13, 26 October 2012, https://doi.org/10.1061/9780784412626.065, 1748–1761, 2000. 2013. Nat. Hazards Earth Syst. Sci., 22, 1287–1300, 2022 https://doi.org/10.5194/nhess-22-1287-2022
You can also read