Master Plan Part 3 Sustainable Energy for All of Earth
←
→
Page content transcription
If your browser does not render page correctly, please read the page content below
Master Plan Part 3
Sustainable Energy for All of Earth

Master Plan Part 3 – Sustainable Energy for All of Earth
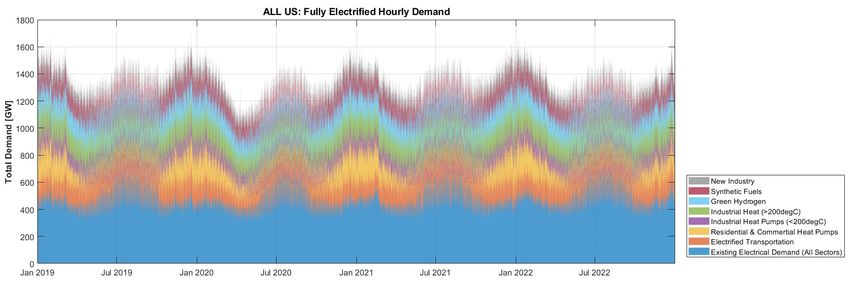
Table of Contents

Executive Summary                                                                                                                  03

The Current Energy Economy is Wasteful                                                                                             04

The Plan to Eliminate Fossil Fuels                                                                                                 05
1.   Repower the Existing Grid with Renewables                                                                                     05
2. Switch to Electric Vehicles                                                                                                     05
3. Switch to Heat Pumps in Residential, Business & Industry                                                                        07
4. Electrify High Temperature Heat Delivery and Hydrogen                                                                           09
5. Sustainably Fuel Planes & Boats                                                                                                 12
6. Manufacture the Sustainable Energy Economy                                                                                      12

Modeling The Fully Sustainable Energy Economy                                                                                      13
•    Energy Storage Technologies Evaluated                                                                                         18
•    Generation Technologies Evaluated                                                                                             19

Model Results                                                                                                                      20
•    US Only Model Results – Meeting New Electrification Demand                                                                    20
•    World Model Results – Meeting New Electrification Demand                                                                      21
•    Batteries for Transportation                                                                                                  22
     •   Vehicles                                                                                                                  22
     •   Ships and Planes                                                                                                          23
•    World Model Results – Electrification & Batteries for Transportation                                                          24

Investment Required                                                                                                                26

Land Area Required                                                                                                                 30

Materials Required                                                                                                                 31

Conclusion                                                                                                                         37

Appendix                                                                                                                           38
•    Appendix: Generation and storage allocation to end-uses                                                                       38
•    Appendix: Build the Sustainable Energy Economy – Energy Intensity                                                             39

Published on April 5, 2023

Acknowledgements                                                                            Tesla Contributors    Tesla Advisors
We appreciate the many prior studies that have pushed the topic of                          Felix Maire           Drew Baglino
a sustainable energy economy forward, the work of the International                         Matthew Fox           Rohan Ma
Energy Agency (IEA), U.S. Energy Information Administration (EIA),                          Mark Simons           Vineet Mehta
U.S. Department of Energy National Laboratories, and the input from                         Turner Caldwell
various non-Tesla affiliated advisors.                                                      Alex Yoo
                                                                                            Eliah Gilfenbaum
                                                                                            Andrew Ulvestad

02                                                     Master Plan Part 3 – Sustainable Energy for All of Earth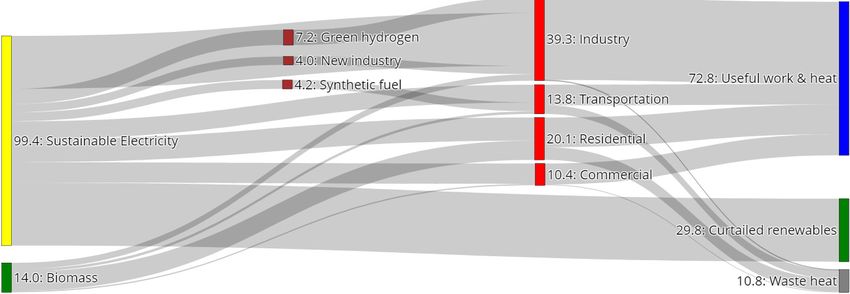
Executive Summary

On March 1, 2023, Tesla presented Master Plan Part 3 – a proposed path to reach a sustainable global energy economy through
end-use electrification and sustainable electricity generation and storage. This paper outlines the assumptions, sources and
calculations behind that proposal. Input and conversation are welcome.

The analysis has three main components:

     Electricity Demand                             Electricity Supply                                               Material Feasibility & Investment
     Forecast the electricity demand                Construct a least-cost portfolio of                              Determine the feasibility of
     of a fully electrified economy                 electricity generation and storage                               material needs for the electric
     that meets global energy needs                 resources that satisfies hourly                                  economy and manufacturing
     without fossil fuels.                          electricity demand.                                              investment necessary to enable it.

Figure 1: Process overview

This paper finds a sustainable energy economy is technically feasible and requires less investment and less material extraction
than continuing today’s unsustainable energy economy. While many prior studies have come to a similar conclusion, this study
seeks to push the thinking forward related to material intensity, manufacturing capacity, and manufacturing investment required
for a transition across all energy sectors worldwide.

       240         TWh                 30      TW                         $10T                                         1/2
       Storage                         Renewable Power                    Manufacturing Investment                     The Energy Required

       0.21%                           10%                                ZERO
       Land Area Required              2022 World GDP                     Insurmountable Resource Challenges

Figure 2: Estimated Resources & Investments Required for Master Plan 3

03                                                        Master Plan Part 3 – Sustainable Energy for All of Earth
The Current Energy Economy is Wasteful

According to the International Energy Agency (IEA) 2019 World Energy Balances, the global primary energy supply is 165 PWh/
year, and total fossil fuel supply is 134PWh/year1ab. 37% (61PWh) is consumed before making it to the end consumer. This includes
the fossil fuel industries’ self-consumption during extraction/refining, and transformation losses during electricity generation.
Another 27% (44PWh) is lost by inefficient end-uses such as internal combustion engine vehicles and natural gas furnaces. In
total, only 36% (59PWh) of the primary energy supply produces useful work or heat for the economy. Analysis from Lawrence
Livermore National Lab shows similar levels of inefficiency for the global and US energy supply2,3.

Today’s Energy Economy (PWh/year)

Figure 3: Global Energy Flow by Sector, IEA & Tesla analysis

a The 2021 and 2022 IEA World Energy Balances were not complete at the time of this work, and the 2020 dataset showed a decrease in energy consumption from 2019,
  which likely was pandemic-related and inconsistent with energy consumption trends.
b Excluded certain fuel supplies used for non-energy purposes, such as fossil fuels used in plastics manufacturing.

04                                                                Master Plan Part 3 – Sustainable Energy for All of Earth
The Plan to Eliminate Fossil Fuels

In an electrified economy with sustainably generated energy, most of the upstream losses associated with mining, refining and
burning fuels to create electricity are eliminated, as are the downstream losses associated with non-electric end-uses. Some
industrial processes will require more energy input (producing green hydrogen for example), and some mining and refining
activity needs to increase (related to metals for batteries, solar panels, wind turbines, etc.)

The following 6 steps show the actions needed to fully electrify the economy and eliminate fossil fuel use. The 6 steps detail the
electricity demand assumptions for the sustainable energy economy and leads to the electricity demand curve that is modeled.

Modeling was done on the US energy economy using high-fidelity data available from the Energy Information Administration
(EIA) from 2019-2022c, and results were scaled to estimate actions needed for the global economy using a 6x scaling factor
based on the 2019 energy consumption scalar between the U.S. and the world, according to IEA Energy Balances. This is a
significant simplification and could be an area for improvement in future analyses, as global energy demands are different from
the U.S. in their composition and expected to increase over time. This analysis was conducted on the U.S. due to availability of
high-fidelity hourly data.

This plan considers onshore/offshore wind, solar, existing nuclear and hydro as sustainable electricity generation sources, and
considers existing biomass as sustainable although it will likely be phased out over time. Additionally, this plan does not address
sequestering carbon dioxide emitted over the past century of fossil fuel combustion, beyond the direct air capture required for
synthetic fuel generation; any future implementation of such technologies would likely increase global energy demand.

01 Repower the Existing Grid with Renewables
The existing US hourly electricity demand is modeled as an inflexible baseline demand taken from the EIA4. Four US sub-regions
(Texas, Pacific, Midwest, Eastern) are modeled to account for regional variations in demand, renewable resource availability,
weather, and grid transmission constraints. This existing electrical demand is the baseline load that must be supported by
sustainable generation and storage.

Globally, 65PWh/year of primary energy is supplied to the electricity sector, including 46PWh/year of fossil fuels; however only
26PWh/year of electricity is produced, due to inefficiencies transforming fossil fuels into electricityd. If the grid were instead
renewably powered, only 26PWh/year of sustainable generation would be required.

02 Switch to Electric Vehicles
Electric vehicles are approximately 4x more efficient than internal combustion engine vehicles due to higher powertrain
efficiency, regenerative braking capability, and optimized platform design. This ratio holds true across passenger vehicles, light-
duty trucks, and Class 8 semis as shown in the Table 1.

              Vehicle Class                           ICE Vehicle Avg5                           Electric Vehicles                        Efficiency Ratio

             Passenger Car                                24.2 MPG                           115 MPGe (292 Wh.mi)e                               4.8X

            Light Truck/Van                                17.5 MPG                          75 MPGe (450 Wh.mi)f                                4.3X

              Class 8 Truck                           5.3 MPG (diesel)                       22 MPGe (1.7 kWh.mi)f                               4.2X

Table 1: Electric vs Internal Combustion Vehicle Efficiency

c    US hourly time series data used as model inputs are available at https://www.eia.gov/opendata/browser/ for download.
d    Embedded in the 26 PWh/year is 3.5 PWh/year of useful heat, mostly produced in co-generation power stations, which generate heat and power electricity.
e    Tesla’s global fleet average energy efficiency including Model 3, Y, S and X
f    Tesla’s internal estimate based on industry knowledge

05                                                                    Master Plan Part 3 – Sustainable Energy for All of Earth
The Plan to Eliminate Fossil Fuels
As a specific example, Tesla’s Model 3 energy consumption is 131MPGe vs. a Toyota Corolla with 34MPG6,7, or 3.9x lower,
and the ratio increases when accounting for upstream losses such as the energy consumption related extracting and refining
fuel (See Figure 4).
1200
drive consumption
upstream losses
1000
Consumption [Wh/mi]
800
600
400
200
0
Toyota Corolla Model 3
Figure 4: Comparison Tesla Model 3 vs. Toyota Corolla
To establish the electricity demand of an electrified transportation sector, historical monthly US transportation petroleum usage,
excluding aviation and ocean shipping, for each sub-region is scaled by the EV efficiency factor above (4x)8. Tesla’s hour by
hour vehicle fleet charging behavior, split between inflexible and flexible portions, is assumed as the EV charging load curve in
the 100% electrified transportation sector. Supercharging, commercial vehicle charging, and vehicles withThe Plan to Eliminate Fossil Fuels
03 Switch to Heat Pumps in Residential, Business & Industry
Heat pumps move heat from source to sink via the compression/expansion of an intermediate refrigerant9. With the appropriate
selection of refrigerants, heat pump technology applies to space heating, water heating and laundry driers in residential and
commercial buildings, in addition to many industrial processes.
Air Water Ground Waste Heat
Heat Source
Evaporation
Expansion Compression
Condensation
Heat Sink
Air Water Steam Heated Material
Figure 5: How Heat Pumps Work10
Air source heat pumps are the most suitable technology for retrofitting gas furnaces in existing homes, and can deliver 2.8 units
of heat per unit of energy consumed based on a heating seasonal performance factor (HSPF) of 9.5 Btu/Wh, a typical efficiency
rating for heat-pumps today11. Gas furnaces create heat by burning natural gas. They have an annual fuel utilization efficiency
(AFUE) of ~90%12. Therefore, heat pumps use ~3x less energy than gas furnaces (2.8/0.9).
07 Master Plan Part 3 – Sustainable Energy for All of EarthThe Plan to Eliminate Fossil Fuels
1.4
energy consumption
upstream losses
1.2
Input Energy / Heat Delivered
1.0
0.8
0.6
0.4
0.2
0.0
Gas Furnace Heat Pump
Figure 6: Efficiency improvement of space heating with heat pump vs gas furnace
Residential and Commercial Sectors
The EIA provides historical monthly US natural gas usage for the residential and commercial sectors in each sub-region8. The 3x
heat-pump efficiency factor reduces the energy demand if all gas appliances are electrified. The hourly load factor of baseline
electricity demand was applied to estimate the hourly electricity demand variation from heat pumps, effectively ascribing
heating demand to those hours when homes are actively being heated or cooled. In summer, the residential/commercial demand
peaks mid-afternoon when cooling loads are highest, in winter demand follows the well-known “duck-curve” which peaks in
morning & evening.
Global electrification of residential and commercial appliances with heat pumps eliminates 18 PWh/year of fossil fuel and creates
6PWh/year of additional electrical demand.
140
Summer
130 Winter
Percent of Average Load
120
110
100
90
80
70
0 5 10 15 20
Time of Day [hr]
Figure 7: Residential & commercial heating & cooling load factor vs time of day
08 Master Plan Part 3 – Sustainable Energy for All of EarthThe Plan to Eliminate Fossil Fuels
Industrial Sector
Industrial processes up to ~200C, such as food, paper, textile and wood industries can also benefit from the efficiency gains
offered by heat pumps13, although heat pump efficiency decreases with higher temperature differentials. Heat pump integration
is nuanced and exact efficiencies depend heavily on the temperature of the heat source the system is drawing from (temperature
rise is key in determining factor for heat pump efficiency), as such simplified assumptions for achievable COP by temperature
range are used:
Temperature/Application COP
0-60C Heat Pump 4.0
60-100C Heat Pump 3.0
100-200C Heat Pump 1.5
Table 2: Assumed Heat Pump Efficiency Improvements by Temperature
Based on the temperature make-up of industrial heat according to the IEA and the assumed heat pump efficiency by
temperature in Table 2, the weighted industrial heat pump efficiency factor modeled is 2.214,15,16.
The EIA provides historical monthly fossil fuel usage for the industrial sector for each sub-region8. All industrial fossil fuel use,
excluding embedded fossil fuels in products (rubber, lubricants, others) is assumed to be used for process heat. According to
the IEA, 45% of process heat is below 200C, and when electrified with heat pumps requires 2.2x less input energy16. The added
industrial heat-pump electrical demand was modeled as an inflexible, flat hourly demand.
Global electrification of industrial process heat 200C), account for the remaining 55% of fossil fuel use and require special
consideration. This includes steel, chemical, fertilizer and cement production, among others.
These high-temperature industrial processes can be serviced directly by electric resistance heating, electric arc furnaces or
buffered through thermal storage to take advantage of low-cost renewable energy when it is available in excess. On-site thermal
storage may be valuable to cost effectively accelerate industrial electrification (e.g., directly using the thermal storage media and
radiative heating elements)17,18.
09 Master Plan Part 3 – Sustainable Energy for All of EarthThe Plan to Eliminate Fossil Fuels
Identify the optimal thermal storage media by temperature/application
Charging = Thermal Battery Discharging =
heating thermal storage Energy cooling thermal
media with electricity, = massthermal_battery storage media by
steam, hot air, etc *heatcapacity* ∆T heating something else
Figure 8: Thermal Storage Overview
Delivering Heat to High Temperature Processes
Hot Fluids for
Fluids to be Heated
Delivery Process
Water Water Evaporating Steam
Molten Salt Molten Salt Heating Molten Salt (up to 550C)
Air Air Heating Hot Air (up to 2000+C)
Figure 9A: Thermal Storage - Heat Delivery to Process via Heat Transfer Fluids
Radiant Heat Directly to Product
Figure 9B: Thermal Storage - Heat Delivery to Process via Direct Radiant Heating
Electric resistance heating, and electric arc furnaces, have similar efficiency to blast furnace heating, therefore will require a
similar amount of renewable primary energy input. These high-temperature processes are modeled as an inflexible, flat demand.
Thermal storage is modeled as an energy buffer for high-temperature process heat in the industrial sector, with a round trip
thermal efficiency of 95%. In regions with high solar installed capacity, thermal storage will tend to charge midday and discharge
during the nights to meet continuous 24/7 industrial thermal needs. Figure 9 shows possible heat carriers and illustrates that
several materials are candidates for providing process heat >1500C.
Global electrification of industrial process heat >200C eliminates 9PWh/year of fossil fuel fuels and creates 9PWh/year of
additional electrical demand, as equal heat delivery efficiency is assumed.
10 Master Plan Part 3 – Sustainable Energy for All of EarthThe Plan to Eliminate Fossil Fuels
3000
Graphite/Carbon
AI203
Si02
Mullite
2500
Steel
Sand
Aluminum
Concrete
2000
Molten Salt
Temperature (C)
Thermal Oil
Water
1500
1000
500
0 500 1000 1500 2000 2500 3000 3500 4000 4500
Specific Heat (J/kgK)
Figure 10: Thermal Storage - Heat Storage Media
Note: Bubble diameters represent specific heat over usable range.
Sustainably Produce Hydrogen for Steel and Fertilizer
Today hydrogen is produced from coal, oil and natural gas, and is used in the refining of fossil fuels (notably diesel) and in
various industrial applications (including steel and fertilizer production).
Green hydrogen can be produced via the electrolysis of water (high energy intensity, no carbon containing products consumed/
produced) or via methane pyrolysis (lower energy intensity, produces a solid carbon-black byproduct that could be converted
into useful carbon-based products)g.
To conservatively estimate electricity demand for green hydrogen, the assumption is:
• No hydrogen will be needed for fossil fuel refining going forward
• Steel production will be converted to the Direct Reduced Iron process, requiring hydrogen as an input. Hydrogen demand to
reduce iron ore (assumed to be Fe3O4) is based on the following reduction reaction:
Reduction by H2
• Fe3O4 + H2 = 3FeO + H2O
• FeO + H2 = Fe + H2O
• All global hydrogen production will come from electrolysis
g Sustainable steel production may also be performed through molten oxide electrolysis, which requires heat and electricity, but does not require hydrogen as a reducing
agent, and may be less energy intensive, but this benefit is beyond the scope of the analysis19.
11 Master Plan Part 3 – Sustainable Energy for All of EarthThe Plan to Eliminate Fossil Fuels These simplified assumptions for industrial demand, result in a global demand of 150Mt/yr of green hydrogen, and sourcing this from electrolysis requires an estimated ~7.2PWh/year of sustainably generated electricityh,20,21. The electrical demand for hydrogen production is modeled as a flexible load with annual production constraints, with hydrogen storage potential modeled in the form of underground gas storage facilities (like natural gas is stored today) with maximum resource constraints. Underground gas storage facilities used today for natural gas storage can be retrofitted for hydrogen storage; the modeled U.S. hydrogen storage requires ~30% of existing U.S. underground gas storage facilities22,23. Note that some storage facilities, such as salt caverns, are not evenly geographically dispersed which may present challenges, and there may be better alternative storage solutions. Global sustainable green hydrogen eliminates 6 PWh/year of fossil fuel energy use, and 2 PWh/year of non-energy usei,24. The fossil fuels are replaced by 7PWh/year of additional electrical demand. 05 Sustainably Fuel Planes & Boats Both continental and intercontinental ocean shipping can be electrified by optimizing design speed and routes to enable smaller batteries with more frequent charge stops on long routes. According to the IEA, ocean shipping consumes 3.2PWh/year globally. By applying an estimated 1.5x electrification efficiency advantage, a fully-electrified global shipping fleet will consume 2.1PWh/ year of electricity25. Short distance flights can also be electrified through optimized aircraft design and flight trajectory at today’s battery energy densities26. Longer distance flights, estimated as 80% of air travel energy consumption (85B gallons/year of jet fuel globally), can be powered by synthetic fuels generated from excess renewable electricity leveraging the Fischer-Tropsch process, which uses a mixture of carbon monoxide (CO) and hydrogen (H2) to synthesize a wide variety of liquid hydrocarbons, and has been demonstrated as a viable pathway for synthetic jet fuel synthesis27. This requires an additional 5PWh/year of electricity, with: - H2 generated from electrolysis21 - CO2 captured via direct air capture28, 29 - CO produced via electrolysis of CO2 Carbon and hydrogen for synthetic fuels may also be sourced from biomass. More efficient and cost-effective methods for synthetic fuel generation may become available in time, and higher energy density batteries will enable longer-distance aircraft to be electrified thus decreasing the need for synthetic fuels. The electrical demand for synthetic fuel production was modeled as a flexible demand with an annual energy constraint. Storage of synthetic fuel is possible with conventional fuel storage technologies, a 1:1 volume ratio is assumed. The electrical demand for ocean shipping was modeled as a constant hourly demand. Global sustainable synthetic fuel and electricity for boats and planes eliminates 7PWh/year of fossil fuels, and creates 7PWh/year of additional global electrical demand. 06 Manufacture the Sustainable Energy Economy Additional electricity is required to build the generation and storage portfolio - solar panels, wind turbines and batteries - required for the sustainable energy economy. This electricity demand was modeled as an incremental, inflexible, flat hourly demand in the industrial sector. More details can be found in the Appendix: Build the Sustainable Energy Economy - Energy Intensity. h Adjusted current demand for hydrogen, removing demand related to oil refining, as that will not be required. Assumed all of the hydrogen produced from coal and natural gas today is replaced. Then, the energy required to produce the hydrogen from coal and natural gas, compared to electrolysis, is calculated. i According to the IEA, 85% of natural gas non-energy consumption is consumed by fertilizer and methanol production 12 Master Plan Part 3 – Sustainable Energy for All of Earth
Modeling the Fully Sustainable Energy Economy

These 6 steps create a U.S. electrical demand to be fulfilled with sustainable generation and storage. To do so, the generation
and storage portfolio is established using an hourly cost-optimal integrated capacity expansion and dispatch modelj. The model
is split between four sub-regions of the US with transmission constraints modeled between regions and run over four weather-
years (2019-2022) to capture a range of weather conditionsk. Interregional transmission limits are estimated based on the current
line capacity ratings on major transmission paths published by North American Electricity Reliability Council (NERC) Regional
Entities (SERC30, WECC31, ERCOT32). Figure 11 shows the fully electrified economy energy demand for the full US.

Modeled Regions and Grid Interconnections

                                                      24 GW

                                                                                                               37 GW
                                                                             20 GW

                                                                                          28 GW

                Pacific
                Eastern
                Midwest
                Texas

Map 1: US Modeled Regions and Interconnections

j Convex optimization models that can determine optimal capacity expansion and resource dispatch are widely used within the industry. For instance, by utilities or
  system operators to plan their systems (e.g., generation and grid investments required to meet their expected load), or to assess the impact of specific energy policies
  on the energy system. This model builds the least-cost generation and storage portfolio to meet demand every hour of the four-year period analyzed and dispatches
  that portfolio every hour to meet demand. The capacity expansion and dispatch decisions are optimized in one step, which ensures the portfolio is optimal over the
  period analyzed, storage value is fully reflected and the impact of weather variability modeled. Other analyses typically model capacity expansion and portfolio dispatch
  as two separate steps. The capacity expansion decisions are made first (e.g. how much generation and storage is estimated to be the least-cost portfolio over the time
  horizon), followed by separate dispatch modeling of the portfolio mix (e.g. how much generation and storage should be dispatched in each hour to meet demand with
  sufficient operating reserves). The two-stage approach produces pseudo-optimal results, but allows more computationally intensive models at each stage.
k The model is constrained to meet a 15% operating reserve margin every hour to ensure this generation and storage portfolio is robust to a range of weather and system
  conditions beyond those explicitely modeled.

13                                                                    Master Plan Part 3 – Sustainable Energy for All of Earth
Modeling the Fully Sustainable Energy Economy
1800
1600
1400
Total Demand [GW]
1200
1000
800
600
400
200
Jan ‘19 Jul ‘19 Jan ‘20 Jul ‘20 Jan ‘21 Jul ‘21 Jan ‘22 Jul ‘22
Figure 11: US Fully Electrified Hourly Demand New Industry Industrial Heat Pumps (200C) Existing Electrical Demand (All Sectors)
Wind and solar resources for each region are modeled with their respective hourly capacity factor (i.e., how much electricity is
produced hourly per MW of installed capacity), its interconnection cost and the maximum capacity available for the model to
build. The wind and solar hourly capacity factors specific to each region were estimated using historical wind/solar generation
taken from EIA in each region, thus capturing differences in resource potential due to regional weather patternsl,m. Capacity
factors were scaled to represent forward looking trends based on the recent Princeton Net-Zero America study33. Figure 11 shows
the hourly capacity factor for wind & solar versus time for the full US. Table 3 shows the average capacity factor and demand for
each region of the US.
l EIA does not report offshore wind production for the period analyzed given the limited existing offshore wind installed capacity. The offshore wind generation profile
was estimated by scaling the historical onshore wind generation profile to the offshore wind capacity factor estimated by the Princeton Net-Zero America study.
m Each region is modeled with two onshore wind and two solar resources with different capacity factor, interconnection cost and maximum potential. This accounts for the
fact that the most economic sites are typically built first and subsequent projects typically have lower capacity factors and/or higher interconnection cost as they may
be farther located from demand centers requiring more transmission or in locations with higher cost land.
14 Master Plan Part 3 – Sustainable Energy for All of EarthModeling the Fully Sustainable Energy Economy
90
70
Capacity Factor [%]
50
30
10
Jan ‘19 Jul ‘19 Jan ‘20 Jul ‘20 Jan ‘21 Jul ‘21 Jan ‘22 Jul ‘22
Figure 12: US Historical Hourly Renewable Capacity Factor Solar Resources Wind Resources
Region Wind CF Solar CF Demand [PWh/yr]
East 29% 22% 4.6
Midwest 40% 27% 3.6
Pacific 36% 27% 1.9
Texas 37% 23% 1.6
Full U.S. 34% 24% 11.6
Table 3: Wind and solar average historical capacity factor, and fully electrified economy demand by region
The model builds generation and storage based on resource-specific cost and performance attributes, and a global objective of
minimizing the levelized cost of energyn. The model assumes increased inter-regional transmission capacitieso.
To provide reliable year-round power, it is economically optimal to deploy excess solar and wind capacity, which leads to
curtailment. Curtailment will happen when (1) solar and/or wind generation is higher than the electricity demand in a region,
(2) storage is full and (3) there is no available transmission capacity to transmit the excess generation to other regions. There is
an economic tradeoff between building excess renewable generation capacity, building grid storage, or expanding transmission
capability. That tradeoff may evolve as grid storage technologies mature, but with the assumptions modeled, the optimal
generation and storage portfolio resulted in 32% curtailment.
n Costs considered in the objective function: levelized capex of new generation and storage with a 5% discount rate, fixed and variable operational and maintenance
(O&M) costs.
o 37 GW of transmission capacity is modeled between the Midwest and the East, 28 GW between Texas and the East, 24 GW between Pacific and the Midwest and 20 GW
between Texas and the Midwest. This corresponds to ~3% of the modeled combined regional peak load. E.g., the peak load of the combined East and Midwest regions
was ~1.2 TW, and the transmission capacity between Midwest and the East modeled as 37 GW. Currently, the transmission capacity isModeling the Fully Sustainable Energy Economy
For context, curtailment already exists in markets with high renewable energy penetration. In 2020, 19% of the wind
generation in Scotland was curtailed, and in 2022, 6% of solar generation in California (CAISO) was curtailed due to operational
constraints, such as thermal generators’ inability to ramp down below their minimum operating level, or local congestion on the
transmission system34,35.
The sustainable energy economy will have an abundance of inexpensive energy for consumers able to use it during periods of
excess, which will impact how and when energy is used.
In Figure 12 below, hourly dispatch is depicted across a sample of fall days, showing the role of each generation and storage
resource in balancing supply and demand, as well as the concentration of economic curtailment in the middle of the day when
solar is abundant.
1,200
1,000
800
GW
600
400
200
Oct 31 Nov 01 Nov 02 Nov 03
Nuclear Generation Hydro Generation Wind Generation Solar PV - Generation
Lithium-ion Storage Charging Lithium-ion Storage Discharging Thermal Storage Charging Thermal Storage Discharging
Hydrogen Storage Charging Hydrogen Storage Discharging Wind - Curtailment Solar PV - Curtailment
Total Demand
Figure 13: Hourly generation in 2019 in US Eastern region (excluding imports/exports)
16 Master Plan Part 3 – Sustainable Energy for All of EarthModeling the Fully Sustainable Energy Economy
900
30
800
Hydrogen Storage State of Energy (TWh)
25
700
20
Generation (GW)
600
15
500
10
400
5
300
0
Jan ‘19 Jul ‘19 Jan ‘20 Jul ‘20 Jan ‘21 Jul ‘21 Jan ‘22 Jul ‘22
Figure 14: Seasonality of Hydrogen storage charging and discharging Solar + Wind Generation Pre-Curtailment
in US Eastern region (monthly average) Hydrogen Storage State of Energy
In Figure 14, hydrogen storage is generally filled during the shoulder months (spring and fall) when electricity demand is lower as
heating and cooling seasons are over, and solar and wind generation is relatively high. Similarly, as excess generation declines in
summer and winter months, hydrogen reservoirs decline providing inter-seasonal hydrogen storage.
17 Master Plan Part 3 – Sustainable Energy for All of EarthEnergy Storage Technologies Evaluated
For stationary applications, the energy storage technologies in Table 4 below, which are currently deployed at scale, are
considered. Li-ion means LiFePO4/Graphite lithium-ion batteries. A range of conservative future installed costs are listed for
lithium ion given the volatility in commodities prices (especially lithium). While there are other emerging technologies such as
metal-air (Fe Fe2O3 redox couple) and Na-ion, these are not commercially deployed and therefore not considered.
2030-2040 O&M Cost Annual Technical Potential
Storage Technology RTE Lifetime
Installed Costp (/kW-yr) Cycling Limit (limitation)
Thermal Industrial thermal
Mechanical $78/kWhr $15.00q 95%r NA 20 yearsr
(15h) loads only
Pumped $270/kWh36 $17.8044 80%44 NA 100 years
Hydro volumes)36
Seasonal ~5.7 (in-flowGeneration Technologies Evaluated
The Table below details all the generation technologies considered in the sustainable energy economy. Installed costs were taken
from studies for 2030-2040 from NREL and the Princeton Net-Zero America study.
US Technical
2030-2040 Installed O&M Cost Capacity
Generation Lifetime Model Constraint Potential
Cost (/kW-yr) Factor
(limitation)
$752/kW44 + Technical potential perModel Results
US Only Model Results – Meeting New Electrification Demand
For the US, the optimal generation and storage portfolio to meet the electricity demand, each hour, for the years modeled is
shown in the Table below.
Electricity Generation Installed Annual Generationv Annual Generation
Technology Capacity (GW) (TWh) Curtailedw (TWh)
Onshore Wind 1,971 6,060 1,721
Offshore Wind 64 212 62
Solar PV 3,052 4,046 2,431
Nuclear (Existing) 99 699 Na
Hydro 152 620 Na
Total 5,338 11,637 4,214
Storage/Other Technologies Installed Capacity (GW) Installed Capacity (TWh)
8h Lithium-ion Storage 815 6.5
Industrial Thermal Storage 453 6.9
Electrolyzer 418 Na
Hydrogen Storagex Na 107
Total 1,686 120
Table 6: Model Results for US only
In addition, 1.2 TWh of distributed stationary batteries are added based on incremental deployments of distributed stationary
storage alongside rooftop solar at residential and commercial buildings. This includes storage deployments at 15 million
single-family homes48 with rooftop solar, industrial storage paired with 43GW49,50 of commercial rooftop solar, and storage
replacement of at least 200GW51 of existing backup generator capacityy. Distributed storage deployments are exogenous to
the model outputs given deployment driven by factors not fully reflected in a least-cost model framework, including end-user
resiliency and self-sufficiency when storage is paired with rooftop solar.
v After accounting for curtailment.
w The model curtails wind/solar generation when the electricity supply is higher than the electricity demand and battery/thermal/hydrogen storage are full already.
Curtailed wind/solar generation is generation that isn’t consumed by end-uses.
x 17.8 TWh of jet fuel derived from H2 are stored with current infrastructure
y Solar and storage is deployed at less than one-third of suitable residential buildings designated by NREL. Four hours of storage is assumed for C&I deployment and for
backup generator substitution.
20 Master Plan Part 3 – Sustainable Energy for All of EarthWorld Model Results – Meeting New Electrification Demand Applying the 6 steps to the world’s energy flow would displace all 125PWh/year of fossil fuels used for energy use and replace them with 66PWh/year of sustainably generated electricityz. An additional 4PWh/year of new industry is needed to manufacture the required batteries, solar panels and wind turbines (assumptions can be found in Appendix: Build the Sustainable Energy Economy – Energy Intensity). The global generation and storage portfolio to meet the electricity demand was calculated by scaling the US resource mix by 6x. As noted above, this is a significant simplification and could be an area for improvement in future analyses, as global energy demands are different from the U.S. in their composition and expected to increase over time. This analysis was conducted on the U.S. due to availability of high-fidelity hourly data. Sustainable Energy Economy [PWh/year] Figure 15: Sustainable Energy Economy, Global Energy Flow by Sector, IEA & Tesla analysis z Remaining ~9PWh/year of fossil fuels are consumed through non-energy uses 21 Master Plan Part 3 – Sustainable Energy for All of Earth
Batteries for Transportation

Vehicles
Today there are 1.4B vehicles globally and annual passenger vehicle production of ~85M vehicles, according to OICA. Based on
pack size assumptions, the vehicle fleet will require 112 TWh of batteriesaa. Autonomy has potential to reduce the global fleet, and
annual production required, through improved vehicle utilization.

Standard-range vehicles can utilize the lower energy density chemistries (LFP), whereas long-range vehicles require higher
energy density chemistries (high nickel). Cathode assignment to vehicle segment is listed in the table below. High Nickel refers
to low to zero cobalt Nickel Manganese cathodes currently in production, under development at Tesla, Tesla’s suppliers and in
research groups.

         Vehicle                Tesla                                          Pack Size                                                             Global Fleet
                                                       Cathode                                         Vehicle Sales             Global Fleet
          Type                Equivalent                                        (kWh)                                                                   (TWh)

        Compact                  [TBD]                    LFP                       53                       42M                    686M                   36

        Midsized              Model 3/Y                   LFP                       75                       24M                    380M                   28

   Commercial/
                                 [TBD]                High Nickel                   100                       10M                   163M                   16
  Passenger Vans

     Large Sedans,            Model S/X,
                                                      High Nickel                   100                       9M                    149M                   15
     SUVs & Trucks            Cybertruck

           Bus                   [TBD]                    LFP                      300                         1M                    5M                     2

       Short Range
                              Semi Light                  LFP                      500                         1M                   6.7M                    3
       Heavy Truck

       Long Range
                             Semi Heavy               High Nickel                  800                        2M                    13.3M                   11
       Heavy Truck

          Total                      -                      -                         -                      89M                   1,403M                  112

Table 7: Vehicle Fleet Breakdown

aa		   To approximate the battery storage required to displace 100% of road vehicles, the global fleet size, pack size (kWh)/ Global passenger fleet size and annual
		     production (~85M vehicles/year) is based on data from OICA. The number of vehicles by segment is estimated based on S&P Global sales data. For buses and trucks,
		     the US-to-global fleet scalar of ~5x is used as global data was unavailable

22                                                                    Master Plan Part 3 – Sustainable Energy for All of Earth
Batteries for Transportation
Global Electric Fleet
40M 380M 20M 300M 700M
Ships and Planes
With 2.1PWh of annual demand, if ships charge ~70 times per year on average, and charge to 75% of capacity each time, then
40TWh of batteries are needed to electrify the ocean fleet. The assumption is 33% of the fleet will require a higher density Nickel
and Manganese based cathode, and 67% of the fleet will only require a lower energy density LFP cathode. For aviation, if 20% of
the ~15,000 narrow body plane fleet is electrified with 7MWh packs, then 0.02TWh of batteries will be required.
These are conservative estimates and likely fewer batteries will be needed.
Cathode Global Fleet (TWh)
Longer Range Ship Ni/Mn Based 12
Shorter Range Ship LFP 28
Plane High Nickel 0.02
Total - 40
Table 8: Electric Ship and Plane Fleet Breakdown
23 Master Plan Part 3 – Sustainable Energy for All of EarthWorld Model Results – Electrification & Transportation Batteries
Table 9 summarizes the generation and storage portfolio to meet the global electricity demand and the transportation storage
required based on the vehicle, ship and plane assumptions. Explanation of how the generation and storage portfolios were
allocated to end-uses can be found in Appendix: Generation and storage allocation to end-uses.
Planes Stationary Stationary
Vehicle Solar Wind Solar Hydrogen
& Ships E-chem Thermal Electrolyzers
Batteries Generation Generation + Wind Storage
Batteries Batteries Batteries (TW)
(TWh) (TW) (TW) (TW) (TWh)
(TWh) (TWh) (TWh)
Repower the
Existing Grid with - - 22.9 - 6.8 3.8 10.6 - -
Renewables
Switch to
112 - 3.7 - 3.3 1.5 4.9 - -
Electric Vehicles
Switch to Heat
Pumps in Residential, - - 6.7 - 2.7 2.1 4.8 - -
Business & Industry
Electrify High
Temperature - - 4.1 41.4 1.3 1.5 2.8 - -
Heat Delivery
Hydrogen - - 4.4 - 2.1 1.6 3.7 2.5 642
Sustainably Fuel
- 40 4.4 - 2.1 1.6 3.7 - -
Planes & Boats
Total 112 40 46.2 41.4 18.3 12.1 30.3 2.5 642
Table 9: Generation and Storage Portfolio to Meet the Global Electricity Demand & Transportation Batteries
24 Master Plan Part 3 – Sustainable Energy for All of EarthWorld Model Results – Electrification & Batteries for Transportation
Vehicle & Stationary Batteries (TWh)
250 44 240
46 4
200
7
150
116
100
50
23
Repower the Switch to Switch to Electrify High Sustainably Sustainably Fuel Total
Existing Grid with Electric Vehicles Heat Pumps Temperature Heat Produce Hydrogen Planes & Boats
Renewables Delivery
Table 10: Storage Waterfall
Solar & Wind Farms (TW)
35
4 30
30
4
25 3
5
20
5
15
11
10
5
Repower the Switch to Switch to Electrify High Sustainably Sustainably Fuel Total
Existing Grid with Electric Vehicles Heat Pumps Temperature Heat Produce Hydrogen Planes & Boats
Renewables Delivery
Table 11: Solar & Wind Waterfall
25 Master Plan Part 3 – Sustainable Energy for All of EarthInvestment Required
Investment catalogued here is inclusive of the manufacturing facilities, mining and refining operations for materials that require
significant growth, and hydrogen storage salt cavern installation. Manufacturing facilities are sized to the replacement rate of
each asset, and upstream operations (e.g., mining) are sized accordinglybb. Materials that require significant capacity growth are:
For mining: nickel, lithium, graphite and copper.
For refining: nickel, lithium, graphite, cobalt, copper, battery grade iron and manganese.
In addition to initial capex, 5%/year maintenance capex with a 20-year horizon is included in the investment estimate. Using
these assumptions, building the manufacturing infrastructure for the sustainable energy economy will cost $10 trillioncc, as
compared to the $14 trillion projected 20-year spend on fossil fuels at the 2022 investment rate52.
A Sustainable Energy Economy is 60% the Cost
of Continuing Fossil Fuel Investments
$16
Coal
$14T Natural Gas
$14 Oil
Dollars of capital investment [Trillions]
$12
$10T
$10
$8
$6
$4
$4
$-
20 years of investment 20 years investment in
In fossil fuels At 2022 rate Sustainable energy economy
Figure 16: Investment Comparison
bb For example, if 46 TWh of stationary LFP battery storage is required, and the life of a battery is 20 years, then the manufacturing capacity is sized to 2.3 TWh/year
cc In-scope manufacturing capacity investments: wind turbines, solar panels, battery cells, upstream battery inputs, mining, refining, electric vehicles, heat pumps, and
electrolyzers, carbon capture, and Fischer Tropsch. Salt cavern hydrogen storage is also included
26 Master Plan Part 3 – Sustainable Energy for All of EarthInvestment Required
Total Investment
Annual Capacity Capital Initial
Category Unit (includes 20yrs. of 5% Notes/Source
(units) Intensity/Unit Investment sustaining capex)
First Solar Alabama factory
Solar Panel
GW/yr. 610 $347.3M $212B $424B estimate, plus internal
Factories estimate for solar recycling
Wind Turbine
GW/yr. 402 $26.5M $11B $21B Internal estimate
Factories
Vehicle Internal estimate of
Car/yr. 89M $10K $890B $1,780B
Factories industry average
Internal estimate
E-chem Battery
GWh/yr. 11,488 $95M $1,091B $2,183B of Industry avg,
Factories includes recycling
Stationary E-chem
Internal estimate of
Factories GWh/yr. 2,310 $10M $23B $46B industry average
(e.g. Megapack)
Stationary
GWh/yr. 2,070 $24M $50B $99B Internal estimate
Thermal Factories
Internal estimate of industry
Transportation -
GWh/yr. 9,178 $91.2M $837B $1,674B average based on public
Mining/Refining industry reports
Internal estimate of industry
Stationary -
GWh/yr. 2,310 $81.9M $189B $378B average based on public
Mining/Refining industry reports
Internal estimate of industry
Generation -
GW/yr. 1,013 $136.6M $138B $277B average based on public
Mining/Refining industry reports
Upstream E-chem
GWh/yr. 9,178 $24.1M $221B $443B Internal estimate
for Vehicles
Upstream E-chem
GWh/yr. 2,070 $16.2M $34B $67B Internal estimate
for Stationary
Assume $3B mfg capex to replace
Heat Pumps Total Na Na $30B $60B home heat pumps; conservatively
$30B for all heat pumps
Assumes PEM Technology;
Electrolyzers kW/yr. 2.5B $230 $577B $1,155B cost will depend on learning
curve achieved53
Yet to be demonstrated at
Carbon Capture Ton CO2
800M $200 $160B $320B large scale; cost will depend
(synthetic fuels) /yr. on learning curve achieved54,55
Fischer Tropsch Barrel Assumes efficiency curve as
5.5M $70K $385B $770B
(synthetic fuels) per day project scale increases56
Hydrogen Storage kg NA $19 $362B $725B $19/kg39
Total - - - $5,211B $10,421B -
Table 12: Investment Summary
27 Master Plan Part 3 – Sustainable Energy for All of EarthInvestment Required
Table 13 Provides additional detail into mining, refining, vehicle factories, battery factories and recycling assumptions. Mining and
refining assumptions are an internal estimate of industry average based on public industry reports:
Mining
Unit Capital Intensity/Unit kt Required/Year Required Capex
Ni kt/year $51M 2,850 $145B
LHM (Li) kt/year $25M 6,785 $170B
Gr kt/year $10M 10,446 $104B
Cu kt/year $12.5M 6,600 $83B
Total Mining Capex $502B
Table 13A: Additional Investment Assumption Detail
Refining
Unit Capital Intensity/Unit kt Required/Year Required Capex
Ni kt/year $20M 2,850 $57B
Co kt/year $30M 16 $0
LHM (Li) kt/year $30M 6,785 $204B
Fe kt/year $14M 6,025 $84B
Gr kt/year $17M 10,446 $178B
Cu kt/year $20M 6,600 $132B
Mn kt/year $14M 530 $7B
Total Mining Capex $662B
Table 13B: Additional Investment Assumption Detail
28 Master Plan Part 3 – Sustainable Energy for All of EarthInvestment Required
Vehicle & Battery Factories
Capital Annual Capacity
Unit Required Capex Notes/Source
Intensity/Unit Needed
Vehicle Internal estimate
Cars/year $10K 89M $890B
Factories of industry average
E-Chem Battery Internal estimate
GWh/year $80M 11,488 $919B
Factories of industry average
Thermal Battery
GWh/year $10M 2,070 $21B Internal estimate
Factory
Batterypack
GWh/year $10M 2,310 $23B Internal estimate
Factory
Upstream Battery
GWh/year $24.9M 9,178 $229B Internal estimate
Materials
Total Mining Capex $2,082B
Table 13C: Additional Investment Assumption Detail
Recycling
Capital Annual Capacity
Unit Required Capex Notes/Source
Intensity/Unit Needed
Echem Battery
GWh/year $15M 11,488 $172B Internal estimate
Recycling
Thermal Battery
GWh/year $14M 2,070 $29B Internal estimate
Recycling
Solar Recycling GW/year $14M 610 $9B Internal estimate
Turbine Recycling GW/year $14M 402 $6B Internal estimate
Total Mining Capex $215B
Table 13D: Additional Investment Assumption Detail
29 Master Plan Part 3 – Sustainable Energy for All of EarthLand Area Required
Solar land area requirement is estimated based on a US Lawrence Berkeley National Laboratory (LBNL) empirical assessment
of actual US projects, which found that the median power density for fixed-tilt systems installed from 2011-2019 was
2.8 acres/MWdc57. Converting MWdc to MWac using a 1.4 conversion ratio yields roughly 3.9 acres/MWac. Therefore, the global
solar panel fleet of 18.3TW will require roughly 71.4 million acres, or 0.19% of the total 36.8 billion acres global land area.
Wind land area requirement is estimated based on a US National Renewable Energy Laboratory (NREL) study which found that
the direct land usage is 0.75 acres per MW58. Therefore, the global wind turbine fleet of 12.2TW will require an estimated
9.2 million acres, or 0.02% of total land area.
Table 14: Solar and Wind Direct Land Area by Continent
Solar Direct Land Area 0.19% of Land
Wind Direct Land Area 0.02% of Land
30 Master Plan Part 3 – Sustainable Energy for All of EarthMaterials Required
Assumptions
The total materials required for solar panels, wind turbines, and circuit miles miles are calculated based on third party material
intensity assumptions. Battery material intensity is based on internal estimates. Solar panel and wind turbine material intensity
assumptions are from a European Commission report. Solar cells are wafer-based crystalline silicon, and rare earth minerals are
eliminated from wind turbines, given the progress demonstrated in developing technologies59.
Based on IEA’s 2050 Net Zero pathways study, approximately 60 million circuit miles will need to be added or reconductored
globally to achieve a fully sustainable, electrified global economy. Distribution capacity will primarily be expanded by
reconductoring existing lines and expanding substation capacity that can accommodate significant growth in peak and average
end-user demand. High-voltage transmission will primarily expand geographic coverage to connect large wind and solar
generation capacity to densely populated areas. For purposes of estimating material requirements, 90% of the 60 million circuit
miles will be reconductoring of existing low-voltage distribution systems and 10% will be new circuit-miles from high-voltage
transmission, which is the current ratio of US circuit miles between high-voltage transmission and low-voltage distribution60,61.
ton/GW Solar Wind Notes
Concrete 56,200 328,250 -
Steel 62,800 119,500 -
Glass 42,900 8,050 -
Plastic 7,900 - -
Aluminum 7,500 1,050 -
Copper 4,300 2,975 -
Iron - 19,400 -
Silicon 2,000 - -
Zinc - 5,500 -
Polymers - 4,600 -
Manganese - 790 -
Chromium - 525 -
Nickel - 340 -
Molybdenum - 109 exclude, design out
Neodymium - 96 exclude, design out
Silver 4 - -
Praseodymium - 18 exclude, design out
Dysprosium - 8 exclude, design out
Terbium - 4 exclude, design out
Boron - 3 exclude, design out
Table 15: Generation Materials: Tons per GW62
31 Master Plan Part 3 – Sustainable Energy for All of EarthMaterials Required
kg/kWh High Ni LFP Ni/Mn Based Thermal
Ni 0.75 - 0.40 -
Co - - 0.06 -
Al 0.09 0.33 0.12 -
Mn - - 0.73 -
Fe - 0.78 - -
P - 0.42 - -
Cu 0.17 0.27 0.23 -
Gr 0.59 1.05 0.89 4.00
Si 0.04 - - -
LHM (Li)* 0.54 0.61 0.63 -
Table 16: Battery Materials: kg per kWh
kg/km Concrete Steel Aluminum Copper Glass Lead
HV Overhead 209,138 52,266 12,883 - 1,100 -
HV Underground 17,500 - - 11,650 - 14,100
MV Overhead - 802 - 1,488 - -
MV Underground - - 824 663 - -
LV Overhead - - 981 - - -
LV Underground - 177 531 - - -
Table 17: Transmission Materials: kg per km63
Using the above assumptions, 12,815 million tonnes in total (444 million tonnes annually) will be required to manufacture 30 TW
of generation, 240 TWh of battery storage, and 60M transmission miles.
* LHM is equivalent to LiOH-H2O and has approximately 6x the mass as the Lithium alone
32 Master Plan Part 3 – Sustainable Energy for All of EarthMaterials Required
Total Materials Annual Materials
Material Generation Battery Transmission Total Material Generation Battery Transmission Total
Nickel 4 36 - 40 Nickel 0 3 - 3
Cobalt - 1 - 1 Cobalt - 0 - 0
Aluminum 150 52 210 412 Aluminum 5 3 7 15
Manganese 10 8 - 18 Manganese 0 0 - 1
Iron 2,826 113 495 3,434 Iron 94 6 16 117
Copper 115 49 - 164 Copper 4 3 - 7
Graphite - 353 - 353 Graphite - 19 - 19
LHM (Li) - 118 - 118 LHM (Li) - 7 - 7
Silver 0.07 - - 0.07 Silver 0.002 - - 0.002
Zinc 66 - - 66 Zinc 2 - - 3
Phosphorus - 61 - 61 Phosphorus - 3 - 3
Concrete 4,991 - 2,019 7,010 Concrete 166 - 67 234
Plastic 145 - - 145 Plastic 5 - - 5
Glass 883 - 11 893 Glass 29 - 0.4 30
Silicon 37 2 - 38 Silicon 1 - - 1
Polymers 56 - - 56 Polymers 2 - - 2
Chromium 6 - - 6 Chromium 0.2 - - 0.2
Total 9,288 793 2,734 12,815 Total 310 43 91 444
Table 18: Total Material Intensity [Mt]
Material Extraction
The mass flows associated with these materials (i.e., how much earth is moved) relies on ore grade and through-process yield.
Using an internal estimate of industry average compiled from public industry reports (See Table 19), the required annual mass
flow is estimated to be 3.3 gigatonnes (Gt). Mass flows can reduce if aluminum (50% ore grade) is substituted for copper (1% ore
grade), which is possible in many use cases. It is assumed that 50% of lithium is extracted from brine 100% ore grade, if this is
not the case, then the mass flow associated with lithium would increase by 0.8Gt.
According to the Circularity Gap Report 2023, 68Gt of material, excluding biomass, is extracted from the earth each year –
fossil fuels account for 15.5Gt of this64. In a sustainable energy economy, material extraction will decrease by 10.8Gt – with most
fossil fuel extraction replaced by 3.3Gt of renewable material extraction. The assumption is that fossil fuel extraction associated
with non-energy end uses (i.e. plastics and other chemicals) continues, approximately 9% of the fossil fuel supply, according to
the IEA.
33 Master Plan Part 3 – Sustainable Energy for All of EarthMaterials Required
Ore % Through-Process Yield Peak Ore Mined (Mt)
Nickel 1.0% 79% 370
Cobalt 0.4% 77% 5
Aluminum 44.9% 90% 37
Manganese 41.9% 75% 2
Iron 61.5% 65% 293
Copper 0.9% 81% 955
Graphite 16.9% 86% 128
LHM (Li) 0.7% 58% 860
Silver 0.002% 75% 185
Zinc 5.6% 82% 48
Phosphorus 12.5% 50% 52
Concrete 100% 65% 360
Plastic 100% 100% 5
Glass 100% 100% 30
Silicon 80% 38% 4
Polymers 100% 100% 2
Chromium 34.5% 65% 0
Total 3,335
Table 19: Annual Material Extraction Requireddd
Material Availability
The total material in Table 18 extraction is evaluated against 2023 USGS resources to assess feasibility. For silver, the USGS does
not publish a resources estimate, so reserves were used. The analysis suggests that solar panels will require 13% of the 2023
USGS silver reserves, but silver can be substituted with copper, which is cheaper and more abundant65. Graphite demand can be
met with both natural and artificial graphite - the former is mined and refined, and the latter is derived from petroleum coke66.
As a result, the graphite resource base was increased to account for artificial graphite production from oil products. If only a
small fraction of the world’s oil resource is used for artificial graphite production, graphite resources will not be a constraint67.
Ongoing development is aimed at evaluating other carbon containing products as feedstock for artificial graphite production,
including CO2 and various forms of biomass68.
In sum, there are no fundamental materials constraints when evaluating against 2023 USGS estimated resources. Furthermore,
Resources and Reserves have historically increased – that is, when a mineral is in demand, there is more incentive to look for it
and more is discovered69. Annual mining, concentrating, and refining of relevant metal ores must grow to meet demand for the
renewable energy economy, for which the fundamental constraints are human capital and permitting/regulatory timelines.
dd Assume 50% of the Lithium was extracted from brine. 100% ore mined for that portion of Lithium supply
34 Master Plan Part 3 – Sustainable Energy for All of EarthMaterials Required
Materials to Build Required 30TW Generation, 240TWh Storage, and 60M Miles of Conductors
Relative to 2023 USGS Estimated Resources
Lithium
Nickel
Silver
Zinc
Copper
Cobalt
Iron
Manganese
Aluminum
Graphite
Phosphorus
0% 10% 20% 30% 40% 50% 60% 70% 80% 90% 100%
Figure 17: Materials Required Relative to 2023 USGS Estimated Resources
Global Minerals Reserve/Resource Base – Correcting Public Perception
What People Think Happens What Actually Happens
9 9 Ni Li Co Cu
8 8
7 7
Global Reserves
Global Reserves
6 6
5 5
4 4
3 3
2 2
1 1
2002 2006 2010 2014 2018 2022 2002 2006 2010 2014 2018 2022
Figure 18 Global Minerals Reserve/Resource base - Correcting Public Perception
35 Master Plan Part 3 – Sustainable Energy for All of EarthMaterials Required
Recycling
To support this plan, significant primary material demand growth is required to ramp manufacturing for the sustainable energy
economy, once the manufacturing facilities are ramped, primary material demand will level out. In the 2040’s, recycling will begin
to meaningfully reduce primary material demand as batteries, solar panels and wind turbines reach end-of-life and valuable
materials are recycled. Although mining demand will decrease, refining capacity will not.
Refining demand will continue to
increase with energy consumption/
Demand growth levels out as GDP/population growth
recycling volumes increase
and vehicle/stationary storage
markets near saturation
Demand drops as EoL
Raw Material Demand
volumes approach total
demand volumes
Significant demand
increase as the “circuit
is filled”
2023 2028 2033 2038 2043 2048
Figure 20 Illustrative Recycling Impact on Process Flow, assuming 80% critical material recovery
2030’s 2050’s
Mined Ore Mined Ore
Refining Refining
Engineered Products Engineered Products
Crushing/Inerting Crushing/inerting
(Precursor, Cathode) (Precursor, Cathode)
Cells Cells
Products Products
Collection/Sorting Collection/Sorting
(Vehicle/Storage) (Vehicle/Storage)
Figure 19: Illustrative Recycling Impact on Process Flow, assuming 80% critical material recovery
36 Master Plan Part 3 – Sustainable Energy for All of EarthConclusion
A fully electrified and sustainable economy is within reach through the actions in this paper:
1. Repower the Existing Grid with Renewables
2. Switch to Electric Vehicles
3. Switch to Heat Pumps in Residential, Business & Industry
4. Electrify High Temperature Heat Delivery and Hydrogen Production
5. Sustainably Fuel Planes & Boats
6. Manufacture the Sustainable Energy Economy
Modeling reveals that the electrified and sustainable future is technically feasible and requires less investment and less material
extraction than continuing today’s unsustainable energy economy.
240 TWh 30 TW $10T 1/2
Storage Renewable Power Manufacturing Investment The Energy Required
0.21% 10% ZERO
Land Area Required 2022 World GDP Insurmountable Resource Challenges
Figure 2: Estimated Resources & Investments Required for Master Plan 3
37 Master Plan Part 3 – Sustainable Energy for All of EarthYou can also read