BC Nexus Model Impacts of electrification on land and water resources through 2050
←
→
Page content transcription
If your browser does not render page correctly, please read the page content below

BC Nexus Model
Impacts of electrification on land and water
        resources through 2050

 NASTARAN ARIANPOO, FELIPE P. SINGH, ANDREW S. WRIGHT, TACO NIET
                        ∆E+ Research Group

                        Simon Fraser University

                        March 19, 2021
ABSTRACT
      This report presents the progress and current results in the development of an open-source
model referred to as BC Nexus. The BC Nexus model has been developed to provide decision-
makers in British Columbia (BC) with insight into the synergies and trade-offs of climate policies
and their impact on land, energy and water resources. A growing number of countries are passing
ambitious climate policies, especially within the energy sector. As yet, few studies have
accounted for the impact that a single sector's decisions may impose on others. The nexus
approach applied in this model provides insight to how integrated supply and demand issues are
related to energy, land and water resources in a changing climate. BC energy, land and water
systems are used to calibrate the model as a case study. The outcome of this project is an in-
depth investigation of decarbonization policy options for BC, with the aim of providing clarity into
the associated impacts on water and land resources and on CO2 emissions reduction.
Additionally, the project sheds light on the technology mix and costs required to apply those
policies successfully.

                                                                                                   I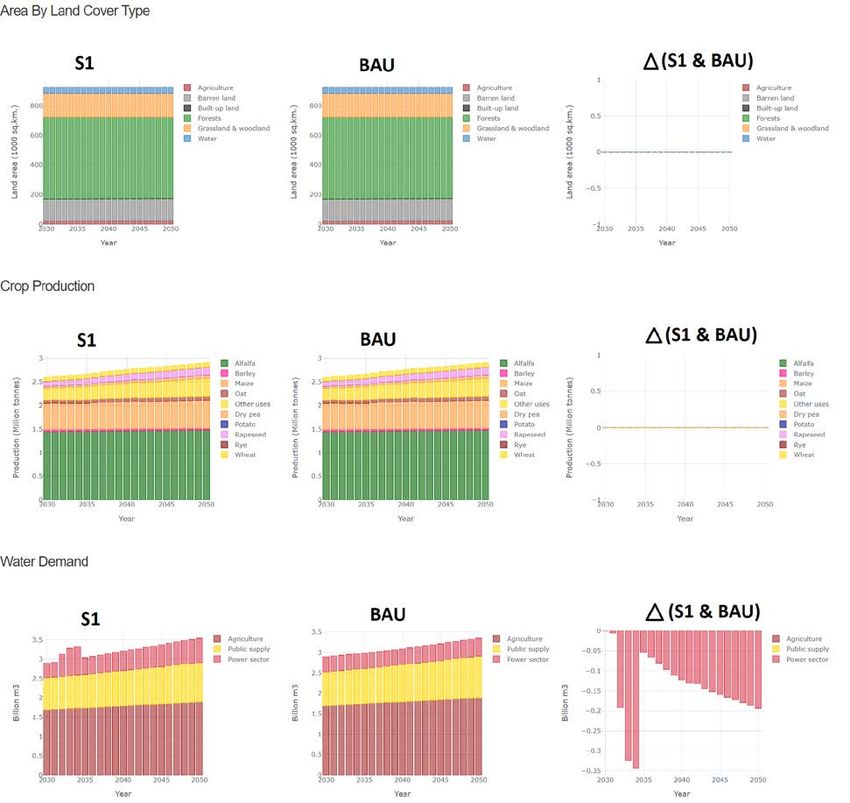
CONTENTS
  Abstract .................................................................................................................................. I
  List of Figures ........................................................................................................................ III
  List of Tables ......................................................................................................................... III
  Introduction ........................................................................................................................... 1
  Background ............................................................................................................................ 2
  Model Structure and Methodology....................................................................................... 3
     Structure and Underlying Assumptions ............................................................................. 4
     Data .................................................................................................................................... 6
       ›    Energy system ....................................................................................................... 6
       ›    temporal representation and demand for the power system .............................. 8
       ›    Land system ........................................................................................................... 9
       ›    Water and climate systems ................................................................................. 11
     Scenarios .......................................................................................................................... 11
  Modelling results and analysis ............................................................................................ 15
     Reference Scenario (BAU)................................................................................................ 15
     Scenario 1 (S1): Aggressive electrification ....................................................................... 17
     Scenario 2 (S2): Aggressive electrification plus carbon tax ............................................. 20
     Land and water use.......................................................................................................... 21
     CO2 emission targets........................................................................................................ 23
  Discussion ............................................................................................................................ 24
     Accessibility and Transparency ........................................................................................ 24
     Usability for Policy Design and integration in a national modelling platform ................ 25
     Current Status and Envisioned Future Work ................................................................... 26
  Conclusion ........................................................................................................................... 27
  Acknowledgements ............................................................................................................. 28
     References ....................................................................................................................... 29
  Appendix A .......................................................................................................................... 32

                                                                                                                                              II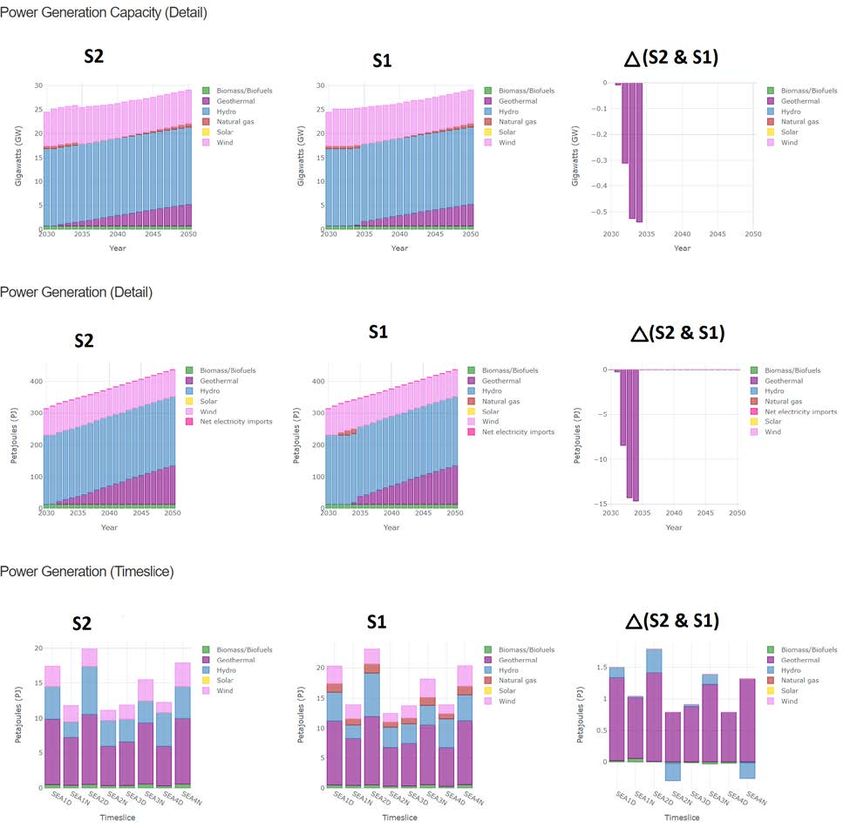
LIST OF FIGURES
FIGURE 1: BC NEXUS MODEL COMPONENTS AND AFFILIATION TO THE SDGS (AFTER [19]) ...............................................................5
FIGURE 2: BC CROP ATTAINABLE YIELD CLUSTERS BASED ON SIMILAR IRRIGATION AND INTENSITY COMBINATIONS. ...............................10
FIGURE 3: BAU SCENARIO- BC’S ENERGY OUTLOOK (PJ/YEAR) BASED ON THE 2019 CANADA’S ENERGY FUTURE REPORT. ...................12
FIGURE 4: BAU SCENARIO – POWER GENERATION CAPACITY TO MEET THE DEMAND BETWEEN 2030-2050 WITH AND WITHOUT RESERVE
        MARGIN VALUE OF 10.4%. ....................................................................................................................................... 13

FIGURE 5: S2 – BC CARBON TAX PREDICTION BASED ON FEDERAL POLICY. ....................................................................................14
FIGURE 6: BAU SCENARIO RESULTS- ENERGY SYSTEM ASSESSMENT ............................................................................................16
FIGURE 7: COMPARING BAU AND S1 SCENARIOS- FINAL ENERGY CONSUMPTION. .........................................................................18
FIGURE 8- BAU VS. S1 SCENARIO RESULTS- GROSS ENERGY CONSUMPTION BY FUEL. .....................................................................18
FIGURE 9: BAU VS. S1 SCENARIO RESULTS- POWER SYSTEM TECHNOLOGY MIX AND GENERATION DETAILS. ........................................19
FIGURE 10: S1 VS BAU- CHANGE IN SECTORAL ELECTRIFICATION. ..............................................................................................20
FIGURE 11: INSTALLED GENERATION MIX FOR BC: 2019 STATUS QUO VS. 2050 BAU AND 2050 S1. ..............................................20
FIGURE 12: S2 VS. S1-INVESTIGATING THE EFFECT OF CARBON TAX ON THE ENERGY SYSTEM. ..........................................................21
FIGURE 13: LAND AND WATER USE- COMPARISON BETWEEN S1 AND BAU SCENARIO. ...................................................................23
FIGURE 14: CO2 EMISSION REDUCTION IN S1 AND BAU SCENARIOS. ..........................................................................................24

LIST OF TABLES
TABLE 1: MAIN DATA USED TO CALIBRATE THE ENERGY SYSTEM FOR BC. .......................................................................................7
TABLE 2: TEMPORAL DATA STRUCTURE OF THE BC NEXUS MODEL. ..............................................................................................8
TABLE 3: ELECTRICAL DEMAND PROFILE OF BC. .......................................................................................................................9
TABLE 4: MAIN DATA USED TO CALIBRATE THE LAND SYSTEM FOR THE BC NEXUS MODEL. ................................................................9
TABLE 5: THE SUMMARY OF THE SCENARIO’S DIRECTIONS AND ASSUMPTIONS...............................................................................15

                                                                                                                                                                     III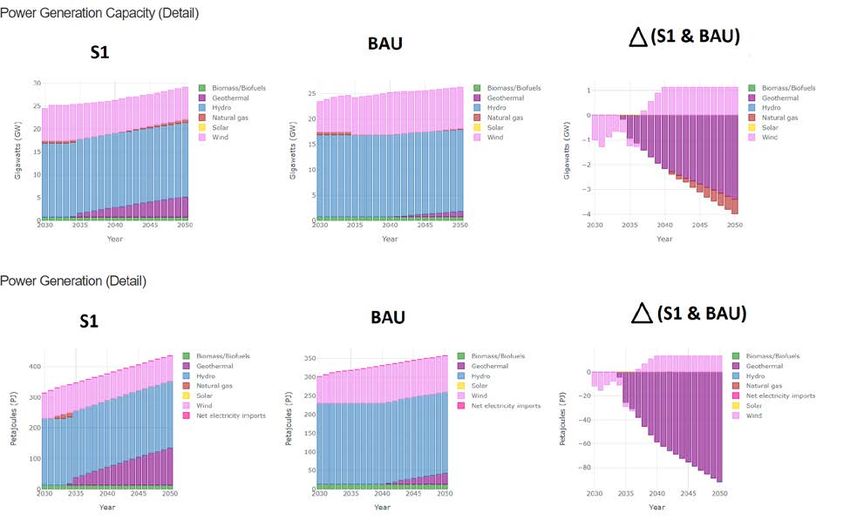
INTRODUCTION
      Climate change is the most critical challenge of our times: temperatures are rising around
the world; natural disasters occur more frequently, and natural resources are scarce. Global
demands for water, food and energy are predicted to increase by about 50% by 2050 due to the
impacts of climate change, urbanization, and population growth [1]. To combat climate change,
the decarbonization of the energy system needs to be accelerated. A growing number of
governments, jurisdictions and municipalities are passing ambitious energy decarbonization
policies. However, few studies have accounted for the impact of these energy transition policies
on water resources as well as natural and agricultural lands, and how the changes in these sectors
may impact the cost and effectiveness of these energy policies overtime [2].

      This report outlines the development and initial results of the BC Nexus modelling project.
The project centres around development of a nexus of water, food, energy, and a climate model
calibrated with BC specification. The model will enable exploration of the impacts of various BC
decarbonization policies on security of these interdependent systems. This report presents the
model design and structure as well as the results of the BC policy scenarios investigated with the
model. The objective of the scenarios is to evaluate the trade-offs and synergies associated with
the selected BC decarbonization policies within the energy sector on water resources and natural
and agricultural lands. The model was developed using the CLEWS (Climate, Land, Energy, Water
Systems) modelling platform [3]. Input data collected to represent the current BC status quo
includes the electricity generation portfolio (technology mix, energy supply and demand, etc.),
water provision (availability, constraints), land use (types of land, agriculture, crop yields, etc.),
and CO2 emissions ratio for every activity within each of the WEF systems. The model also
represents energy technologies that are missing from the current BC energy system (e.g.,
geothermal and nuclear power technologies) to allow optimization for the most efficacious
technology selections that enable BC’s energy transition. The model runs a cost optimization
assessment for each decarbonization policy to choose the least-cost pathway and most reliable
energy technology mix to apply those policies successfully while still meeting demand and policy
constraints. The model identifies the points at which each sector interacts with the others, such

                                                                                             Page | 1
as the land requirement with energy, food with water infrastructure, or the water requirements
with the agriculture and energy systems.

BACKGROUND
      The term “nexus”, used here to describe the model, refers to the interactions among
interdependent components [1]. The application of this concept within resource management is
not new. The term “nexus” was applied to the concept of resource management in the early
2000s and gained popularity after the World Economic Forum in 2008, where the challenges
within the economic domain were examined through their linkages with climate change, water,
food and energy systems (Water-energy-food nexus (WEF nexus) [1]. The concept is most
commonly applied to required compromise in achieving resource security [4]. “Nexus” structure
indicates how the changes in the availability or functionality of one component can impose
pressure on security of other interdependent components within the nexus. The recognition of
the interdependency between water, energy, land (food) (WEF) resources has gained momentum
in both policy and research communities to change the approaches toward managing these
resources. Several models and frameworks (e.g. [2], [5], [6]), including the Climate, Land, Energy,
Water Systems (CLEWS) modelling framework applied in this project, have been developed to
help policymakers better understand the complexity and interaction that comes with the nexus
concept.

      The goal of modelling nexus systems is to maintain the resiliency of the whole system by
creating feedback mechanisms between its interdependent components [7]. In recent years,
several energy models have partially incorporated water, land use and climate elements into
their analysis [8], [9]. The review of existing energy modelling approaches [10] maps two
significant gaps in the representation of the cross-disciplinary and intersectoral linkages required
by the nexus concept within the existing energy system models. The first gap exists within the
energy system modelling itself. Energy-economy models, which directly assist policymakers with
the future of energy system decisions, are not equipped to capture the full scale of flexibility and
the operational curtailments required within a system that has a high penetration of variable

                                                                                           Page | 2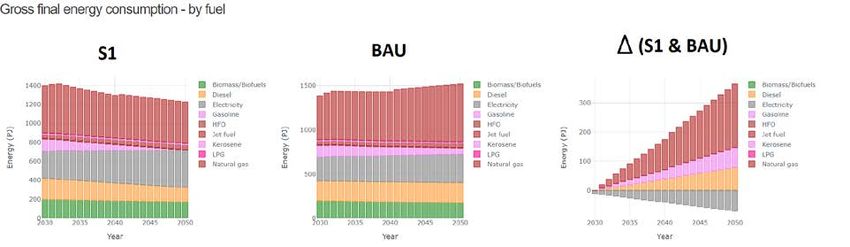
renewable energy generation (e.g. [11] [12] [13]). The second gap, however, is identified as how
energy system models define the interaction of energy system policy and investment decisions
with the other elements related to health and well-being of human and ecosystems. To the best
of the authors’ knowledge, the current energy models that are applied to investigate Canada's
climate policies only consider modest aspects of these interconnected systems. These models
are often partial (components are not equally weighted) in their cross-disciplinary analysis as
they mainly represent energy or water-centric perspectives, overlooking the importance of cross-
disciplinary feedback mechanisms [14].

      The CLEWS framework and platform, that is used in the development of BC Nexus Model,
is designed to explore interlinkages between and within climate, land (food), energy and water
systems. It is developed based on the United Nations’ (UN) sustainable development (SD)
concept; as a result, several aspects of the nexus concept are incorporated within the framework
[15]. CLEWS is an open-source modelling framework created to take advantage of existing well-
tested assessment methodologies for energy, water, land (agriculture) resources, combined with
climate data to form an integrated analysis. The tool is used and developed in partnership with
the United Nations Department of Economic and Social Affairs (UNDESA) and the United Nations
Development Programme (UNDP) to assess policies targeting UN sustainable development goals.
This makes the CLEWS a unique tool to enable policymakers to weigh their progress towards Paris
Agreement targets [15]. Today, several completed and ongoing projects use the CLEWS platform
to investigate various purposed policy questions within different special and temporal scales, and
between two and more resource interactions [4]. The CLEWS modelling platform's design and
structure are explained in more detail in the next section (Structure and Underlying Assumptions
section).

MODEL STRUCTURE AND METHODOLOGY
      This section starts with reviewing the design and structure of the CLEWS modelling platform
that was used in the development of the BC Nexus model. Then, it goes through the underlying
assumptions in establishing the linkages between BC CLEW systems and data used to calibrate

                                                                                         Page | 3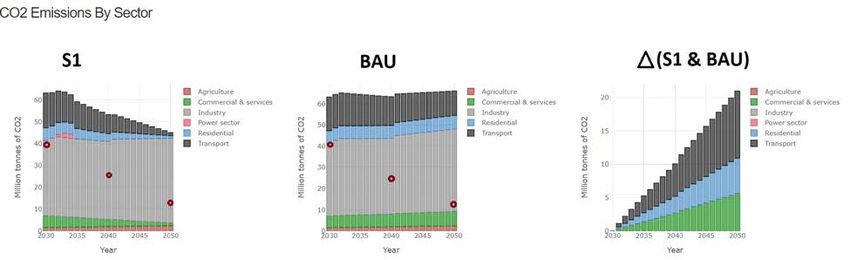
the model with the BC energy, water, land and climate portfolios, before moving through the
details of scenario development.

Structure and Underlying Assumptions
      The CLEWS Modelling framework is an extended version of OSeMOSYS (the Open Source
energy MOdelling SYStem) modelling framework [4]. OSeMOSYS is a bottom-up modelling
framework developed to provide long-term energy system cost optimization for the user-defined
regions. “The term ‘modelling framework’ in this context designates software that generates
specific models by populating them with user-defined data” [16]. OSeMOSYS is a linear program
capacity expansion model. It runs based on the exogenously provided demands portfolios, their
trajectory, policy and resource constraints; it delivers the optimized power generation
technology mix to meet the demand.

      The energy system in, "OSeMOSYS [ and hereditary CLEWS] is designed to be easily updated
and modified to suit the needs of a particular analysis. To provide this capability, the model is
developed in a series of component 'blocks' of functionality. A collection of the functional
component blocks combines to form a customized model" [17]. Each block contains a stand-alone
set of equations and variables that can be plugged into the model's core code to create specific
insights to the user-design inquiry [16]. Each block interacts with the user through three levels of
interface: a plain English description, an algebraic formulation, and then its code implementation.
This unique structure of the modelling framework makes the tool easy to use/learn and
accessible to a wide range of audiences. The method used in designing the structure of the
OSeMOSYS energy framework can be extended beyond the energy system to include other nexus
components. The same approach has been taken to embed the water, land-use, and climate
systems with the energy system in the CLEWS framework. Note that the CLEWS framework is
not inherently system-biased (meaning no system is center of focus through the basic design)
and users can tailor the analysis by defining the objective and context of each case study [4].

      The CLEWS modelling framework can be applied through the two different approaches of
soft-linking and hard-linking (integrated) between systems [18]. In the BC Nexus model, a fully

                                                                                           Page | 4
integrated approach is used to define and design the interlinkages between CLEW systems.
Within this approach, the WEF nexus system, and each systems’ interactions with climate, are
combined in a single model, allowing for efficient resource allocation and consistent price signals
across all sectors to choose the least-cost energy technology mix [18].

     The BC CLEWS model is made up of three major components of water, food, energy (WFE)
and their interactions with the BC climate data. Figure 1 illustrates the BC Nexus model
components and the affiliation of each system to the United Nations-defined SDGs. Currently,
the constraints and needs of the water and climate systems are only tracked in the model.

     Figure 1: BC Nexus model components and affiliation to the SDGs (after [19])

     In developing the model, the energy and land systems were designed and developed
individually, based on the BC data sources. Then, the linkages between pairs of systems were
defined for the model. For instance, the interactions of the water and energy systems were
defined by the amount of water needed in generating power from each energy resource as well
as the amount of energy that is required in activities such as water treatment facilities. Another
example is the relationship between the energy and land systems, defined by the amount of
energy required in agricultural activities (e.g., water pumping, running agricultural heavy trucks,
etc.) and vice versa, for instance, the amount of land use in meeting biofuel demands in the
                                                                                          Page | 5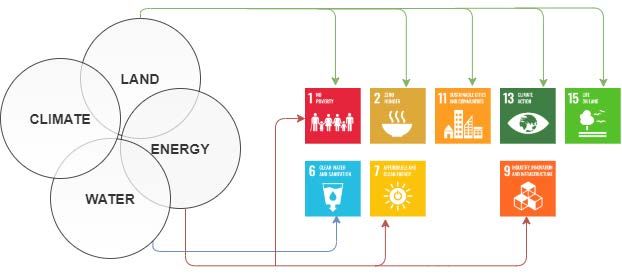
energy system. Later, the activity ratio of CO2 emissions produced from every activity (e.g., power
production from various energy sources) within and between systems was added to the model.

     The BC Nexus model, like other models developed in CLEWS and OseMOSYS, are policy
driven. When carrying out a scenario within a BC Nexus model, analysis proceeds within each
system based on the exogenous user-defined data. This phase includes assessing resource
availability, demand trends on energy, agriculture products and water, and policy constraints
within each system, this identifies the boundaries, drivers and pressure points for each system.
Then, each system’s interactions with the others can be evaluated to identify the trade-off and
synergies causing by each policy. Additionally, the model provides a least-cost technology mix
(optimization) to meet power demand during the modelling period along with total CO2eq
emissions emitted by the system.

Data
     BC Nexus model is a multi-disciplinary analysis tool and requires a wide range of data for
the energy, land (agriculture), water, and climate systems to calibrate the entire representation
for BC. As much as possible, most of the information (for instance, within the energy system)
was collected from BC Hydro, public datasets and other governmental sources. Only data sources
of reliable providence were utilized. On occasions reasonable technically qualified assumptions
were made to substitute missing or inaccurate data for the model. This section reviews the main
data included in the BC Nexus model and their references and assumptions.

   › ENERGY SYSTEM
     Data within the energy system was divided into two categories: the power system portfolio
and the demands for other types of fuels (imported and exported sources) within the province.
Note that there are about 150 active power projects in BC. The majority of them are IPP
(Independent power producer) projects, mainly very small to medium run-of-river stations. To
simplify the model structure, many of these projects were aggregated together and represented
as one larger power generation element within the model.

                                                                                          Page | 6
Aggregation of the hydropower projects has been done through careful investigation and
data analysis. Firstly, the largest generators (bigger than 5% of the total provincial hydro capacity)
were identified. Five large projects are recognized in this step. Due to the significant effect of
these larger generators on the power system, they are represented individually within the model
power system. The remaining hydro projects were investigated based on the region, capacity
size, capacity factor, and generation technology. Eight regions have been defined: Peace River
region, Northern BC region, Prince Rupert and Graham Island region, Prince George and Jasper
region, Vancouver Island region, Lower Mainland and Pemberton region, and Kamloops and
South East BC region. Unfortunately, not all data was available for every project. Consequently,
the hydro projects were merged to represent 12 larger generation boxes in the model. The same
process applies to natural gas and bioenergy power stations. However, for the variable renewable
power projects (wind and solar), due to their sensitivity to location and vary capacity factors, all
projects are represented individually within the model. Table 1 indicates the list of data gathered
to shape the energy system portfolio of BC.
Table 1: Main data used to calibrate the energy system for BC.
Collected data Data analysis and assumptions
Power System
- Capacity factor
Components (each - Location, capacity, nominal
- Efficiency
power generation annual generation, actual annual
- Residual capacity
stations) generation, operational life span
- Due to the lack of information generic
Cost - Capital, fixed, and variable costs
cost data assigned for each technology
- Generic technology cost info [20]
- Availability factors
Demand - Hourly production loads from BC
- Time slices (daily) and year split
hydro, and potential hourly load
(seasonal)
for wind and solar projects at each
- Specified annual demand for each time
specific site location [21]
slice
- Specified demand portfolio within each
time slice
- Specified power demand for each sector
(residential, commercial, industry,
transportation)
- Reference data was allocated
Other information - Transmission loss (10%) [22]
- Reserve margin (10.4%) [23]
Rest of the energy system
Page | 7- For non-electrical fuels that can be
Non-electrical fuels - Accumulated annual end-use fuel
stored, the demand projected on annual
demand [24]
basis rather than for each time slice
- Domestic fuel productions
- Import/export fuel supplies
- Assumption has been made to project
Cost - Fuel cost and annual forecast to
the fuel cost to 2050
2050
Linkages data: - Energy demand in agriculture
energy on land and (e.g. diesel used to run
water systems agricultural machineries) and
water systems (e.g. water
pumping, water treatment
facilities, etc.)
› TEMPORAL REPRESENTATION AND DEMAND FOR THE POWER SYSTEM
In the BC Nexus model, temporal representation is a user-defined option and can be
changed based on inquiry. This is especially important in the case of variable renewable power
sources such as solar and wind, where the production at different times of a year and site
locations are significantly different. For the version of the model reported in this document,
temporal resolutions are simplified to the four seasons per year (Spring, Summer, Fall and
Winter) and two day-splits of day and night to reduce computational complexity. Table 2 outlines
the temporal data structure used.
Table 2: Temporal data structure of the BC Nexus Model.
Spring (Mar 20- Summer (Jun 20- Fall (Sep 22-Dec Winter (Dec 21-
Jun19) Sep 21) 20) Mar19)
Day Night Day Night Day Night Day Night
Seasonal days 93.00 93.00 90.00 89.00
Ave. seasonal hrs. 13.90 10.10 15.36 8.64 10.00 14.00 8.75 15.25
Year split 0.15 0.11 0.16 0.09 0.10 0.14 0.09 0.15
Daylight time (start, end) 6 20 6 21 8 18 8 17
Based on the hourly electrical load of BC in 2019 and 2018, the demand profile
corresponding to the temporal structure of Table 2 is shown in Table 3. This represents the annual
fraction of the total power demand required for each time slice.
Page | 8Table 3: Electrical Demand Profile of BC.
Spring Summer Fall Winter
D N D N D N D N
Daylight time (start, end) 6 20 6 21 8 18 8 17
Specified Demand (%) 0.15 0.08 0.16 0.07 0.12 0.13 0.13 0.16
› LAND SYSTEM
Two main categories of data were collected to build the land-use representation of BC
Nexus Model: availability and allocation of land and existing land-used to meet current food and
energy demands. Table 4 summarizes the main data collected for the land portfolio of BC:
Table 4: Main data used to calibrate the land system for the BC Nexus Model.
Collected data Data analysis and assumptions
Type of land - Sizes of agriculture, forests, barren,
available in BC water body, and built-up lands in BC
- Future growth in land use for built-
Agriculture - Type of crops in BC per hectares
up and agricultural lands based on
- Annual demand for main crops growth
population growth and historical
in BC
trends
- Clustered data for crop yield (t/ha)
- Choosing 10 crops that covers
o crop-specific agro-climatic
more than 90% of agricultural lands
assessment
for clustering and analysis of future
o soil/terrain limitations
growth
o Water use (rained fed vs irrigated)
- Majority of the data collected using
o Agricultural intensity (low,
GAEZ model (Global Agro-
intermediate, high input level)
Ecological Zoning):
Linkages data: - Land needed for biofuel production
Land-use on
energy and water
systems
To reduce the computational complexity, gridded land data is clustered to establish areas
of similar crop suitability for the BC land system. Clustering organizes land with similar properties:
general agro-climatic indicators, crop-specific agro-climatic indicators, and water-limited and
soil/terrain limitations were combined as one group to reduce the computational complexity of
the modelling analysis in simulating large area data. The GEAZ model (Global Agro-Ecological
Zoning) was used to collect crop suitability estimation data for BC land. An agglomerative
hierarchical clustering method was then used to cluster lands (cell) with a similar achievable yield
Page | 9potential together. Figure 2 shows the clusters used for the BC Nexus Model, as well as the
attainable yield for two representative clusters.
Figure 2: BC crop attainable yield clusters based on similar irrigation and intensity combinations.
As shown on the left side graph of Figure 2, a total of seven clustered zones were defined
for BC. Each cluster indicates the area in which there is a similar possible crop yield due to similar
irrigation and intensity combinations. To match BC agricultural production, nine main crops that
represent 90% of the agricultural production in BC (namely alfalfa, barley, maize, oat, pea,
potato, rapeseed, rye, and wheat) are included. The remaining crops are lumped together into
an ‘other’ category to represent the full agricultural output of the province. On the right side of
the figure, crop suitability is compared for two clusters: 1 and 3. In these charts, each differently
coloured line represents a cell (a land unit) in BC. The vertical axis shows a combination of a crop
type, the water use (either rain-fed or irrigated), and the crop’s yield intensity level (high,
Page | 10intermediate, or low). The horizontal axis represents crop yield (tonnes per hectare). As reflected,
in cluster zone 1, most of the crops show zero to a low yield potential. This makes sense as the
cluster zone 1 mainly covers the mountainous regions of BC. Cluster zone 3, on the other hand,
represents a much more fertile area of BC.
› WATER AND CLIMATE SYSTEMS
Water and climate data only get tracking in the current version of the model. This means,
for instance, water availability in BC and change in demand for water in various sectors (e.g.,
power sector, public sector, agriculture based on the type of crop and yield, etc.) are only
monitored to assess the impacts of various policies on water (one-way interaction). In the case
of climate, the amount of CO2 emission for each activity within and between systems gets tracked
by the model. One of the important items of activity within the model is forestry. Forests can play
important role in climate change acts by absorbing CO2 from atmosphere. By assigning a negative
value of variable cost to the forest lands within the model area, the model includes the
reforestation consideration within its optimization analysis. However, at the time of preparing
this report, there is ambiguity around the role of Canadian/BC forests in absorbing CO2 from the
atmosphere in contrast with the amount they emit. Given this uncertainty, negative emission ro
forests were not included in the model at this time.
Scenarios
Three decarbonisation scenarios were investigated for BC between 2030 to 2050. The
scenarios were developed to investigate the synergies and trade-offs of the selected BC
decarbonization policies and actions and their impact on land and water resources. Another
scope of the investigation was to find out whether these policies and actions would allow BC to
meet its CO2 emission reduction targets. Two types of decarbonisation directions were explored
in BC. First, the governmental actions (policy acts) that target the alteration of energy supply and
demand portfolios such as electrification plans and improving energy efficiency standards to
cause GHG emission reduction. Second, market policies of carbon tax, cap-and-trade and clean
fuel standards that invoke economic driven action and emission reductions.
Page | 11The projection of demand in residential, commercial, industrial and transportation sectors
outlined in the Canada’s Energy Future report of 2019 [24] was selected as a reference scenario
(BAU-business as usual scenario). The reason behind this choice is a moderate approach with
regard to the projection towards decarbonisation of BC’s energy system, energy price and
technological improvement trends, as well as climate and energy policies. Figure 3 shows the
projection of the demand in the Business as Usual (BAU) scenario.
Total BC Energy Demand (PJ/ year)
Reference Scenario (BAU)
1600
1400
1200
1000
800
600
400
200
0
2019
2020
2021
2022
2023
2024
2025
2026
2027
2028
2029
2030
2031
2032
2033
2034
2035
2036
2037
2038
2039
2040
Electricity Natural Gas RPP Biofuels & Emerging Energy Other
Figure 3: BAU scenario- BC’s energy outlook (PJ/year) based on the 2019 Canada’s Energy Future report.
Based on the report, the total energy growth of 11% was estimated between 2019-2040,
breaking down into 29% growth in electricity demand, 39% growth in natural gas demand,
followed by 15% and 7% decline in demand for refined petroleum products (RPP) and biofuels
respectively. The demand was projected to 2040, and to match the modelling period, the demand
trends linearly extrapolated to 2050.
The demand growth trends in all sectors and WEF systems, allows the model to compute
an optimization analysis that finds the least-cost technology mix to meet the demand. The power
system's assessment centres around the residual energy capacity in BC, facility operating life
span, cost information, demand projection and policy directions. Considering the sensibility of
the interaction between the reserve margin value in the technology mix choices for power sector,
this scenario was run twice with and without a reserve margin value of 10.4% for comparison. As
Page | 12Figure 4 shows, without reserve margin, the model cost optimization analysis indicated that, in
addition to the current BC power capacity portfolio (site C included), the least cost energy option
to meet the demand between 2030 and 2050 is by investing in wind power. Importantly, by
adding the reserve margin requirement, the geothermal power generation is gradually adopted
as the least-cost baseload power generator when the hydro capacity becomes fully utilized
around 2040. Due to the importance of reserve margin in planning and managing the power
supply, it is included in all subsequent analysis scenarios.
Figure 4: BAU scenario – power generation capacity to meet the demand between 2030-2050 with and without
reserve margin value of 10.4%.
The first scenario (S1) investigates more aggressive electrification of the energy system
when compared to the BAU reference scenario. In this scenario, close examination of the energy
consumption by fuel type and applications was undertaken at the energy demand outlined in
Canada’s Energy Future projection. Within the residential and commercial sectors, the demand
for natural gas is often for space heating. An aggressive electrification approach was taken,
assuming 100% of this demand will be electrified by 2050, switching to heat pump technology
for space heating. The same aggressive approach has been taken within the transportation
sector, assuming all vehicles turn into 50% electrical passenger cars and 50% efficient electrical
transit vehicles. This assumption will not be far from the BC ZEV mandate outcome. In this
mandate, by 2040, all the new car sales should be electric cars. Considering the common shelf
life of gas cars, it is reasonable to assume that in 10 years, almost all vehicles shift to the electrical
options. To project the new demand trend for S1, we linearly reduced gasoline and diesel demand
within the transportation sector from 2030 value to zero in 2050. The new electricity demand is
Page | 13calculated accordingly. Note that the transition will not be a joule by joule substitution for the
higher efficiency of the electrical heating technologies (heat pumps, insulation, etc.) must be
accurately represented. The industry sector demand remains untouched, except the additional
three-terawatt hour LNG power agreement signed by BC Hydro in 2014 will be added to the
sector's electricity demand. The LNG agreement allows LNG Canada access to electricity from BC
Hydro for the power needed for its proposed liquefied natural gas (LNG) export from the Kitimat
facility. The project will be online after 2024.
The next scenario (S2) adds the BC carbon tax policy to explore its effect on the technology
mix. Currently, the BC carbon tax is $40 per tonnes of CO2eq emissions and is expected to
increase to $50/tCO2eq by 2022 to meet the federal backstop carbon tax. Note that due to the
Coronavirus pandemic, the increase paused for one year or until further notice. Due to the
uncertainty in the BC carbon tax trend after 2022, we projected the carbon tax increase based
on the federal backstop value of $15 per year to meet the minimum requirement for BC, as shown
in Figure 5.
Carbon tax growth trend
500
400
300
200
100
0
Figure 5: S2 – BC carbon tax prediction based on federal policy.
Page | 14Table 5 summarizes the different scenarios assessed in this report.
Table 5: The summary of the scenario’s directions and assumptions
Scenario Direction Assumptions
Reference Based on Canada’s Energy Future - slow total energy use growth of 11% to 2040 in BC
scenario projection of 2019
Canada wide:
(BAU)
- Population growth of 20%
- GDP growth of 40% (leading to reduction in
energy use per person and per dollar of economic
activity)
- 50% and 30% growth in crude oil and natural gas
respectively.
Scenario Reference scenario (BAU) + more - 100% transition from natural gas in residential and
1 (S1) aggressive electrification without commercial sectors
carbon tax
- 100% transition to electric vehicles
Scenario Reference scenario (BAU) + more - Additional 3 Terawatt hr. electricity demand in the
1 (S2) aggressive electrification with industry sector due to LNG sector
carbon tax
MODELLING RESULTS AND ANALYSIS
This section reviews the main results of the investigation on the selected scenarios
explained in previous section (BAU, S1, S2).
Reference Scenario (BAU)
Figure 6 illustrates the main results of the assessment on the energy system in the BAU
scenario. In row one, the “gross final energy consumption” graph projected the BC energy
demand between 2030 and 2050. Based on the reference scenario in the Canada Energy Future
report (2019), issued by the government of Canada, the demand for the natural gas remains high
throughout the scenario, followed by electricity. The “power generation capacity” graph
indicates that the least-cost technology mix to meet the power demand is the combination of
hydro power, wind, geothermal and biomass. A close look at the capital investment graph
highlights that on top of the current BC power portfolio, the model cost optimization analysis
leads to a huge investment into wind power till 2040 to increase the share of this energy from
Page | 150.7 GW currently to 8 GW (~7 times more than Site C) in 2050. The model also indicates the need
for the investment in natural gas; however, the comparison between the power generation
capacity graph, the power generation graph and the power generation by time slice graph
indicates that the model uses natural gas as a stand-by option to cover a fraction of the required
reserve margin.
Figure 6: BAU scenario results- Energy system assessment
Page | 16After 2040, the result shows the investment in development of 1GW capacity of
geothermal energy and small (0.14 GW) capacity of natural gas by 2050. It is noteworthy that Site
C is included in the portrayal of residual capacity in the model. Currently, hydro power generates
about 90% of the BC power supply and Site C (1.1 GW) is expected to be completed in 2025.
However, in less than 10 years, in 2030, hydropower generation will not be sufficient to meet the
gap between energy demand and supply, even in the most modest power growth scenario
explored in this investigation. In this scenario, the share of hydropower within the BC power
supply reduces to about 65% of the total generated.
Scenario 1 (S1): Aggressive electrification
S1 scenario investigates the impact of more aggressive electrification within residential,
commercial and transportation sectors by 2050. As previously mentioned, in this scenario, the
natural gas used in space heating is substituted with electrical heat pumps and insulation
strategies. The same aggressive approach has been taken within the transportation sector,
assuming all vehicles turn into 50% electrical passenger cars and 50% efficient electrical transit.
The higher efficiency of electrical cars and heat pumps when employed to replace traditional gas-
powered cars and natural gas furnaces, the transition reduces the total end-use energy demand.
Figure 7 compares the change in the gross energy consumption in BAU and S1 scenarios. The
chart at the right bottom of the graph shows how electrification of space heating in residential
sectors reduced the total energy demand in this sector. For more information on the logical steps
taken to convert the value of reduced fossil fuel demands within each sector and added to the
electricity demand after electrification action, please see Appendix A.
Page | 17Figure 7: Comparing BAU and S1 scenarios- final energy consumption.
Figure 8 compares the change in demand portfolio in Scenario BAU and S1. As shown on
the right graph representing the differences, about 300 PJ of fossil fuels can be substituted with
almost 70 PJ of electricity.
Figure 8- BAU vs. S1 scenario results- gross energy consumption by fuel.
Another important result comparing BAU and S1 scenarios was how the increase in
electricity demand reduced the wind power share in the power generation capacity portfolio, as
shown in Figure 9. In the capacity graph of Figure 9 one can see that increased natural gas and
geothermal generation are used to meet the increased demands and reserve margin, while in
the power generation graph, before 2035, natural gas is no longer needed for stand-by capacity.
Page | 18When the hydropower capacity is fully utilized by 2033 to serve as baseload power source, some
natural gas generation is installed to meet the reserve margin. However, this installed natural
gas generation does not persist and is quickly replaced by geothermal in 2036.
Figure 9: BAU vs. S1 scenario results- power system technology mix and generation details.
This shift in the share of the technology mix can be explained by the 10.4% reserve margin
requirement. The variable energy sources, wind and solar, cannot provide reserve margin
capacity. Thus, when the hydropower capacity becomes fully utilized in 2031, the model starts
deploying and investing in other baseload options available in the region. In the case of BC, the
options are geothermal power, more hydropower generation, and natural gas, and between
these options, the least-cost pathway is the combination of natural gas and geothermal power,
as shown in Figure 10.
Page | 19Figure 10: S1 vs BAU- Change in sectoral electrification.
Figure 11 compares the installed generation mix of the current system in 2019, the BAU
2050 projection and the S1 2050 projection.
Figure 11: Installed generation mix for BC: 2019 status quo vs. 2050 BAU and 2050 S1.
Scenario 2 (S2): Aggressive electrification plus carbon tax
Scenario S2 uses the same demand portfolio as S1, along with adding a carbon tax to the
optimization. Putting a penalty on carbon emissions encourages the model to reduce its
dependence on fossil fuel options. Note that in 2050, the generation capacity in S2 is similar to
S1. However, as shown in Figure 12, the natural gas generation is not used but acts as standby to
meet the reserve margin (Figure 12, rows 2 and 3). Geothermal capacity is built earlier (starting
in 2031) to replace natural gas generation (compared to 2034 in S1).
Page | 20Figure 12: S2 vs. S1-Investigating the effect of carbon tax on the energy system.
Land and water use
Figure 13 compares the effect of electrification and technology choice on land and water
use according to S1 and BAU scenarios. Since the biomass power generation is decreasing in all
scenarios, as well as the demand for biofuel from agricultural products in both scenarios (as well
as S2), the power system change did not affect the agricultural land. The reason is, in BC, most of
the biomass comes from forest (wood-products) and the future reports indicates the biofuel
Page | 21industry moves towards non-agricultural biomass sources such as animal manure, food waste, as
well as municipal waste streams, and algae in future [25]. Note that the land-use effect by non-
biomass power generation activities is under development and has not yet been fully embedded
within the model. Considering the huge impact of variable renewables (such as wind and solar
farms) on land, including this option can bring significant insights into the technology mix options
and a full assessment of decarbonization policies.
The third row of Figure 13 indicates the increase in the demand for water within the power
sector. A closer look within the power generation details (Figure 9, row 2) shows the use of
natural gas between 2031 and 2033 (the sudden increase in Figure 14 of the same year), as well
as a gradual increase in the geothermal power generation, which match the gradual increase in
water demand. By adding the carbon tax to the equation in S2, the increase in water demand
related to natural gas production has disappeared.
Page | 22Figure 13: Land and water use- comparison between S1 and BAU scenario.
CO2 emission targets
The model also shows the shifts in emissions as different energy strategies are employed.
BC.’s legislated emission targets for 2030, 2040 and 2050 of 40% (≈ 40 Million tonnes of CO2),
60% (≈ 25 Million tonnes of CO2) and 80% (≈ 12 Million tonnes of CO2) below 2007 (= 64.76 Million
tonnes of CO2) levels, respectively. Figure 14 highlights these targets, annotated with dark red
circles. As shown, despite aggressive electrification within residential, commercial, and
transportation sectors, without considerable change within the demand portfolio of the industry
Page | 23sector, BC will not be able to meet the legislated targets. Meeting the provincial CO2 emission
reduction targets can only be met if industry cuts emissions by half by 2040 and another half by
2050. Policies, such as carbon pricing and cap-and-trade approaches by setting a limit on
pollution and creating a market, cause the deeper actions and faster transitions within the
industry sector. Due to the complexity of the industry sector energy demand, further careful
investigation is needed to identify proper substitutions for the fossil fuel demand within this
sector. Such investigation is part of our team’s future scope. In scenario 2, adding carbon tax to
the model constraints triggered a minor emission reduction between 2032 and 2034, as a result
of eliminating natural gas from the power system generation during that period. This is consistent
with the fact that currently 95% of the BC power system (not energy system) is generated from
clean, renewable sources.
Figure 14: CO 2 emission reduction in S1 and BAU scenarios.
DISCUSSION
This section discusses the usability of the BC Nexus model for policy design and integration
in the national modelling platform, along with the current status of the model and future works.
The challenges with accessibility and availability of data in the nexus modelling are also discussed.
Accessibility and Transparency
Accessibility and transparency of modelling in the CLEWS platform was one of our
motivations in choosing it. CLEWS platform is an open-source model which does not require big
time investments to build and operate, making it suitable for people with various background to
Page | 24use it. To align with this open source philosophy at the heart of CLEWs, we will be releasing the
model on GitHub free and open source, as well as open data, once the model reaches maturity
and passes validation testing.
Usability for Policy Design and integration in a national modelling platform
To combat climate change, one of the significant challenges that policymakers are facing is
to manage and optimize (where possible) competing economic and resource management
priorities and trade-offs. As fossil fuels are responsible for emitting a large share of GHGs,
decarbonisation of the energy system is at the core of most climate policies. Recent modelling
practices (e.g. [2], [5], [6], [26]) show that a failure to consider the impact of energy transition
policies on land and water resources can increase uncertainties and risks in meeting subnational
climate targets, as well as affecting electricity costs and technology choices. The review (e.g. [27]–
[29]) of the current energy system models and their capabilities in representing the nexus
concept also indicates that these inadequacies in energy system modelling may mislead policy
decisions and, consequently, the flow of investment into new technologies and future power
capacity plans. While intersectoral interaction between energy economy, capacity expansion and
power system models are getting more attention, the cross-disciplinary interactions of energy
domain with factors such as water, food and natural securities remain relatively
underrepresented in existing energy models. The BC Nexus model, upon completion, will be
better equipped to assist BC policymakers and provide a more accurate picture of climate change
actions. The result of two change-based scenarios, S1 and S2, shows that how changing in the
demand portfolio shifts the technology mix and the share of each energy source to meet the
demand. The impacts of this large shift to wind and geothermal on land use is beyond the scope
of the current modelling work but is included on the development path of the BC Nexus Model.
Analyzing decarbonisation policies with the BC Nexus model to reveal the impacts and
interactions of energy, water and land system not only prevents unintentional trade-offs, but
also facilitates coordinating action between governments and private sector stakeholders. This
is vital for cost effective, action where the timeline for mistakes has no margin of error. This
Page | 25makes the BC Nexus model a unique tool; integrating it in the national modelling platform could
provide broader insights in assessing the decarbonisation policies and directions, as well as
progress towards sustainable development goals.
Current Status and Envisioned Future Work
The BC nexus model outlined in this report is part of a larger and longer research modelling
endeavour designed to tackle the gaps in representing the nexus concept within the modelling
paradigm to support effective policy development. This particular project aims to expand the
local and regional representation of the nexus within Canada CLEWS, since climate and
geography have a tremendous influence on supply and demand synergies, which in turn impacts
the effectiveness of policies, their costs and trade-offs. Water and land systems are the most
sensitive to the level of spatial resolutions. Current results show the importance of incorporating
these trade-offs into the modelling paradigm.
Two major directions are envisioned for future work. The first will address the gaps within
the CLEWS modelling platform in representing the energy transition. Incorporating grid flexibility
and reliability considerations with a high penetration of intermittent renewable resources. This
is achieved by increasing the temporal and special resolution, as well as provisioning energy
storage representation within the BC Nexus model. Incorporating operational and installed
capacity limits on various technologies will also enhance the energy system representation. The
second direction focuses on gaps in the representation of the cross-disciplinary linkages required
by the nexus representation within the model. Some of these gaps include health impacts,
natural security (e.g., biodiversity), individual well-being and cultural values. It also considers
missing linkages within water and land systems, such as a better representation of land use
related to energy system impacts, the impact of changes in water and land systems on climate
and economy, and a closer look at the role of forestry in BC with respect to CO2 emissions.
Finally, further scenarios and sensitivity analysis will be performed to identify the impacts
of a variety of input parameters including, but not limited to, varying carbon tax levels, varying
costs parameters and varying resource options to identify synergies and trade-offs. Once fully
Page | 26developed, the model will be available and accessible for free on GitHub with all used data and
calculations.
CONCLUSION
This report presents the results and progress made in the development of the BC Nexus
model. The model is developed to provide insights to BC policymakers about the underlying
linkages and relationships among energy, water, food and climate systems in response to the
challenge that provincial and municipalities worldwide face in tracking their progress towards
the United Nations Sustainable Development Goals (SDGs). The nexus approach used in the
design and development of the model allows policymakers to better recognize solutions for low-
carbon energy systems and, in turn, provision economies that achieve United Nations SD goals.
The key conclusion from the scenarios examined in this report are:
• Due to the low solar irradiance recorded in the only solar power project in BC, the
model did not choose further investment in the solar generation capacity in any of
the scenarios despite the low development cost.
• The aggressive electrification examined in the S1 scenario highlights the significant
role that the baseload energy options (such as geothermal, hydropower, and
natural gas) are playing in the power grid's stability with a large amount of variable
renewable energy sources.
• Despite the aggressive electrification in the residential, commercial, and
transportation sectors, the results of S1 and S2 scenarios indicate that meeting the
provincial CO2 emission reduction targets can only be met if the industry sector cuts
emissions by half by 2040 another half by 2050.
• The results of the S2 scenario did suggest that policies such as carbon tax and cap-
and-trade approaches by setting a limit on pollution and creating a market can
change the timeline and direction of investment in the energy technology mix.
Page | 27ACKNOWLEDGEMENTS
The research and the development of the BC CLEWS model would not have been possible
without the exceptional support from the following people and institutes. We thank Energy
Modelling Initiative (EMI) for providing the financial support for this research. Kamaria Kuling, a
master’s student from the SFU School of Sustainable Energy Engineering, for sharing the data on
carbon emission activity ratio created for her master’s project. Scott Andrews and Taryn Chang,
students at the SFU School of Sustainable Energy Engineering, for their work in 2020 on
documenting the BC power plant generation portfolio and energy demand portfolio. Mikhail
Linsangan, a student at the SFU School of Sustainable Energy Engineering, for his assistance on
background research for the report.
We would like to show our gratitude to the Jeremy Benson of Planning, Licensing
Generation Resource Management Manager at BC Hydro, for serving as industrial liaison advisory
members on the project. We are also immensely grateful to Abishek Shivakumar and the other
members of the CLEWS Cloud team for behind-the-scenes technological support on the CLEWS
platform. Finally, we thank our colleagues form ∆E+ Research Group at SFU who provided insight
and expertise that greatly assisted the project.
Page | 28References
[1] Z. Khan, P. Linares, and J. García-González, “Integrating water and energy models for policy
driven applications. A review of contemporary work and recommendations for future
developments,” Renewable and Sustainable Energy Reviews, vol. 67. Elsevier Ltd, pp. 1123–
1138, Jan. 01, 2017, doi: 10.1016/j.rser.2016.08.043.
[2] G. C. Wu et al., “Low-impact land use pathways to deep decarbonization of electricity,”
Environmental Research Letters, vol. 15, no. 7, p. 074044, Jul. 2020, doi: 10.1088/1748-
9326/ab87d1.
[3] “CLEWS - Home.” http://www.osimosys.org/ (accessed Jun. 11, 2020).
[4] E. P. Ramos et al., “The Climate, Land, Energy, and Water systems (CLEWs) framework: a
retrospective of activities and advances to 2019,” Environmental Research Letters, vol. 16,
no. 3, p. 33003, Dec. 2020, doi: 10.1088/1748-9326/abd34f.
[5] Z. Khan et al., “Integrated energy-water-land nexus planning to guide national policy: an
example from Uruguay,” Environ. Res. Lett, vol. 15, p. 94014, 2020, doi: 10.1088/1748-
9326/ab9389.
[6] T. Lowry and J. Arnold, “Climate and Energy-Water-Land System Interactions.”
[7] S. Hosseini, K. Barker, and J. E. Ramirez-Marquez, “A review of definitions and measures of
system resilience,” Reliability Engineering and System Safety, vol. 145, pp. 47–61, Jan. 2016,
doi: 10.1016/j.ress.2015.08.006.
[8] C. S. Laspidou, D. T. Kofinas, N. K. Mellios, and M. Witmer, “Modelling the Water-Energy-
Food-Land Use-Climate Nexus: The Nexus Tree Approach,” Proceedings, vol. 2, no. 11, p.
617, Aug. 2018, doi: 10.3390/proceedings2110617.
[9] F. Brouwer et al., “Energy modelling and the Nexus concept,” Energy Strategy Reviews, vol.
19, pp. 1–6, Jan. 2018, doi: 10.1016/j.esr.2017.10.005.
[10] T. Niet, N. Arianpoo, K. Kuling, and A. S. Wright, “Increasing the Reliability of Energy System
Scenarios with Integrated Modelling: A Review,” SFU Delta-E+ Lab, Surrey, BC, 872-2019–
1009, Mar. 2021.
[11] V. Diakov, W. Cole, P. Sullivan, G. Brinkman, and R. Margolis, “Improving Power System
Modeling: A Tool to Link Capacity Expansion and Production Cost Models,” 2015.
[12] J. P. Deane, A. Chiodi, M. Gargiulo, and B. P. Ó Gallachóir, “Soft-linking of a power systems
model to an energy systems model,” Energy, vol. 42, no. 1, pp. 303–312, 2012, doi:
10.1016/j.energy.2012.03.052.
[13] J. Despres, “Development of a dispatch model of the European power system for coupling
with a long-term foresight energy model,” 2015.
Page | 29You can also read