Livingstone's 5 Year Housing Demand Analysis - EMAIL
←
→
Page content transcription
If your browser does not render page correctly, please read the page content below
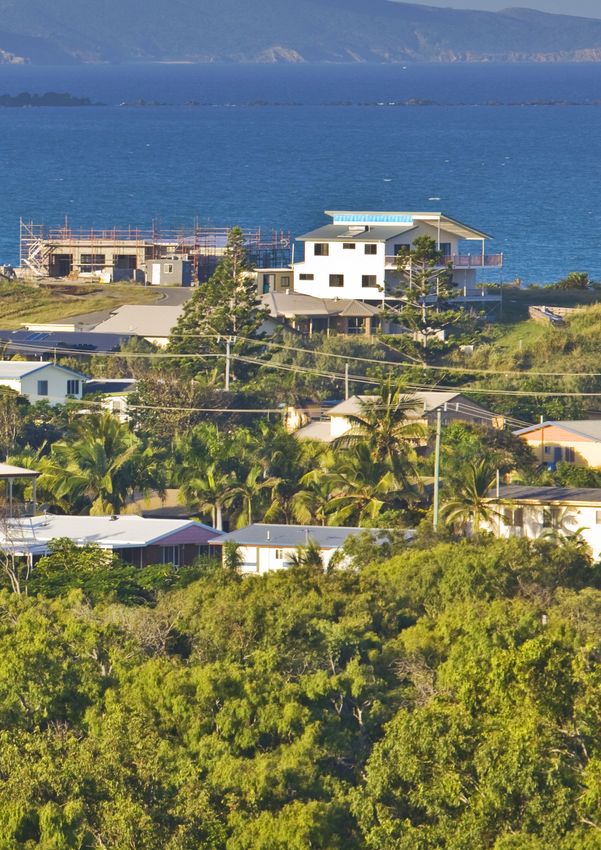
Livingstone’s
5 Year Housing
Demand Analysis
EMAIL: economicdevelopment@livingstone.qld.gov.au
PHONE: (07) 4913 5000
Livingstone’s 5 Year Housing Demand Analysis
1. Executive Summary
………………………………………………….
Livingstone Shire’s housing market is in the recovery phase of the property cycle. It
doesn’t have enough approved dwelling product readily available to develop and as a
result the new housing market is undersupplied, resulting in rising housing prices and
escalating rents.
Over the next five years there is need to build 330 new dwellings per annum. This new
housing supply will need to appeal to empty nesters downsizing or retiring, plus people
in retirement/age-care facilities and also younger renters.
A range of housing products will be needed. Much of this new housing stock will fit
between a small apartment in a large complex and the traditional detached home. The
‘missing middle’ as it is often labelled these days.
Our work suggests that this new dwelling demand will be shaped along these lines:
Livingstone Shire: Forecast housing demand by dwelling type
Annual housing demand
Dwelling type Number Distribution
Traditional detached houses 30 9%
Small lot homes 70 21%
Dual occupancy or backyard housing 75 23%
Townhouses, terrace or villas 60 18%
Small scale, infill apartment projects 45 14%
Large apartment complexes 10 3%
Age-relate care 40 12%
Total 330 100%
Given past local market trends, plus a variety of pertinent parameters outlined in the
report, considerable effort will be needed to diversify Livingstone Shire’s future housing
mix.
Page 1 of 61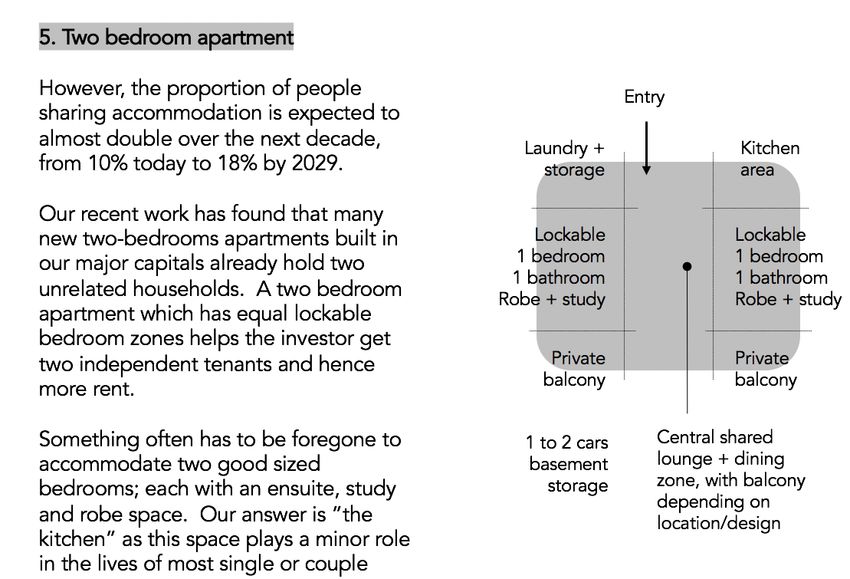
Livingstone’s 5 Year Housing Demand Analysis
2. Report layout
………………………………………………….
This report has been laid out in eight sections:
1. Executive summary
2. Report layout
3. Scope of works + background
4. Recommendations
5. Key findings
6. Supporting information:
1) Demographics
2) Future housing demand
3) Housing demographics
4) Housing tenure + buyer origins
5) Other relevant statistics
6) Visitor statistics
7) Macro residential development trends
8) More detailed residential development trends
9) Housing market overview
10) Rental market
11) Detached housing market
12) Medium density market
13) Vacant land market
14) Local storage facilities
15) A wider view
7. Appendices
8. Background information
Relevant study areas
Livingstone Shire Council.
Various other local authority areas across regional Queensland.
SLA2 areas including Emu Park; Glenlee-Rockyview; Rockhampton East; Rockhampton
North; Shoalwater Bay and Yeppoon.
Postcodes 4703 and 4710.
Page 2 of 61
Livingstone’s 5 Year Housing Demand Analysis
   3. Scope of works + background
   ………………………………………………….

   1) Scope of works

   Matusik Property Insights has been commissioned by Livingstone Shire Council to
   undertake a housing demand study to enable the Council and local industry partners to
   address current supply issues as well as expanding the diversity of product options in the
   future.

   There are five parts to this study:

   1. Evaluate market dynamics and recommend market sectors to focus on over the next
      five years to meet current and emerging residential demand. This includes identifying
      potential need by dwelling type between 2021 and 2026.

   2. Advise whether there is a viable market for offsite storage of outdoor recreation assets
      (boats and caravans) to support small lot subdivisions and higher density living. If there
      is a market, what is the potential scale of this market?

   3. Identify any substantive barriers to entry; any substantial impediments to the
      development industry’s ability to respond to the findings of this evaluation, existing or
      anticipated. These may include Local and State Government, private sector, finance
      industry, suppliers and workforce, amongst others.

   4. Note any pertinent observations or recommendations relative to streamlining the
      process of achieving development (private and public responsibilities) to accelerate
      supply and reduce transactional costs.

   5. Conduct briefing sessions at the conclusion of the project addressing members of the
      Livingstone Shire Council and local industry representatives to communicate findings
      and to provide clear guidance on implications for future industry action.

   This report details our findings and recommendations in relation to items 1 to 4 above. The
   briefing sessions as outlined in item 5 will be undertaken subsequent to the delivery of this
   report.

                                                                                    Page 3 of 61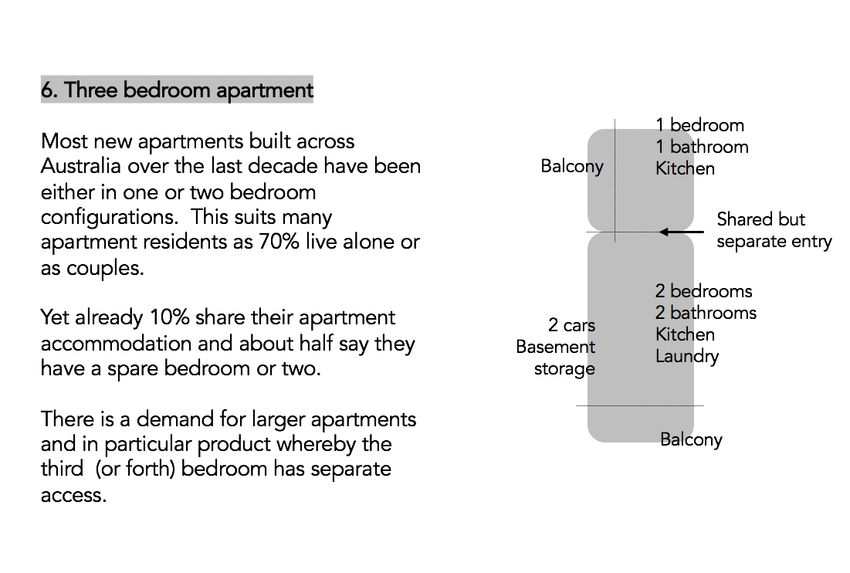
Livingstone’s 5 Year Housing Demand Analysis
   As part of the work undertaken for items 3 and 4 a meeting was held with Council staff in
   Yeppoon on 19 November 2020 and two information sessions with key development
   industry stakeholders were held in Yeppoon on 20 November 2020.

   Telephone conversations were subsequently held with a number of stakeholders who were
   unable to attend in person on 20 November 2020.

   2) Background

   Livingstone Shire covers approximately 11,776 square kilometres of Central Queensland
   and has a current population of around 38,000 people. The population of neighbouring
   Rockhampton Regional Council is approximately 82,000 people.

   More than half of the Shire's population lives in the coastal strip between Yeppoon and
   Emu Park known as the Capricorn Coast, which offers an idyllic seaside lifestyle and easy
   access to the southern section of the Great Barrier Reef.

   The Capricorn Coast continues to grow as the dormitory for expanding industrial,
   academic, commercial and administrative development in and around Rockhampton.
   Many professionals from Rockhampton reside on the Capricorn Coast as a precursor to
   retirement.

   The Capricorn Coast is evolving as the lifestyle precinct of Rockhampton, just as Ballina and
   Byron Bay are the lifestyle suburbs of Lismore.

   The lifestyle in regional areas is increasingly becoming more cosmopolitan, with people
   living in one town, working elsewhere, and shopping or seeking entertainment in another.
   This is indeed occurring along the Capricorn Coast and in particular, its largest town,
   Yeppoon, which has a range of major services as well as proximity to Rockhampton with its
   domestic airport and high-speed train links to Brisbane.

                                                                                   Page 4 of 61
Livingstone’s 5 Year Housing Demand Analysis
4. Recommendations
………………………………………………….
What does the future hold?
Our work suggests that demographics play a vital role in shaping future housing demand.
1) Future demographic shape
If that is true, what does Livingstone Shire’s demographic shape look like over the next five
years (2021 to 2026).
The table below (same as table 10 in the report) shows that four key lifecycle buyer
segments are likely to be the most active when it comes to housing demand across
Livingstone Shire over the next five years.
Livingstone Shire: Forecast housing demand by lifecycle buyer segmentation
Lifecycle buyer segment Annual Average Annual housing demand
growth next household
five years size Number Distribution
Young renters 81 2.35 35 10%
First home buyers 14 2.71 5 2%
Families 20 3.25 5 2%
Downsizers 127 2.26 55 16%
Retirees 334 1.88 180 55%
Aged 77 1.57 50 15%
Total 650 330 100%
Key market segments
Most aging baby boomers look to downsize/retire in their local area or in another
location (often in near the sea) that they have visited or are familiar with. But most are
not that interested in trading in their detached home for a much tighter apartment. A
‘middle ground’ product is really wanted. Better still, is one which can accommodate a
relative, grandchildren, visitors, a tenant and in due course, a live-in carer.
Young renters often look to live closer to the action in small digs, yet many look to
share accommodation to help meet housing costs and live their preferred ‘tribal’
lifestyle. Rental accommodation targeting this segment needs to facilitate sharing.
We define aged persons as those aged over 79 years. These people are often in need of
health-related care and housing that supports this demand. This can be supplied by
purpose built accommodation or via the building of the appropriate housing – either as
dual-occupancy or backyard housing solutions – as part of their families (or friends)
principal place of residence.
Page 5 of 61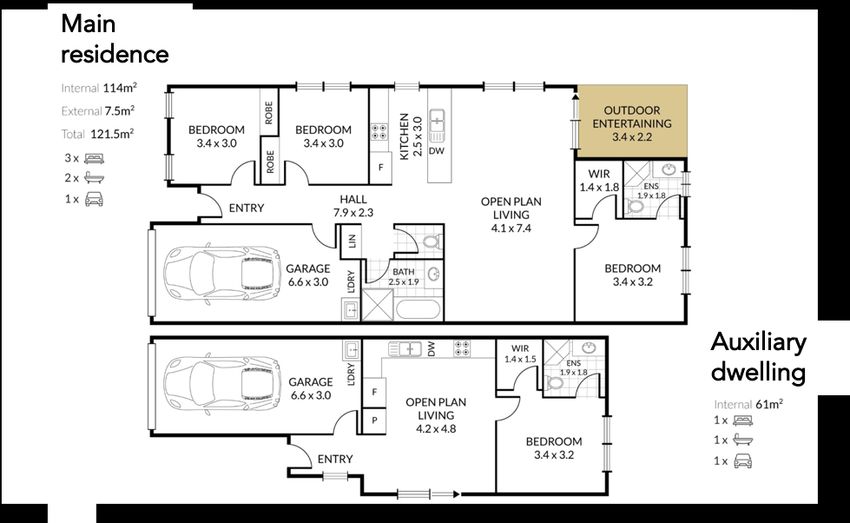
Livingstone’s 5 Year Housing Demand Analysis
   2) Future housing demand

   Our modelling suggests that over the next five years more housing that fits between a
   small apartment in a largest complex and a traditional detached home will be needed.

   This housing is often, these days, described as the ‘missing middle’.

   See the table (being table 12 from this report) below for more detail.

   Livingstone Shire: Forecast housing demand by dwelling type
                                           Annual housing demand
    Dwelling type                          Number              Distribution
    Traditional detached houses            30                  9%
    Small lot homes                        70                  21%
    Dual occupancy or backyard housing     75                  23%
    Townhouses, terrace or villas          60                  18%
    Small scale, infill apartment projects 45                  14%
    Large apartment complexes              10                  3%
    Age-relate care                        40                  12%
    Total                                  330                 100%

   Breaking this demand down further, our work suggests that the demand for housing that
   caters for sharing is very high – up to 20% - over the next five years. At present, less than
   5% of regional Queensland’s existing housing stock successfully caters to this market.

                                                                                      Page 6 of 61
Livingstone’s 5 Year Housing Demand Analysis
   3) Dual-occupancy housing

   Looking forward, many Australians will be forced to compromise on their housing.

   The local area trends and parameters – as outlined in this report – suggest that this is
   starting to happen across many parts of Livingstone Shire and especially along the coastal
   strip.

   To that end, dual-occupancy property is looking more promising rather traditional
   housing. This applies to owner residents as well as investors.

   And we believe it is the appropriate place to start increasing the housing mix diversity and
   development densities (based on people per hectare not dwellings per hectare) across
   Livingstone Shire.

   Typical example
   Dual-occupancy detached house

                                                                                    Page 7 of 61
Livingstone’s 5 Year Housing Demand Analysis
For investors, dual-occupancy product already shows a much higher return than most
other housing types. More people are sharing accommodation and a key to getting a
better rental yield is to hold property that facilitates sharing. Two sources of rental
income are often better than one.
Such property also has strong owner-resident appeal. Dual-occupancy dwellings
appeal to multi-generational households and is one which better helps accommodate
visiting friends and relatives (either free or paying via a bed ‘n’ breakfast online booking
service) and assist with looking after aging townsfolk or people in need of health-
related assistance.
Appendix 2 provides more potential dual-occupancy housing design formats.
4) Small lot homes
Consideration should be given to including more allotments between 450 and 600 square
metres in size in those land developments within close proximity to Yeppoon and Emu
Park.
These allotments need to offer wide frontages and shaped to ensure room in the rear yard
for a shed and/or large garage. The design of the estate to include rear lane access to these
smaller allotments works well and allows for a better streetscape plus the provision of a
large garage or shed at the rear of the block.
Such development is best ‘offset’, being positioned adjacent to estate parkland or
community facilities. Depending on location and how they look, these smaller allotments
can be either supplied in select zones (better allowing for the provision of rear lanes) or ‘salt
n peppered’ throughout the estate. Our preference it to zone these smaller allotments in a
regional setting like Livingstone Shire.
The development community should give more consideration to supplying such stock as
turn-key house and land package solutions.
Smaller allotments can also hold dual-occupancy houses and quite successfully if planned
for well in advance and positioned on select allotments within an estate.
Page 8 of 61Livingstone’s 5 Year Housing Demand Analysis
5) Townhouses, terraces or villas
To date there is limited new supply of townhouse, terrace or villa housing stock across
Livingstone Shire. This we find somewhat amazing given the local demographics and how
the town is actually used by many residents and visiting friends and relatives.
Townhouses etc. are a very good compromise between a detached house and an
apartment. They provide owners with a ‘nexus to the ground’; their own secure carparking
with direct ingress and egress to their home proper plus allows for plenty of passive
surveillance, increasing the perception of security.
One stumbling block is being part of a body corporate and paying the annual levies and
enduring the associated ‘local’ politics that’s often involved. To that end consideration
should be given to providing townhouse dwellings on freehold title. This has been done
successfully in the past in south east Queensland and especially interstate.
Appendix 2 includes a townhouse solution which helps accommodate two independent
households and this design direction could appeal in infill positions in close proximity to
both Emu Park and Yeppoon town centres.
Past work has also shown that the provision of secure onsite storage as part of the
townhouse development works well. Several developments on the Sunshine Coast, that
we have provided project advice on, supplied hardstand areas for boats, caravans and
larger SUVs within the estate, in addition to lockage storage which formed part of the
‘men’s shed’ amenity. Owners pay a fee to access such facilities and preference is given to
owner residents and tenants over investors hoarding their belongings.
Overall, townhouse or similar development makes sense and should be in increasing
demand along the Capricorn Coast and especially around its coastal major towns.
Page 9 of 61Livingstone’s 5 Year Housing Demand Analysis
6) Small scale, infill apartment projects
There is an underlying demand for apartments in small infill projects that target downsizing
and/or retiring owner residents. This product also has a strong appeal to young renters
looking to share accommodation.
These projects need to be small in scale, being lifted developments with a small floorplate;
limited number of overall apartments and generous carparking plus basement storage
options. Parking is best supplied at grade and money is better spent on apartment quality
rather than onsite facilities.
Similar to townhouse redevelopment, such apartment infill development makes sense and
should also be in increasing demand along the Capricorn Coast and especially around its
coastal village centres.
Appendix 2 also supplies two apartment design solutions which helps accommodate two
independent households and/or better allows owner residents host friends and relatives
including grandchildren.
7) Aged-related care
There is an increasingly demand for aged-related care across Livingstone Shire. As noted
above this can be supplied by purpose built accommodation or via the provision of a range
of dual-occupancy housing solutions including detached housing and backyard homes and
in townhouses and apartments with the appropriate designs and requirements.
When it comes to purpose built retirement (and aged-related care) accommodation
solutions, Halcyon Communities is a worth a closer look.
They operate under the Manufactured Homes (Residential Parks) Act 2003.
The Halcyon model allows home owners to buy a new architect-designed home in a gated,
master-planned community, free up capital from their existing home, and join a community
of like-minded people.
A Halcyon lifestyle community is all about fun, friends, freedom, fitness and financial
security with 5-Star resort-style facilities.
With no stamp duty, no exit fees, a strict policy of no rentals and an active community full
of owner-occupiers, Halcyon has proved extremely popular with purchasers looking to live
in modern day retirement village.
Halcyon’s financial model is based on one simple site fee to cover all aspects of the
management and maintenance of each community. The weekly site fee covers:
Council land rates, water rates and provision of community electricity
Upkeep of roads, landscaping and community areas
Page 10 of 61Livingstone’s 5 Year Housing Demand Analysis
Security cameras
Management and administration of the estate
Operation of the community bus and fuel
Lease/license to occupy your site in perpetuity, and when requested
Health-related assistance
8) Offsite storage
Our work suggests that there is a strong demand across the Yeppoon region for more self-
storage facilities catering for the common uses listed above, as well as more facilities for
the storage of larger items such as boats, jet skis and caravans.
In our opinion, additional supply of 20-30 outdoor spaces per annum would be readily taken
up; if undercover boat and caravan storage facilities were offered, demand could easily
reach 50-60 (again per annum) as people would relocate their items from open-air storage
spaces elsewhere.
Another option worth considering is on-site storage within subdivisions and larger
townhouse/villa projects. For example, many new subdivisions these days dedicate off
street and secure hardstand areas for storage of boats and caravans. Often these are
within close proximity or and/or form part of a local Men’s Shed facility.
Mentioned separately in this report are Halcyon Communities, purpose built active adult
retirement communities operating under the Manufactured Homes (Residential Parks) Act
2003. Halcyon Communities also hardstand areas within the gated estate for parking of
boats, caravans and motor homes. In some cases, these facilities can be extensive. For
example, at Halcyon Parks in Caloundra, there are more than 50 parking spaces for such
items.
Page 11 of 61Livingstone’s 5 Year Housing Demand Analysis
A similar model is that of RV Homebase at Tinana, near Maryborough. This is another
active adult retirement community comprising 210 homes on a 90-acre site along with
community hall, gym, pool, craft centre and a bowling green. All homes are designed to
cater to mobile homeowners, with garage of between 14m and 16m in length and up to
seven metres wide, and with 3.6m or higher roller doors. Each fully enclosed garage comes
complete with services such as grey water system, 15-amp power, TV and phone point for
connection to a caravan/or motor home.
In many urban locations, townhouse developments with 30-40 or more dwellings often
include recreation facilities such as a swimming pool and tennis court, and it may be
possible to also include a limited number of hardstand parks for outdoor recreation assets
that can be leased from the body corporate.
9) Next steps
We suggest the following next steps to best help implement a wider range of housing
options across Livingstone Shire. They include:
Work shopping these results with:
o Relevant council staff
o Livingstone Shire and other relevant elected representatives
o Local development community include ‘gatekeepers’ like valuers, financiers and
active real estate agencies
In addition, we suggest:
o Suppling a demonstration of this new housing need via local displays, presentations
and an active social media campaign
o The generation of a series of regular media releases
o And when appropriate enter relevant urban design and development awards
The local development community will need to be lead (and somewhat coerced) when it
comes to the provision of new housing stock. As a result, it is likely that an outside
development/builder player – with a broader mindset and experience – will be needed
to kickstart local change and used to help initiate the first (or maybe many) future
alternate housing solutions across Livingstone Shire.
Page 12 of 61Livingstone’s 5 Year Housing Demand Analysis
5. Key findings
………………………………………………….
1) Demographics
Livingstone Shire’s rate of annual population growth is increasing. The shire is expected
to grow by 650 new residents per annum over the next five years.
Most of this growth is expected to continue in two coastal locations being Emu Park and
Yeppoon, with Yeppoon increasing its future market share.
Most of this growth comes from internal migration, with the local area and the rest of
Queensland being the source of much of this population increase.
Over the next five years most of the forecast population growth is expected to take
place across three lifecycle segments:
o Young renters
o Downsizers
o Retirees
For further information see tables 1 to 9 in section 6 of this report.
2) Future housing demand
Looking forward there is a need to build some 330 new dwellings each year – over the
next five years – across Livingstone Shire to cater for the forecast rate of population
growth.
Most of this new housing will need to suit the retirement market, followed by
downsizers, aged persons (those aged over 79) and young renters. The demand for new
homes targeting first home buyers and families is expected to be lower – over the next
five years – that is has been in the past.
At the time of writing the federal government HomeBuilder covid-19 financial subsidy is
distorting detached housing demand. It is bringing forward demand and has very
strong appeal to first home buyers, especially when combined with Queensland’s first
home buyer bonuses being offered on new builds.
In addition, there is currently some covid-19 related demographic flight from the
eastern capital cities to regional towns and seaside locations. To a certain degree –
evident anecdotally – this is happening in Yeppoon and Emu Park.
Our modelling – and past experience – suggests that the influence of HomeBuilder (or
similar) and once off population events, like the current covid-related demographic
Page 13 of 61Livingstone’s 5 Year Housing Demand Analysis
flight, will most likely be short lived and that the fundamental local demographic (and
economic) trends will dominate soon again.
On that note, there is a potential need for a wide range of dwelling types across
Livingstone Shire over the next five years. There appears to be little demand for
dwellings in large apartment complexes.
See tables 10 to 12 for more information.
3) Housing demographics
Table 13 provides a summary of several key demographic indicators by housing type,
being detached house, townhouse and apartment. Some key findings include:
o The majority of residents live in detached house
o Most properties have four or more bedrooms
o Also, many have two or more cars
o Families live in houses, people living alone or as a couple reside in townhouses and
apartments
o Yet regardless of housing type almost all house typically houses less than two
residents
In addition, some 16% (or one in six dwellings) of Livingstone Shire’s private housing
stock is unoccupied most of the time.
4) Housing tenure + buyer origins
Detached houses are held by owner residents, whilst attached dwellings are mostly
rented and are bought by investors. Yet over recent years more owner residents are
buying attached dwellings. However, regardless of housing type or buyer profile, most
buyers are locals.
See tables 14 to 16.
5) Other relevant statistics
Most employed local residents work in either white-collar service/support roles or in
labour based industries. Then highest level of education for many is a TAFE certificate
and very few local adult residents are currently studying.
One in ten locals (9%) work from home, with 25% of those working in a professional
industry working from home. The older the workforce is the higher the proportion of
them working from home.
One in twenty (5%) local residents say they need health-related assistance at home,
with this need for care increasing as residents age.
Page 14 of 61Livingstone’s 5 Year Housing Demand Analysis
The average gross household income across Livingstone Shire is $131,500, which nets
back to $122,000 (disposable household income).
See tables 17 to 22.
6) Visitor statistics
Just under 10% (8%) of dwellings across Livingstone Shire hold an overnight visitor.
Most of these visitors come from Queensland and are mainly aged over 55 years.
A third of visitors to the area stay with friends or relatives, whilst another 30% stay in
either their own holiday/secondary property or in bed ‘n’ breakfast styled
accommodation.
See tables 23 and 24.
7) Macro residential development trends
Some 1,320 dwellings are expected to be ready for development across Livingstone
Shire over the next five years, of which 38% or 500 are anticipated to hold medium
density dwellings.
Yet only 10% of the new dwelling approvals over the past decade in the area have been
for medium density housing solutions.
Livingstone Shire’s new housing market is currently undersupplied.
See tables 25 to 28 and chart 1.
8) More detailed residential development trends
The proportion of approved dwellings available for development has dropped across
Livingstone Shire in recent years. In addition, the number of lapsed dwelling approvals
have increased. Most of the lapsed stock involve medium density development.
In recent years most residential development applications are for small projects, but
80% of the new dwellings are supplied in large estates.
Regardless of product type, most new housing development take place in Yeppoon.
See tables 29 to 33 and appendix 1.
9 to 11) Housing market overview, rental market + detached housing market
Page 15 of 61Livingstone’s 5 Year Housing Demand Analysis
Livingstone Shire’s housing market is in the recovery phase on the property clock, with
residential sale volumes, and prices, rising. In addition, local rental vacancies rates are
falling, and weekly rents are escalating.
There are about 600 detached houses sold across Livingstone Shire each year; followed
by 250 vacant land sales and 100 attached dwelling sales per annum.
Most renters live in detached housing, followed by apartments.
Most detached houses sell for under $500,000.
See chart 2 and tables 34 to 38.
Page 16 of 61Livingstone’s 5 Year Housing Demand Analysis
12) Medium density market
Most attached dwellings in the Livingstone Shire area sell for under $400,000.
There have been few new medium dwelling developments in recent times. When they
are being developed, they sell slowly and carry a high sales risk. Most apartments in the
area still resell for a loss.
Townhouse development, which to date is rare in the area, sold faster and to more
owner residents than apartment stock.
See tables 39 to 41.
13) Vacant land market
There are two distinct land markets across Livingstone Shire being land sized between
800 and 1,000 square metres and rural allotments. However, the average lot size has
fallen and the price of land on a per square metre basis has risen in recent years.
Most vacant allotments sell to intending owner residents. Few allotments, however,
sell part of a turn-key house and land package.
See tables 42 to 45.
14) Local storage facilities
There are some 200 commercial storage sheds in the local areas, with all five operations
reporting 100% occupancy. Some of these facilities also offer a small number of open-
air parking spaces (around 25-30 in total) for boats and caravans, and some of these are
on grass rather than hardstand. There are four (4) spaces currently available and rents
range between $90 and $100 per month per parking space.
See table 46.
Page 17 of 61Livingstone’s 5 Year Housing Demand Analysis
15) A wider view
An analysis comparing Livingstone Shire with a selection of regional Queensland local
authority area shows:
o Livingstone Shire’s resident population is growing relatively quickly
o The shire is falling behind others regarding development ready supply
o Livingstone Shire has a low proportion of smaller allotments in its current mix
o The local area is relatively expensive with regards to buying a detached house and,
on a rate per square metre basis, vacant land
See tables 47 to 51.
Page 18 of 61Livingstone’s 5 Year Housing Demand Analysis
6. Supporting information
………………………………………………….
1) Resident population
Table 1
Livingstone Shire: Past population growth
Financial years Resident population Annual change
2009 32,474 1,067
2010 32,906 432
2011 33,394 488
2012 34,381 987
2013 35,279 898
2014 36,063 784
2015 36,579 516
2016 36,950 371
2017 37,286 336
2018 37,629 343
2019 38,078 449
Matusik + ABS.
Table 1 tells me: that 38,000 people live in Livingstone Shire and that the population grew
by 450 new residents last year. The rate of annual population growth has increased in
recent years.
Table 2
Livingstone Shire: Past and forecast population growth
Financial year Resident population Annual change
Past growth
2014 36,063 403
2019 38,078
Future growth
2021 38,770 650
2026 42,019
Matusik, ABS + Queensland Government Population Projections, 2018 edition (medium series).
Table 2 tells me: that Livingstone Shire’s rate of population growth is expected to rise to
650 per annum over the next five years.
Page 19 of 61Livingstone’s 5 Year Housing Demand Analysis
Table 3
Livingstone Shire: Distribution of past population growth by SLA2
SLA2 area 2019 resident Annual change Growth
population last five years distribution
Emu Park 5,895 122 30%
Glenlee-Rockyview 5,197 45 11%
Rockhampton East 3,345 -16 -3%
Rockhampton North 4,358 13 3%
Shoalwater Bay 16 0 0%
Yeppoon 19,267 239 59%
Total 38,078 403 100%
Matusik + ABS. Past five year period between 2014 and 2019 financial years.
Table 3 tells me: that most of Livingstone Shire’s recent population growth has been in the
seaside suburbs of Yeppoon and Emu Park.
Table 4
Livingstone Shire: Distribution of forecast population growth by SLA2
SLA2 area 2026 resident Annual change Growth
population next five years distribution
Emu Park 7,217 173 27%
Glenlee-Rockyview 5,184 16 2%
Rockhampton East 3,658 41 6%
Rockhampton North 4,238 0 0%
Shoalwater Bay 16 0 0%
Yeppoon 21,706 420 65%
Total 42,019 650 100%
Matusik + Queensland Government Population Projections, 2018 edition (medium series).
Next five year period between 2021 and 2026 financial years
Table 4 tells me: the future population growth – over the next five years – is anticipated to
focus on Yeppoon.
Page 20 of 61Livingstone’s 5 Year Housing Demand Analysis
Table 5
Livingstone Shire: Recent population growth by component
SLA2 area Last year’s Population growth component
growth Natural Net internal Net overseas
increase migration migration
Emu Park 147 -7% 101% 6%
Glenlee-Rockyview 61 16% 66% 18%
Rockhampton East -59 20% -124% 4%
Rockhampton North 31 -7% 81% 26%
Shoalwater Bay 0 0% 0% 0%
Yeppoon 269 26% 54% 20%
Total 449 18% 64% 18%
Matusik + ABS. Last year’s growth between 2018 and 2019 financial years.
Table 5 tells me: that two-thirds of Livingstone Shire’s population growth last year came
from internal migration. This trend has been evident for some time.
Table 6
Livingstone Shire: Net internal migration by source
Origin Distribution
Local area 27%
Other Queensland 60%
New South Wales 4%
Victoria 2%
Other interstate 3%
Overseas 4%
Total 100%
Matusik + ABS. Place of usual residence 5 years ago. 2016 Census.
Table 6 tells me: that most of this internal migration comes from Queensland.
Page 21 of 61Livingstone’s 5 Year Housing Demand Analysis
Table 7
Livingstone Shire: Resident by country of birth (top 10)
Origin Distribution
United Kingdom 37%
New Zealand 27%
South Africa 6%
Germany 4%
United States 3%
Netherlands 3%
Ireland 2%
Thailand 2%
Canada 2%
24 other countries 14%
Total 100%
Matusik + ABS. 2016 Census.
Table 7 tells me: that most of the local residents who moved to Livingstone Shire from
overseas have come largely from Anglo-Saxon countries and in particular from the United
Kingdom and New Zealand.
Table 8
Livingstone Shire: Past population growth by lifecycle segmentation
Lifecycle segment 2019 2019 Annual Growth
resident distribution growth last distribution
population five years
Children living at home 7,126 18% 12 3%
Young renters 4,387 12% 9 2%
First home buyers 3,903 10% 1 0%
Families 9,758 26% -55 -13%
Downsizers 7,999 21% 194 48%
Retirees 4,103 11% 198 49%
Aged 802 2% 44 11%
Total 38,078 100% 403 100%
Matusik + ABS. Past five year period between 2014 and 2019 financial years.
Table 8 tells me: that most of the recent population growth across Livingstone Shire took
place in two particular lifecycle segments – downsizers and retirees.
Page 22 of 61Livingstone’s 5 Year Housing Demand Analysis
Table 9
Livingstone Shire: Forecast population growth by lifecycle segmentation
Lifecycle segment 2026 2026 Annual Growth
resident distribution growth next distribution
population five years
Children living at home 7,005 17% -3 -1%
Young renters 4,749 11% 81 13%
First home buyers 3,756 9% 14 2%
Families 9,613 23% 20 3%
Downsizers 9,006 21% 127 19%
Retirees 6,603 16% 334 52%
Aged 1,287 3% 77 12%
Total 42,019 100% 650 100%
Matusik + Queensland Government Population Projections, 2018 edition (medium series).
Next five year period between 2021 and 2026 financial years.
Table 9 tells me: that over the next five years, much of Livingstone Shire’s population
growth is forecast to take place in three lifecycle segments being – retirees, downsizers and
young renters.
2) Future housing demand
Table 10
Livingstone Shire: Forecast housing demand by lifecycle buyer segmentation
Lifecycle buyer segment Annual Average Annual housing demand
growth next household
five years size Number Distribution
Young renters 81 2.35 35 10%
First home buyers 14 2.71 5 2%
Families 20 3.25 5 2%
Downsizers 127 2.26 55 16%
Retirees 334 1.88 180 55%
Aged 77 1.57 50 15%
Total 650 330 100%
Matusik, ABS + Queensland Government Population Projections, 2018 edition (medium series).
Next five year period between 2021 and 2026 financial years.
Table 10 tells me: that there is an underlying need to build 330 new dwellings per annum
over the next five years across Livingstone Shire to cater for the forecast population
increase.
Most of this new housing will need to suit the retirement market, followed by downsizers,
aged persons (those aged over 79) and young renters.
The demand for new homes targeting first home buyers and families is expected to be low.
Table 11
Page 23 of 61Livingstone’s 5 Year Housing Demand Analysis
Matusik housing preference model: Regional Australia
Lifecycle buyer segment
First home buyers
Young renters
Downsizers
Upgraders
Retirees
Aged
Dwelling type
Traditional detached houses 5% 20% 60% 10% 10% 0%
Small lot homes 25% 40% 10% 30% 25% 0%
Dual occupancy or backyard housing 60% 40% 30% 35% 10% 20%
Townhouses, terrace or villas 5% 0% 0% 10% 25% 10%
Small scale, infill apartment projects 5% 0% 0% 10% 20% 5%
Large apartment complexes 0% 0% 0% 5% 5% 0%
Age-relate care 0% 0% 0% 0% 5% 65%
Total 100% 100% 100% 100% 100% 100%
Matusik annual market testing survey, 2012 to 2020. Next five year period between 2021 and 2026
financial years.
Table 11 outlines: regional Australia’s dwelling preference by lifecycle segment. This
information has been used with the forecasts outlined in table 10 to help determine housing
demand by dwelling type for Livingstone Shire over the next five years. See table 12
overleaf.
Page 24 of 61Livingstone’s 5 Year Housing Demand Analysis
Table 12
Livingstone Shire: Forecast housing demand by dwelling type
Annual housing demand
Dwelling type Number Distribution
Traditional detached houses 30 9%
Small lot homes 70 21%
Dual occupancy or backyard housing 75 23%
Townhouses, terrace or villas 60 18%
Small scale, infill apartment projects 45 14%
Large apartment complexes 10 3%
Age-relate care 40 12%
Total 330 100%
Matusik annual market testing survey, 2012 to 2020, ABS + Queensland Government Population
Projections, 2018 edition (medium series). Next five year period between 2021 and 2026 financial years.
Table 12 tells me: that there is a potential need for a wide range of dwelling types across
Livingstone Shire over the next five years. There is little demand for dwellings in large
apartment complexes.
3) Housing demographics
Table 13
Livingstone Shire: Select housing demographics
Indicator House Townhouse Apartment
Overall
% residents 91% 2% 4%
% households 86% 4% 6%
Avg household size 2.7 1.6 1.5
Number of bedrooms
One 2% 24% 18%
Two 9% 41% 59%
Three 40% 30% 22%
Four 41% 4% 1%
Five + 8% 1% 0%
Page 25 of 61Livingstone’s 5 Year Housing Demand Analysis
Number of cars
None 4% 5% 4%
One 21% 35% 3%
Two 49% 45% 42%
Three 16% 10% 14%
Four + 10% 5% 7%
Household type
Couples no children at home 34% 16% 19%
Couple families with children 34% 5% 5%
One parent family 10% 12% 11%
Lone persons 18% 60% 61%
Unrelated group 4% 7% 4%
Number people usually resident
One 18% 60% 61%
Two 39% 32% 29%
Three 16% 5% 7%
Four 16% 2% 2%
Five + 11% 1% 1%
Matusik + ABS. 2016 Census.
Table 13 tells me: that most for Livingstone Shire’s residents live in detached houses. Most
of these have four or more bedrooms. Most households have two vehicles. Many that
reside in medium density accommodation live alone or as a couple; and very few of
household – regardless of housing type - have more than two residents.
In addition, some 16% of Livingstone Shire’s private housing stock if unoccupied most of
the time.
4) Housing tenure + buyer origins
Table 14
Livingstone Shire: Housing tenure
Indicator House Townhouse Apartment
Housing tenure
Owned outright 37% 21% 20%
Mortgage 41% 10% 11%
Renter 22% 69% 69%
Matusik + ABS. 2016 Census.
Table 14 tells me: that most of the attached dwellings in Livingstone Shire are held by
investors.
Table 15
Livingstone Shire: Recent trends in housing tenure
Financial Detached houses Medium density dwellings
years Owner resident Investor Owner resident Investor
2016 74% 26% 47% 53%
Page 26 of 61Livingstone’s 5 Year Housing Demand Analysis
2017 73% 27% 38% 62%
2018 70% 30% 51% 49%
2019 69% 31% 53% 47%
2020 75% 25% 49% 51%
Matusik + Price Finder. Settled sales.
Table 15 tells me: that last year, three quarters of the detached houses sold across
Livingstone Shire were bought by owner residents, whilst half of the medium density
households sold were purchased by owner residents.
There has been increasing interest by owner residents in buying attached dwellings in the
Livingstone Shire over recent years.
Table 16
Livingstone Shire: Buyer origins by housing type
Buyer origin Detached houses Medium density Vacant
dwellings residential land
Livingstone Shire 82% 61% 61%
Rockhampton Shire 6% 10% 16%
Emerald-Longreach area 4% 10% 9%
South East Queensland 1% 8% 6%
Other Queensland 4% 2% 4%
Interstate 3% 8% 4%
Overseas 0% 1% 0%
Total 100% 100% 100%
Matusik + Price Finder. Settled sales during fiscal 2020.
Table 16 tells me: that most buyers – regardless of housing product – come from
Livingstone and Rockhampton Shires.
Page 27 of 61Livingstone’s 5 Year Housing Demand Analysis
5) Other relevant statistics
Table 17
Livingstone Shire: Employed residents by occupation
Occupation % residents over 15 years
Management 13%
Professional service 14%
White collar service/sales/support 37%
Trade-related 15%
Labour-based 21%
Total 100%
Matusik + ABS. Excludes not stated. 2016 Census.
Table 17 tells me: that many of the employed residents in Livingstone Shire work in either
white-collar service/support roles or in labour based industries.
Table 18
Livingstone Shire: Highest level of education
Education level % residents over 15 years
University or tertiary 12%
TAFE or similar 31%
Matusik + ABS. Excludes not stated. 2016 Census.
Table 19
Livingstone Shire: Residents attending education
Education level % residents over 15 years
Preschool or primary 11%
Secondary 9%
TAFE or similar 1%
University or tertiary 3%
Other 1%
Not attending 75%
Total 100%
Matusik + ABS. Excludes not stated. 2016 Census.
Tables 18 and 19 tells me: that the highest level of education for most local workers is a
TAFE qualification and that few local adult residents are actively studying at present.
Table 20
Livingstone Shire: Proportion of residents who work from home
Indicator % working from home
Occupation
Management 8%
Professional service 24%
White collar service/sales/support 9%
Trade-related 6%
Page 28 of 61Livingstone’s 5 Year Housing Demand Analysis
Labour-based 3%
Total labour force 9%
Age group
15 to 24 years 1%
25 to 34 years 6%
35 to 44 years 10%
45 to 54 years 9%
55 to 64 years 15%
65 to 74 years 31%
75+ years 34%
Total labour force 9%
Matusik + ABS. Excludes not stated. 2016 Census.
Table 20 tells me: that 9% of the local workforce work from home and some 25% for those
working in a professional industry work from work. Furthermore, around a third of people
in the workforce aged over 65 years of age work from home.
Table 21
Livingstone Shire: Average household income
Economic measure 2019 financial year
Wages & salaries $82,560
Property income $14,484
Business income $10,674
Superannuation $7,206
Cash benefits $16,645
Gross household income $131,569
Tax paid -$20,423
Interest paid -$5,501
Other payments/statistical discrepancy $16,375
Disposable household income $122,019
Matusik + National Institute of Economic and Industry Research (NIEIR).
Table 21 tells me: that the average gross household income in Livingstone Shire is
$131,500 and the average disposable household income is $122,000.
Table 22
Livingstone Shire: Need for health-related assistance by age group
Age group Number % total of age group
0 to 19 years 235 3%
30 to 54 years 332 2%
55 to 64 years 274 5%
65 to 74 years 303 8%
75 to 84 years 346 19%
85 years + 331 48%
Total 1,821 5%
Matusik + ABS. 2016 Census.
Page 29 of 61Livingstone’s 5 Year Housing Demand Analysis
Table 22 tells me: that 5% of Livingstone Shire’s residents need health-related assistance
and the need for this assistance is high for residents aged over 75 years.
6) Visitor statistics
Table 23
Livingstone Shire: Proportion of dwellings with overnight visitors
Indicator Distribution
Visitor origin
Livingstone Shire 2%
Other Queensland 54%
New South Wales 12%
Victoria 21%
Other interstate 9%
Overseas 2%
Age group
0 to 14 years 7%
15 to 24 years 10%
25 to 54 years 21%
55 to 64 years 20%
65 to 74 years 29%
75 years + 13%
% dwellings with overnight visitors 8%
Matusik + ABS. Census 2016.
Table 23 tells me: that 8% of the dwellings across Livingstone Shire hold overnight visitors;
most of these overnight visitors come from Queensland and most are aged over 55 years of
age.
Table 24
Livingstone Shire: Overnight tourists
Indicator Distribution
Main reason for travel
Holiday 71%
Visiting friends and relatives 29%
Age group
15 to 34 years 30%
35 to 54 years 30%
55 years + 40%
Travel group
Alone 20%
Couple 39%
Family group 24%
Friends or relatives travelling together 17%
Accommodation
Hotel, motel or serviced apartments 11%
Home of friend or relative 35%
Page 30 of 61Livingstone’s 5 Year Housing Demand Analysis
Caravan park 22%
Back backers’ accommodation 2%
Secondary residence or bed ‘n’ breakfast 30%
Matusik + Tourism Research Australia. Financial 2019.
Table 24 tells me: that most overnight travels to Livingstone Shire are on holidays; many
are aged over 55 years of age; many travel as a couple or in a family group and stay with
friend or relatives or their secondary residence.
Page 31 of 61Livingstone’s 5 Year Housing Demand Analysis
7) Macro residential development trends
Table 25
Livingstone Shire: Broad hectare dwelling yield + time frame
Time frame Broad hectare stock
Higher Standard Rural Total % total
density urban Residential dwellings dwellings
Hectares
0 to 2 years 1 39 41 81 14%
2 to 5 years 17 74 9 100 17%
Under 5 years 18 113 50 181 31%
% total 10% 62% 28% 100%
5 to 10 years 5 46 20 71 12%
10+ years 5 228 78 311 53%
Not specified 0 19 0 19 3%
Total 28 406 148 582 100%
Medium dwelling yield scenario
0 to 2 years 44 167 3 214 7%
2 to 5 years 454 634 16 1,104 35%
Under 5 years 498 801 19 1,318 41%
% total 38% 61% 1% 100%
5 to 10 years 230 232 28 490 15%
10+ years 201 1,098 25 1,324 42%
Not specified 7 42 0 49 2%
Total 936 2,173 72 3,181 100%
Matusik + QGSO broad hectare Study as of September 2020.
Table 25 tells me: that some 181 hectares are expected to be available for residential
developments across Livingstone Shire over the next five years. This equates to some
1,320 dwellings or around 40% of the broad hectare supply.
Around 38% or 500 of these 1,320 dwellings are expected to be medium density.
Page 32 of 61Livingstone’s 5 Year Housing Demand Analysis
Table 26
Livingstone Shire: New dwelling approvals
Dwelling approvals
Years ending Detached Attached % Detached
September houses dwellings Total dwellings dwellings
2011 259 22 281 8%
2012 258 16 274 6%
2013 360 112 472 24%
2014 332 52 384 14%
2015 235 62 297 21%
2016 241 8 249 3%
2017 198 6 204 3%
2018 113 6 119 5%
2019 151 34 185 18%
2020 182 14 196 7%
Average 239 34 274 11%
Matusik + ABS.
Table 26 tells me: that, on average, some 275 new dwellings have been approved each year
across Livingstone Shire over the last decade. About 10% of these new dwelling approvals
have been attached product.
Table 27
Livingstone Shire: Lot registrations
Lot registrations
Years ending Standard Apartment + Rural Total lot
September allotments townhouses allotments registrations
2011 126 20 29 175
2012 108 10 56 174
2013 130 12 33 175
2014 182 83 132 397
2015 267 38 20 325
2016 101 58 28 187
2017 43 14 20 77
2018 72 2 41 115
2019 47 13 16 76
2020 45 12 69 126
Matusik + Queensland Government Statistician's Office, Queensland Treasury.
Table 27 outlines: lot registrations over the past years across Livingstone Shire.
Table 28
Livingstone Shire: Past underlying demand for new dwellings
Financial years Annual change in Annual underlying
population demand for new homes
2011 488 195
Page 33 of 61Livingstone’s 5 Year Housing Demand Analysis
2012 987 395
2013 898 359
2014 784 314
2015 516 206
2016 371 148
2017 336 134
2018 343 137
2019 449 180
2020 403 161
Average 225
Matusik + ABS. 2020 population growth based on recent five year annual average.
Annual housing demand based on 2.5 people per private dwelling.
Table 28 tells me: that, on average, there was a need to build some 225 new dwellings
each across Livingstone Shire over the last ten years.
Page 34 of 61Livingstone’s 5 Year Housing Demand Analysis
Chart 1
Livingstone Shire: Current status of new dwelling supply
Chart 1 shows: the interplay between housing demand and two measures of new dwelling
supply – dwelling approvals (revisit table 26) and dwelling registrations (revisit table 27).
Dwelling approvals (the grey line) is the beginning of the supply process, whilst a more
accurate measure of actual new housing supply is a lot registration. This happens when the
property title is transferred from the developer to the buyer and takes place at settlement.
See the red line in our chart.
Chart 1 shows that the Livingstone Shire new housing market is undersupplied.
Page 35 of 61Livingstone’s 5 Year Housing Demand Analysis
8) More detailed residential development trends
Table 29
Livingstone Shire: Lots with operational works approval
Financial Total Lots with % with op work
years lots op works approvals
2018 1,594 535 34%
2019 1,626 533 33%
2020 1,677 423 25%
Matusik + Queensland Government Statistician's Office, Queensland Treasury.
Table 29 tells me: that 25% of the total lots approved across Livingstone Shire have
operational works and that this proportion has fallen in recent years.
Table 30
Livingstone Shire: Dwelling approvals lapsed
Financial years Total lots lapsed
2016 76
2017 87
2018 156
2019 172
2020 133
Average 125
Matusik + Queensland Government Statistician's Office, Queensland Treasury.
Table 30 tells me: that, on average, 125 approved dwellings have lapsed per annum over
the past five years. The ten year average was 99 per annum. Also, table 30 shows that the
number of approved dwellings that have lapsed have increased since 2016.
Page 36 of 61Livingstone’s 5 Year Housing Demand Analysis
Table 31
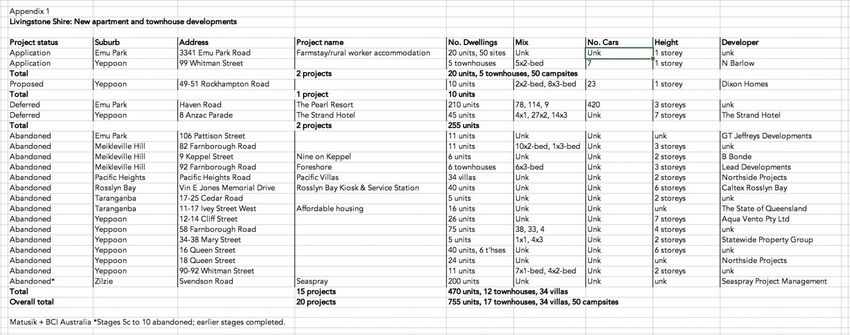
Livingstone Shire: Status of new apartment + townhouse development application
Status No. of Dwelling type + number Total %
projects Apartment Townhouse Other dwellings dwellings
Application 2 20 5 50 75 9%
Proposal 1 10 10 1%
Deferred 2 255 255 30%
Abandoned 15 470 46 516 60%
Total 20 755 51 50 856 100%
Matusik + BCI Australia. See appendix 1 for more detail.
Table 31 tells me: that most of the lapsed approvals in recent years involve medium
density development. Appendix 1 provides more detail.
Table 32
Livingstone Shire: Recent residential development approvals by size
Development size Total approvals Total dwellings
No % No %
Under 10 dwellings 28 65% 66 11%
11 to 20 dwellings 3 7% 42 7%
21 to 50 dwellings 10 23% 382 63%
50+ dwellings 2 5% 113 19%
Total 43 100% 603 100%
Matusik + Queensland Government Statistician's Office, Queensland Treasury.
Totals for last three financial years, being 2018, 2019 and 2020.
Table 32 tells me: that most of the new development approvals across Livingstone Shire in
recent years have been in small projects (under 10 dwellings), yet most of the new
approvals by dwelling count are in larger projects.
Page 37 of 61Livingstone’s 5 Year Housing Demand Analysis
Table 33
Livingstone Shire: Distribution of lot registrations by SLA2
SLA2 Lot type Total lots % total
Standard Apartment/ Rural
townhouse
Emu Park 17 10 1 28 5%
Glenlee-Rockyview 0 0 31 31 5%
Rockhampton East 0 0 35 35 6%
Rockhampton North 0 0 15 15 3%
Shoalwater Bay 0 0 0 0 0%
Yeppoon 291 89 92 472 81%
Total 308 99 174 581 100%
Matusik + Queensland Government Statistician's Office, Queensland Treasury.
Based on last five years, ending September 2020.
Table 33 tells me: that most new residential development, regardless of product type, has
been in Yeppoon.
Page 38 of 61Livingstone’s 5 Year Housing Demand Analysis
9) Housing market overview
Chart 2
Livingstone Shire: Residential property clock position
Chart 2 tells me: that Livingstone Shire’s housing market is in the recovery phase on the
property clock. This stage is characterised by rising sale volumes and a decline in the
number of properties advertised for sale. The rate of change in both cases is often mild.
The number of new houses being approved (and commenced i.e., lot registrations) are
starting to fall below underlying demand. These factors help increase prices.
Also, during the recovery phase, the rental vacancy rate starts to fall. Weekly rents may
still be falling or stagnant, but typically start to rise once the vacancy rate shows consistent
falls and/or falls below 2%.
Page 39 of 61Livingstone’s 5 Year Housing Demand Analysis
Table 34
Livingstone Shire: Housing cycle
Financial years Sales Median Annual
volumes value change
Detached house sales
2016 495 $415,000 0%
2017 572 $410,000 -1%
2018 553 $398,000 -3%
2019 615 $400,000 1%
2020 709 $410,000 3%
Average 600
Attached dwellings
2016 100 $340,000 10%
2017 76 $257,000 -24%
2018 86 $277,500 8%
2019 104 $283,000 2%
2020 105 $280,000 -1%
Average 100
Vacant land
2016 223 $175,000 1%
2017 220 $178,000 2%
2018 175 $190,000 7%
2019 162 $177,000 -7%
2020 300 $184,000 4%
Average 235
House + land packages
2016 20 $425,000 0%
2017 18 $426,000 0%
2018 15 $410,000 -4%
2019 14 $412,500 1%
2020 14 $457,500 11%
Average 15
Matusik, Price Finder + Queensland Department of Natural Resources and Mines, Office of the Valuer-
General, Property Sales. Includes Matusik sales volume estimates for last three years.
Table 34 tells me: that residential sales volumes and prices across Livingstone Shire are
rising.
Table 34 also outlines the size of each major housing market over the past five years.
In summary: 600 detached houses per annum; 250 land sales each year (when including
house + land packages) and 100 medium density sales per annum.
10) Rental market
Table 35
Page 40 of 61Livingstone’s 5 Year Housing Demand Analysis
Postcodes 4703 and 4710: Rental cycle
September Vacant Vacancy rate Four bedroom Annual
each year dwellings house rent change
Postcode 4703
2016 168 5.6% $390 -$10
2017 194 6.4% $370 -$20
2018 82 2.7% $400 $30
2019 51 1.7% $440 $40
2020 15 0.5% $450 $10
Postcode 4710
2016 98 11.7% $300 $0
2017 94 10.9% $300 $0
2018 30 3.4% $280 -$20
2019 35 3.8% $340 $60
2020 18 1.9% $380 $40
Matusik, SQM Research + Queensland Residential Tenancies Authority.
Table 35 tells me: the rental vacancy rate in the two major postcodes that hold most of
Livingstone Shire’s rental accommodation (close to 95%) is now very tight and as a result
weekly rents are accelerating.
Page 41 of 61Livingstone’s 5 Year Housing Demand Analysis
Table 36
Postcode 4703: Medium weekly rents
Housing type 2019 2020 Change
1-bed apartment $225 $250 $25
2- bed apartment $290 $320 $30
3- bed apartment $320 $340 $20
2-bed house $315 $330 $15
3-bed house $350 $360 $10
4-bed house $440 $450 $10
Matusik + Queensland Residential Tenancies Authority. As of September, each year.
Table 36 shows: the current medium weekly rents for rental accommodation by housing
type as of September 2020. Table 36 also shows that rents, across each product type, have
increased over the last 12 months.
Table 37
Livingstone Shire: Size of rental market
Dwelling type Number of bonds held % distribution
Detached house 4,319 77%
Apartment 1,077 19%
Townhouse 148 3%
Moveable dwelling 80 1%
Rooming accommodation 7 0%
Other 11 0%
Total 5,642 100%
Matusik + Queensland Residential Tenancies Authority. As of September 2020.
Table 37 outlines: the size of the rental market across Livingstone Shire by dwelling type.
Most rented dwellings are detached houses, followed by apartments.
Page 42 of 61Livingstone’s 5 Year Housing Demand Analysis
11) Detached housing market
Table 38
Livingstone Shire: Detached house sales by price range
Price range Financial years
2016 2017 2018 2019 2020
Under $300,000 88 121 128 127 130
$300,000 to $400,000 142 145 155 177 194
$400,000 to $500,000 134 157 127 167 180
$500,000 to $600,000 64 74 73 65 102
$600,000 to $700,000 28 37 35 46 48
$700,000 to $800,000 17 18 14 17 28
Over $800,000 22 20 21 16 27
Total 495 572 553 615 709
Matusik + Price Finder. Includes Matusik sales volume estimates for last three years.
Table 38 tells me: that most detached house sales are priced under $500,000 across
Livingstone Shire.
12) Medium density market
Table 39
Livingstone Shire: Medium density dwelling sales by price range
Price range Financial years
2016 2017 2018 2019 2020
Under $300,000 43 52 52 57 56
$300,000 to $400,000 32 12 17 30 24
$400,000 to $500,000 9 9 13 10 13
$500,000 to $600,000 2 1 3 2 6
$600,000 to $700,000 10 1 1 2 3
$700,000 to $800,000 2 0 0 1 1
Over $800,000 2 1 0 2 2
Total 100 76 86 104 105
Matusik + Price Finder. Includes Matusik sales volume estimates for last three years.
Table 39 tells me: that most attached dwelling sales are priced under $400,000 across
Livingstone Shire
Page 43 of 61Livingstone’s 5 Year Housing Demand Analysis
Table 40
Select local medium density projects: Sale rate and buyer profile
Indicator
Lammermoor
Farnborough
Rosslyn Bay
Apartments
Apartments
Beaches on
Echelon
Shores
Resort
Oshen
Salt
No of dwellings 24 42 62 54 50 16
Project start 2006 2007 2010 2009 2013 2014
% Presold 50% 50% 60% 30% 90% 100%
Sales per month 0.5 0.5 0.7 1.5 1.5 2.0
Buyer profile
Owner resident 15% 30% 10% 5% 10% 45%
Investor 85% 70% 90% 95% 90% 55%
Matusik + Price Finder.
Table 40 tells me: that very few major apartment projects have been built in recent years in
Livingstone Shire and those that have were built in the past have sold slowly and mostly to
investors.
The sales risk appears too high when it comes to developing apartment projects in the local
area.
Farnborough Shores is a townhouse project, which sold relatively quickly and to more
owner residents than local apartment projects.
Table 41
Select local medium density projects: Last five resales in each project
Original sale Re-sale
Date Price Date Price Capital gain (loss)
Beaches on Lammermoor
Jan 2007 $440,000 Oct 2019 $325,000 ($115,000)
Nov 2009 $490,000 Jul 2018 $300,000 ($190,000)
Dec 2006 $495,000 Apr 2019 $310,000 ($185,000)
Feb 2006 $630,000 Jun 2019 $475,000 ($155,000)
Sep 2013 $500,000 Jul 2020 $378,000 ($122,000)
Page 44 of 61You can also read


