RAISE GRANT PROGRAM 2021 - FROM TRACKS TO TRAILS: RECONNECTING ATLANTA COMMUNITIES - Atlanta ...
←
→
Page content transcription
If your browser does not render page correctly, please read the page content below
Benefit Cost Analysis Documentation

RAISE GRANT PROGRAM 2021
       FROM TRACKS TO TRAILS:
              RECONNECTING
        ATLANTA COMMUNITIES

            SOUTHSIDE TRAIL

                CITY OF ATLANTA AND
               ATLANTA BELTLINE, INC.
                         JULY 12, 2021
Southside Trail Project RAISE Grant

Table of Contents
List of Figures ................................................................................................................................. ii
List of Tables .................................................................................................................................. ii
1.     Introduction ............................................................................................................................. 1
2.     Benefit-Cost Analysis Spreadsheet Instructions...................................................................... 2
3.     Approach and Methodology .................................................................................................... 3
     3.1.     Evaluated Scenarios ......................................................................................................... 3
                     No-Build Scenario .................................................................................................... 3
                     Build Scenario ........................................................................................................... 3
     3.2.     Analysis Period ................................................................................................................ 3
     3.3.     Inflation and Discounting Adjustments ........................................................................... 5
     3.4.     Demand Estimation .......................................................................................................... 5
                     Existing Demand ....................................................................................................... 5
                     Forecasting Future Demand ...................................................................................... 7
4.     Costs ........................................................................................................................................ 9
     4.1.     Capital Expenditures ........................................................................................................ 9
     4.2.     Operations and Maintenance .......................................................................................... 10
5.     Benefits .................................................................................................................................. 11
     5.1.     Safety Benefits ............................................................................................................... 13
     5.2.     Travel Time Savings ...................................................................................................... 16
     5.3.     Emissions Savings .......................................................................................................... 18
     5.4.     Quality of Life Benefits.................................................................................................. 20
                     Cyclist and Pedestrian Benefits .............................................................................. 21
                     Health Benefits........................................................................................................ 24
6.     Sensitivity Analysis ............................................................................................................... 25
7.     Unquantified Benefits ............................................................................................................ 30
     7.1.     Students Walking and Biking to School ........................................................................ 30
     7.2.     Reduced Pavement Maintenance ................................................................................... 31
     7.3.     Utility and Stormwater Improvements ........................................................................... 31
     7.4.     Connectivity to Other Multi-Modal Projects ................................................................. 32
     7.5.     Access for ADA and Aging Populations........................................................................ 32
8.     BCA Summary ...................................................................................................................... 34

                                                                          APPENDIX A: BENEFIT-COST ANALYSIS - i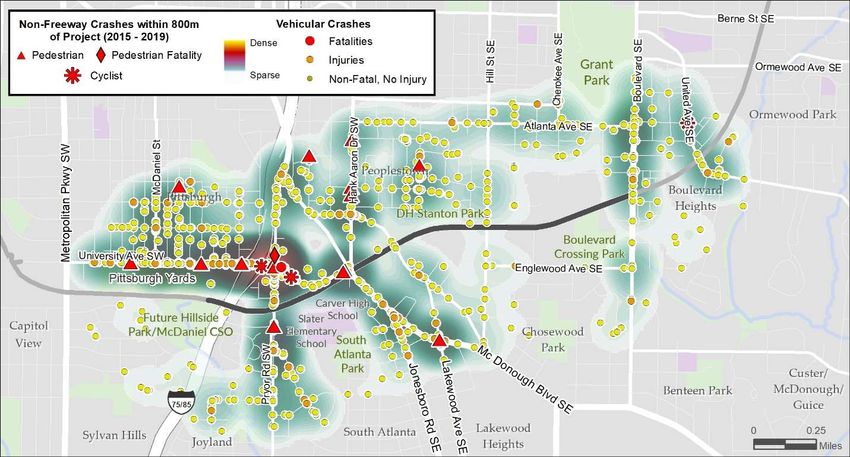
Southside Trail Project RAISE Grant

List of Figures
Figure 1: Project Location Map – Southside Trail.......................................................................... 1
Figure 2: The Existing Southside Trail Corridor ............................................................................ 4
Figure 3: Total Eastside and Westside Trail Activity Over Time .................................................. 6
Figure 4: Associated Project Benefits ........................................................................................... 12
Figure 5: 5-Year Crashes Within 800m of the Project ................................................................. 13
Figure 6: City of Atlanta High-Injury Network Intersections in Last 5 Years ............................. 14
Figure 7: Eastside to Westside Trail Pathway Scenarios .............................................................. 16
Figure 8: Eastside and Westside Intercept Survey – Zip Codes of Users ..................................... 22
Figure 9: Eastside BeltLine Users in Winter ................................................................................ 22
Figure 10: Eastside BeltLine Users in Summer ............................................................................ 23
Figure 11: Proposed Development and Amenities Around the BeltLine ..................................... 27
Figure 12: Student Using the BeltLine ......................................................................................... 30
Figure 13: Bike Infrastructure Around the SST ............................................................................ 32
Figure 14: Suitability for All Ages ............................................................................................... 33
Figure 15: ADA Accessible Trail Access Locations .................................................................... 34
Figure 16: Percentage Breakdown of Benefits and Quality of Life Benefits ............................... 35

List of Tables
Table 1: Benefit-Cost Analysis Spreadsheet Tab Information ....................................................... 2
Table 2: Historical Trail Demand on the Atlanta BeltLine’s Eastside and Westside Trails........... 6
Table 3: Key Assumptions .............................................................................................................. 8
Table 4: Atlanta BeltLine Southside Trail Cost Categories Schedule ............................................ 9
Table 5: Atlanta Beltline Southside Trail Construction Funding Sources .................................... 10
Table 6: Operations & Maintenance Cost ..................................................................................... 11
Table 7: 5-Year Crash Averages (2015-2019) .............................................................................. 14
Table 8: 5-Year Crash Rates (2015-2019) .................................................................................... 14
Table 9: Crashes Avoided by Mode.............................................................................................. 15
Table 10: Value of Crashes Avoided in $2019 ............................................................................. 15
Table 11: Reduced Cyclist/Pedestrians and Vehicular Accidents Benefits .................................. 15
Table 12: Marginal Detour Time .................................................................................................. 17
Table 13: Daily Users ................................................................................................................... 17
Table 14: Total Travel Time Savings ........................................................................................... 17
Table 15: Emissions Reduction Inputs ......................................................................................... 18
Table 16: Conversion Factors ....................................................................................................... 18
Table 17: Emissions Rates per Mile ............................................................................................. 18
Table 18: Damage Cost Per Metric Ton of NOx and CO2 ........................................................... 19
Table 19: Tree Planting Emissions Reduction between No-Build and Build Scenarios .............. 20
Table 20: Annual Emissions Reduction by Pollutant ................................................................... 20
Table 21: Total Reduced Emissions Savings ................................................................................ 20
Table 22: Adult Cyclist and Pedestrian Demand .......................................................................... 23

                                                                    APPENDIX A: BENEFIT-COST ANALYSIS - ii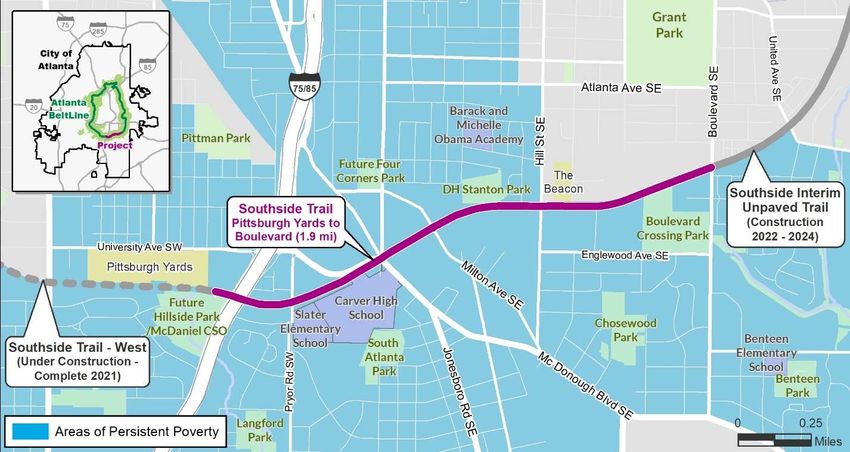
Southside Trail Project RAISE Grant
Table 23: Adult Cyclist and Pedestrians Recreational Benefits ................................................... 24
Table 24: Health Benefits per Recreational User ......................................................................... 25
Table 25: Sensitivity Analysis - Key Assumptions Comparisons ................................................ 25
Table 26: Sensitivity Analysis - Adult Cyclist and Pedestrian Demand Comparison .................. 27
Table 27: Proposed or Completed SST Development Projects .................................................... 28
Table 28: Sensitivity Analysis - Adult Cyclist and Pedestrians Recreational Benefits Comparison
....................................................................................................................................................... 29
Table 29: Sensitivity Analysis - Health Benefits per Recreational User Comparison ................. 29
Table 30: Sensitivity Analysis - Summary of Project Cost and Benefits Comparison ................. 30
Table 31: SST Total Onsite Retainage Volume ............................................................................ 31
Table 32: Summary of Project Cost and Benefits ......................................................................... 34

                                                                         APPENDIX A: BENEFIT-COST ANALYSIS - iii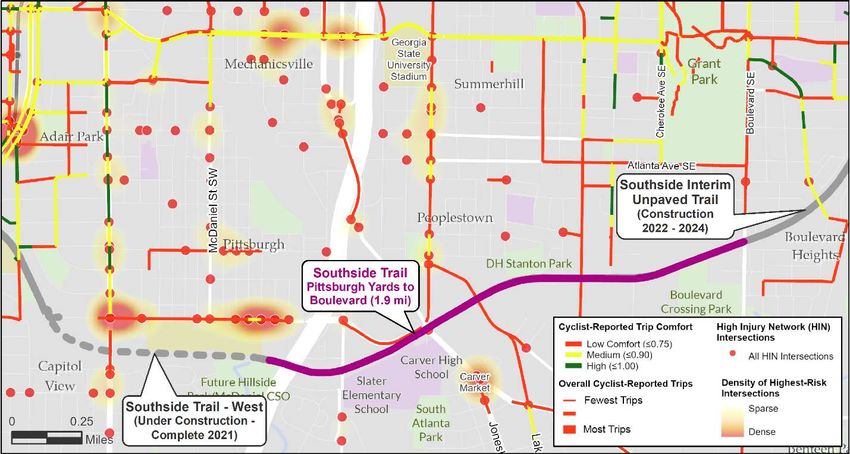
Southside Trail Project RAISE Grant
1. Introduction
This Benefit-Cost Analysis (BCA) report provides the technical background for the analyses
conducted in support of the RAISE grant application for the Atlanta BeltLine Southside Trail
(SST) project. The project map is shown in Figure 1.
Figure 1: Project Location Map – Southside Trail
The following information can be found in each section:
Section 2 provides a breakdown of each tab in the BCA spreadsheet and what information
can be found in each tab.
Section 3 contains the approach and methodology for comparing the No-Build and Build
scenarios.
Section 4 provides the costs associated with the project.
Section 5 reviews the benefits of the BCA including sources for calculations as well as
methodology for demand estimation.
Section 6 provides sensitivity analysis and provides alternative values that can be
considered for the analysis.
Section 7 provides unquantified and qualitative benefits associated with the project that
were not part of the Benefit-Cost Ratio (BCR).
Section 8 gives an overview of the BCA summary.
Additional information is provided within the BCA spreadsheet, including annual estimates of
costs and benefits to assist the U.S. Department of Transportation (USDOT) in the review of this
application.
APPENDIX A: BENEFIT-COST ANALYSIS - 1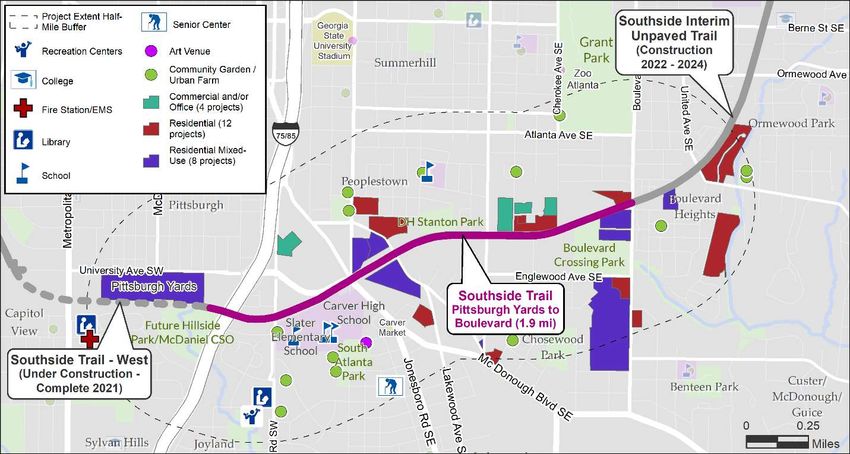
Southside Trail Project RAISE Grant
2. Benefit-Cost Analysis Spreadsheet Instructions
The BCA spreadsheet that accompanies this report is broken into several tabs which present the
methodologies, inputs, and data sources used to calculate the costs and benefits. Table 1 provides
a breakdown of each tab in the spreadsheet.
Table 1: Benefit-Cost Analysis Spreadsheet Tab Information

                                Costs/Benefits
       Tab Name                                                        Overview
                                  Included

                                                       Project summary of benefit-cost ratios for
                                                       the no discount and 7% discounted values
     BCA Summary              All Costs/Benefits
                                                           (3% for CO2), as well as percentage
                                                                 break-down by category
                                                        Project summary of all costs and benefits
  Annualized Summary          All Costs/Benefits         over the project life, including their 7%
                                                             discounted values (3% for CO2)
                              Capital Costs and             Project calculations for costs from
          Cost                  Operations &              scoping to construction, as well as 30
                             Maintenance (O&M)                         years of O&M
                                                        Calculations for existing pedestrian/bike
                             Pedestrian/Bike and
                                                           and vehicular crash rates within 800
     Safety Benefits          Vehicular Safety
                                                        meters of the project and their reductions
                                  Benefits
                                                            with the completion of the project
                                                        Project calculations for reduction in trip
  Value of Travel Time                                 length for bike and ped commuters due to
                             Travel Time Savings
        Savings                                        construction of the project and monetized
                                                              benefits of travel time savings
                            Nitrogen Oxides (NOx)      Project calculations for reducing NOx and
   Emissions Savings         and Carbon Dioxide          CO2 and monetized benefits associated
                                (CO2) Benefits                      with their reductions
                                                        Project calculations for existing and new
                              Pedestrian/Bike
    Quality of Life                                      bike and pedestrian users of the project
                            Recreation and Health
 (Conservative Values)                                        and their associated monetized
                                  Benefits
                                                             recreational and health benefits
                           Quality of Life Benefits     Project summary of all costs and benefits
  Sensitivity Analysis –
                           Modified for Sensitivity     with Quality of Life Benefits substituted
           BCA
                                  Analysis                         for alternative values.
                                                       Quality of Life Benefits calculations done
  Sensitivity Analysis –
                            Quality of Life Benefits      with alternative values for sensitivity
    QoL (Alternative
                            with Alternative Values           testing to compare against the
         Values)
                                                         conservative values used for the BCR.
                                                          Provides values from the USDOT for
      Parameters           USDOT BCA Guidance
                                                       calculating safety and emissions benefits,
   2021BCAGuidance               Values
                                                       as well as inflating values to 2019 dollars

                                                 APPENDIX A: BENEFIT-COST ANALYSIS - 2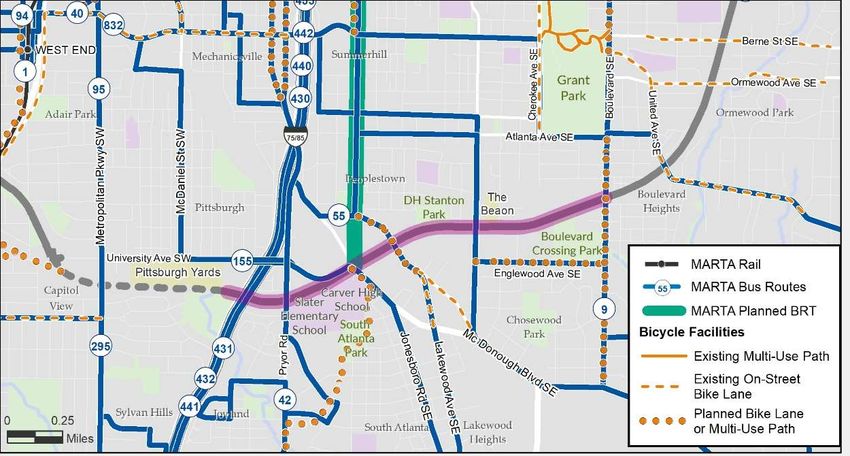
Southside Trail Project RAISE Grant
3. Approach and Methodology
In accordance with USDOT BCA guidelines,1 the BCA analyzes the effects of implementing the
proposed project (Build Scenario) compared to no improvements in the future (the No-Build
scenario). The net benefits between the scenarios are compared to understand the project’s
expected impact.
    3.1. Evaluated Scenarios
                No-Build Scenario
Under the No-Build scenario, the paved trail does not exist, and thus the safety benefits associated
with the grade separated trail could lead to a potential increase in vehicular accidents, emissions,
and roadway maintenance costs to increase as the population growth would only be sustained by
the existing roadway network with limited active transportation choices. Additionally, travel time
savings for pedestrians and bicyclists would not be realized due to a lack of active transportation
infrastructure. Finally, the potential health benefits and safe mobility options for bike and
pedestrian commuters would not exist.
               Build Scenario
The Build scenario assumes the construction of the SST. The proposed project will enhance
vehicular safety at surrounding intersections and eliminate pollution emissions by inducing users
to walk or bike instead of driving to their destinations. Reducing vehicles on the road will also
reduce maintenance costs for roadway repairs. The proposed project is expected to reduce travel
time for pedestrians and bicyclists in the area by connecting existing trail segments and cycle
tracks. Additionally, the proposed project will improve health benefits by providing recreational
facilities and increasing physical activity, while also providing a safe mobility option for
commuters who walk or bike to work or school.
    3.2. Analysis Period
Based on USDOT’s guidelines, projects involving the initial construction or full reconstruction of
highways or similar facilities should use an analysis period of 30 years. The Atlanta BeltLine
received a Brownfield Cleanup grant from the Environmental Protection Agency for the SST in
2020. Currently, the project is a brownfield due to its use previous status as a freight railroad. 2 The
site contains arsenic, one of the most commonly reported contaminants along rail corridors because
of its use as an herbicide. The SST will construct entirely new stormwater drainage, utility duct
banks, lighting, landscaping, ADA accessible access points, and the multi-use trail. This is in
conjunction with brownfield remediation efforts to cleanup soil contamination from decades of
freight usage.
The City of Atlanta purchased railroad corridor from CSX in 2018, and CSX removed the rail and
ties. ABI improved the corridor by creating temporary access points, addressing some safety
concerns, and adding gravel to the compacted ballast on the track bed, opening it to the public in
2019. The interim trail allows limited accessibility as shown in a ride along video filmed in May

1
  U.S. Department of Transportation (Feb. 2021). Benefit-Cost Analysis Guidance for Discretionary Grant
Programs.
2
  Atlanta BeltLine (2020). https://beltline.org/2020/05/12/beltline-awarded-epa-brownfields-cleanup-
grant/#:~:text=The%20Atlanta%20BeltLine%20has%20been,Pittsburgh%20Yards%20and%20Milton%20Avenue.

                                                  APPENDIX A: BENEFIT-COST ANALYSIS - 3
Southside Trail Project RAISE Grant
          3
2021. Based on the current status of the SST, as well as the proposed entirely new construction,
Figure 2 showcases the existing SST as it stands today as an abandoned freight corridor.
Figure 2: The Existing Southside Trail Corridor

Per the Federal Highway Administration (FHWA), lifespan expectancy of the project based on
Atlanta BeltLine’s design standards of 6-inch-deep concrete trail sections are as follows:
      -       Concrete: Approximately 80 Years 4
Additionally, the Atlanta BeltLine is working to reduce the permeability of concrete by adding
pozzolanic materials and reinforcing mesh to reduce cracking and water infiltration into the trail.
Based on the FHWA guidance and the BeltLine’s commitment to building a long-lasting trail, the
30-year analysis period was chosen to reflect the intended long-lasting duration of the project.
It is anticipated that the benefits which accrue from the project will be seen long after the initial
30-year analysis period as the Atlanta BeltLine continues to expand into its envisioned 22-mile
loop around the city. The BCA analysis covers capital costs from scoping through construction
and the subsequent 30 years of operation. The opening year will be 2027, with the final year of
analysis concluding in 2056.

3
    gov.beltline.org
4
    FHWA (2013). https://safety.fhwa.dot.gov/ped_bike/tools_solve/fhwasa13037/chap6.cfm.

                                                       APPENDIX A: BENEFIT-COST ANALYSIS - 4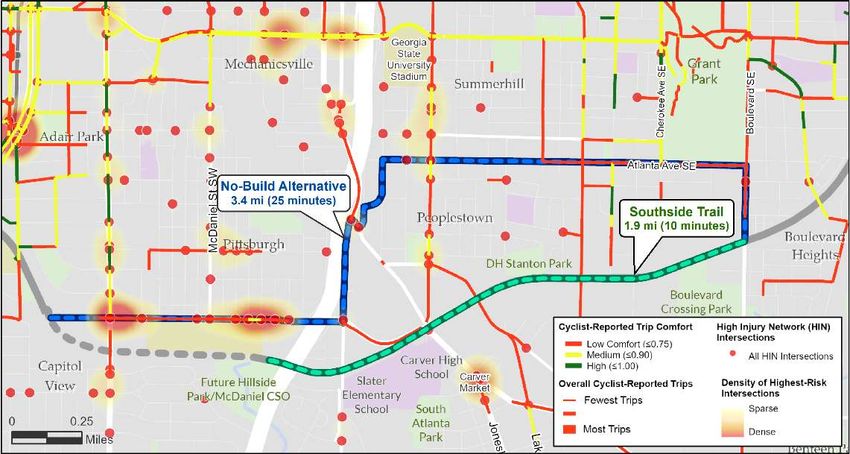
Southside Trail Project RAISE Grant

   3.3. Inflation and Discounting Adjustments
The BCA analysis incorporates the USDOT’s guidelines for inflation adjustments in the
calculations of the benefits and costs. All benefits and costs are estimated in 2019 dollars with
future dollars discounted in compliance with RAISE, using a 7% real rate for all categories except
Carbon Dioxide CO2 emissions, which will use a 3% real rate. Below are the assumptions that
were applied in the BCA model to ensure costs and benefits were accurately reflected:
   -   The costs and benefits in this BCA analysis correspond to the effects of the full build-out
       of the SST project.
   -   Input prices are in 2019 dollars.
   -   Analysis begins in 2016 (Scoping) and ends in 2056. Project development and
       construction are assumed in 2016 – 2026, with O&M covering the entire 30-year period
       from 2027 – 2056.
   -   The first year of benefits is 2027 and no ramp-up benefits are assumed for 2026.
   -   A 7% real discount rate is assumed throughout the period of analysis, except for carbon
       dioxide (CO2) emissions savings, which use a 3% real discount rate.
   -   Tree planting emissions benefits are not assumed for the first 10 years of the project, and
       will not start until 2037 to account for tree maturity.

   3.4. Demand Estimation
                Existing Demand
Existing trail usership along the Atlanta BeltLine Eastside and Westside trails is measured from
automatic counters that have been recording activity on the Eastside trail since 2013 and Westside
trail since 2017. Trip data is managed by Atlanta BeltLine and validated quarterly by EcoCounter
data services. The data are used to estimate hourly trail pedestrian and cyclist traffic at several
locations along each trail. Previous work conducted by staff from the Atlanta BeltLine employed
intercept surveys to estimate the share of cyclists who use the trail for commuting.
The Atlanta BeltLine has grown in popularity over the years as an enhanced mobility option,
with the number of users growing well beyond the City of Atlanta’s population growth rate from
2000 – 2019 (0.81%), as can be seen in Table 2 and Figure 3. Notably, there was a decrease in
trail usership for 2020 compared to previous years. This was due to the COVID-19 pandemic,
though for the months of January and February 2020, the number of users was higher than
January and February of 2019, suggesting that more users were continuing to utilize the trail
until the City of Atlanta went into lockdown and people started to stay home. However, even
with the number of cautious people staying home, the trail still had more users in 2020 than it did
in 2018, following a national trend for people getting outdoors for recreation during the
pandemic.

                                                APPENDIX A: BENEFIT-COST ANALYSIS - 5
Southside Trail Project RAISE Grant

Table 2: Historical Trail Demand on the Atlanta BeltLine’s Eastside and Westside Trails

                                           Total Annual Trips –         Average Daily Trips –
                           Year                                                                 Annual % Growth
                                                 All Users                   All Users

           2014 (Eastside Only)                  1,193,111                      3,269                   -

           2015 (Eastside Only)                  1,300,331                      3,563                 9%
           2016 (Eastside Only)                  1,723,426                      4,722                 33%
                           2017                  1,984,416                      5,437                 15%
                           2018                  1,988,189                      5,447                 0%
                           2019                  2,478,862                      6,791                 25%
                           2020                  2,172,635                      5,592                -12%
Source: EcoCounters at Ponce City Market (Eastside Trail) and Allene Avenue Southwest (Westside Trail)

Figure 3: Total Eastside and Westside Trail Activity Over Time

                                                   Trail Use Activity Over Time
           250,000                                                                                            3
                                                                                                              3
           200,000
                                                                                                              2

                                                                                                                   % Growth in Trips
Number of Trips

           150,000                                                                                            2
                                                                                                              1
           100,000                                                                                            1
                                                                                                              0
                  50,000
                                                                                                              -1
                      0                                                                                       -1
                           January 2014
                              April 2014

                           October 2014
                           January 2015
                              April 2015

                           October 2015
                           January 2016
                              April 2016

                           October 2016
                           January 2017
                              April 2017

                           October 2017
                           January 2018
                              April 2018

                           October 2018
                           January 2019
                              April 2019

                           October 2019
                           January 2020
                              April 2020

                           October 2020
                           January 2021
                              July 2014

                              July 2015

                              July 2016

                              July 2017

                              July 2018

                              July 2019

                              July 2020

                                  Annual Growth (Month over Month)          Number of Trips
                                  12 per. Mov. Avg. (Number of Trips)

                                                                  APPENDIX A: BENEFIT-COST ANALYSIS - 6
Southside Trail Project RAISE Grant
Forecasting Future Demand
Using the existing demand as a foundation, future demand for cyclists and pedestrians along the
project is calculated using methodology from the The National Cooperative Highway Research
Program (NCHRP) Report 552: Guidelines for Analysis of Investments in Bicycling Facilities 5 as
well as from existing counters along the Atlanta BeltLine’s Eastside and Westside trails. There are
three parameters used to provide assumptions for statistics involving commuter and recreational
demand for the new trail. The first focuses on the population within 400, 800, and 1,600 meters
(.25, .5, and 1 mile, respectively) of the SST project to remain consistent with the NCHRP report.
However, since the Atlanta BeltLine has existing counts along the abutting edges of the project,
existing average daily counts were used to determine the existing users that would continue onto
the project.
The NCHRP also provides assumptions for calculating the commuter statistics for pedestrians and
cyclists. The report assumes that 80% of residents are adults, and based on national averages, 50%
of adults commute which equates to 40% of the adult population commuting. These proportions
are used to determine the bicycle and pedestrian commuters along the trail. To bring this
calculation closer to City of Atlanta factors, U.S Census QuickFacts 6 data was used to determine
that the adult population of Atlanta is 76.4%, and with 50% of adults commuting provides us with
an estimate of 38.2% of Atlanta’s population commuting to work. In preparation for the USDOT
RAISE Grant, the Atlanta BeltLine conducted intercept surveys in 2021 along the Eastside and
Westside BeltLine trail on May 18th, 20th, 22nd, and 23rd to determine the percentage of those using
the BeltLine to commute. The sample size of 422 users, out of 1,841 average daily users, has a
95% confidence level with a 4% margin of error making the survey statistically significant. It was
found that 11.7% of those surveyed used the BeltLine to commute to work. This is a conservative
estimate as only those who volunteered to stop and be surveyed had their responses recorded, and
the value is almost a quarter of what the NCHRP recommends using for the calculation.
Using the same Atlanta BeltLine intercept surveys, the bike commuter share is estimated to be
3.27% of the BeltLine users. This is close to the 2.7% estimate found based on Public Use
Microdata Areas (PUMA) for the Fulton County (East) – Atlanta City (Southeast) 7 area that covers
the project area. Similarly, the pedestrian commuter share is estimated to be 8.4% based on
intercept surveys, which is close to the 7.28% estimate found based on the PUMA data. Using
these percentages, it is estimated that there are currently 39 existing bike commuters and 100
pedestrian commuters within the project capture area. Had the NCHRP formulas been used without
applying local data, there would have been 294 existing bike commuters and 794 existing
pedestrian commuters, showcasing the conservative approach this analysis has taken. The Atlanta
5
Krizek, K. J. (2006). Guidelines For Analysis Of Investments In Bicycle Facilities (Vol. 552). Transportation
Research Board.
6
United States Census Bureau (2021). Atlanta city, Georgia; Georgia. Retrieved from
https://www.census.gov/quickfacts/fact/table/atlantacitygeorgia,GA/PST045219.
7
United States Census Bureau (2021). B08301: Means of Transportation to Work. Retrieved from
https://data.census.gov/cedsci/table?q=Means%20of%20transportation%20to%20work&text=B08301&g=7950000
US1301007&tid=ACSDT1Y2019.B08301&hidePreview=true.
APPENDIX A: BENEFIT-COST ANALYSIS - 7Southside Trail Project RAISE Grant
8
Regional Commission’s (ARC) Walk.Bike.Thrive! Report, indicates that the greater Atlanta area
had a 4.7% pedestrian commute rate and a 0.8% bike commute rate. Based on these values, the
PUMA value approximations are practical considering the density of the project area.
The growth rates of both pedestrians and cyclists along the trail were determined by analyzing the
change in pedestrian and bike commuters between the American Community Survey (ACS) 2015
5-Year Commuting Characteristics by Sex and ACS 2019 5-Year Commuting Characteristics by
Sex9 values. This resulted in a 12.6% increase in bike commuters and 3.6% increase in pedestrian
commuters. However, to remain conservative, the project area’s population growth rate of 0.14%
was assumed for the increase in cyclists and pedestrians.
Additional demand estimates were taken from the ARC’s regional Travel Demand Model
associated with the current Regional Transportation Plan (RTP), The Atlanta Region’s Plan. This
model was calibrated and validated using the latest Regional Household Travel Survey and the
Regional On-Board Transit Survey. It was further determined by FHWA’s Travel Model
Improvement Program (TMIP) in the peer review, which was conducted on the 28th and 29th of
September 2017, as a state-of-the-art model for forecasting future travel patterns and demands.
The ARC’s model was used to estimate the average trip lengths (excluding interstates) within
1,600 meters of the project for the models 2020 horizon year. This value was calculated to be 6.51
miles per trip. However, this average includes trips taken in suburban areas of Atlanta. Thus, the
value was halved to 3.25 miles per trip to account for the urban setting of the SST. Finally, it was
assumed that active transportation commuters will bike or walk 160 days out of the year. This was
calculated by taking the number of working days, 260, and subtracting 25 days for holidays and
vacations and 75 days for rain/inclement weather based on historical weather information. 10 Table
3 summarizes the key information for the input data.
Table 3: Key Assumptions
Key Assumptions Values Source
Existing Adult
1,841
Daily Users
New Adult Daily
1,512 Atlanta BeltLine Intercept Surveys in
Users
Project Users May 2021 on the Eastside and
Existing Adult
215 Westside BeltLine Trail
Daily Commuters
New Adult Daily
176
Commuters
8
Atlanta Regional Commission (2020). Walk.Bike.Thrive! A Regional Vision for a More Walkable, Bikeable, and
Livable Metropolitan Atlanta. [PDF File]. Retrieved from https://cdn.atlantaregional.org/wp-
content/uploads/2016/05/walkbike-thrive-part-2-final-web-.pdf
9
United States Census Bureau (2020). S0801: Commuting Characteristics by Sex. Retrieved from
https://data.census.gov/cedsci/table?q=commute&tid=ACSST5Y2018.S0801&vintage=2018.
10
National Centers for Environmental Information (2021). Global Summary of the Month Location Details.
Retrieved from https://www.ncdc.noaa.gov/cdo-web/datasets/GSOM/locations/FIPS:13121/detail.
APPENDIX A: BENEFIT-COST ANALYSIS - 8Southside Trail Project RAISE Grant
Key Assumptions Values Source
Project Users Commuter Percentage 11.7%
Atlanta BeltLine Intercept Surveys in
Adult Bike Commuter Percentage 3.27% May 2021 on the Eastside and
Adult Pedestrian Commuter Westside BeltLine Trail)
8.4%
Percentage
ACS 2000 – 2019 Block Group
Project Area Population Growth 0.14% Population Data Surrounding
Southside Trail
Average Trip Length (in miles) 6.51 ARC RTP Model
Conservative Trip Length (in miles) 3.25 ARC RTP Model
Weekday Peak Vehicular Occupancy
1.48 USDOT BCA Guidelines
(in persons)
Average Vacation/Holiday Time and
Days Commuting by Biking or
160 National Centers for Environmental
Walking
Information
4. Costs
4.1. Capital Expenditures
The capital expenditures are the primary expenditures for this analysis. The costs for the project
include scoping and preliminary engineering, right-of-way (ROW) acquisition, utility relocation,
and an estimated $39 million for construction.
The project will require an estimated $57,998,748 in expenditures in which $5,533,222 has been
expended in scoping and preliminary engineering; $10,831,225 has been committed for right-of-
way acquisition; $2,768,560 has been committed for utility relocation; and $38,865,641 for
construction between 2024 and 2026. All preconstruction and construction activities are the
responsibility of the City of Atlanta and Atlanta BeltLine. The SST schedule of expenditures is
summarized in Table 4.
Scoping and preliminary engineering includes NEPA clearance, National Pollutant Discharge
Elimination Systems (NPDES), and Stormwater Permits. The construction category includes all
construction costs for the trail as well as project advertisements and biddings.
Table 4: Atlanta BeltLine Southside Trail Cost Categories Schedule
Cost
Scoping, PE ROW Utility Construction Total
Categories
2016 $885,420.36 $1,969,065.00 - - $2,854,485.36
2017 $885,420.36 $1,969,065.00 - - $2,854,485.36
2018 $885,420.36 $1,969,065.00 - - $2,854,485.36
2019 $885,420.36 $1,969,065.00 - - $2,854,485.36
APPENDIX A: BENEFIT-COST ANALYSIS - 9Southside Trail Project RAISE Grant
Cost
Scoping, PE ROW Utility Construction Total
Categories
2020 $885,420.36 $1,969,065.00 - - $2,854,485.36
2021 $916,963.20 $785,900.00 $1,710,00 - $3,412,863.20
2022 $126,171.00 $200,000.00 $1,058,560 $1,384,731.00
2023 $63,086.00 - - $63,086.00
2024 - - - $9,000,000.00 $9,000,000.00
2025 - - - $20,600,000.00 $20,600,000.00
2026 - - - $9,265,641.00 $9,265,641.00
Total $5,533,222 $10,381,225 $2,768,560 $38,865,641 $57,998,7478
The City of Atlanta and Atlanta BeltLine staff have already identified the majority of the funds as
outlined in Table 5 for the creation of this project.
Table 5: Atlanta Beltline Southside Trail Construction Funding Sources
Proposed Funding Construction % Financed
Fund Name
Sources Expense ($2020) by Source
RAISE 2021 RAISE Discretionary Grant $22,000,000 57%
Transportation Improvement
Program (TIP) Federal Formula $4,000,000 10%
Funding
Other Federal Funds House Transportation and
Infrastructure Member Designated
$5,000,000 13%
Project or Congressionally Directed
Spending
Atlanta BeltLine Tax Allocation
$865,641 2%
District (TAD)
Atlanta BeltLine Multi-Use Trail
Non-Federal Funds $3,500,000 9%
Special Service District (SSD)
Atlanta BeltLine Partnership –
$3,500,000 9%
Philanthropic Community
Total Project Budget $38,865,641 100%
4.2. Operations and Maintenance
The operations and maintenance (O&M) costs were provided by the City of Atlanta as they oversee
the O&M for the Eastside and Westside Trails. The historical costs for O&M of the existing trails
are based on acreage, with the trail containing a total of 21.4 acres. Historically, the first two years
of O&M cost $15,000 per acre, with each subsequent year costing $4,500 - $5,000 per acre.
For this BCA analysis, the O&M costs in the subsequent years costs were increased and are higher
than the historical data to cover future capital improvements (10%), overhead for managing
maintenance (15%), and covering a higher level of service (25%). Based on these assumptions the
APPENDIX A: BENEFIT-COST ANALYSIS - 10Southside Trail Project RAISE Grant
subsequent years (year 3-30) of O&M along the SST will cost $6,700 per acre. The resulting O&M
costs are represented in Table 6.
Table 6: Operations & Maintenance Cost
2027 – 2028 (Per 2029 – 2056 (Per
Cost Category Total 30 Year O&M
Year) Year)
Operations &
$321,000 $143,380 $4,656,640
Maintenance
5. Benefits
The SST BCA is based on proven national research conducted in previous studies related to multi-
use and recreational trail benefits, while also incorporating statistically significant findings, proven
methodologies, and national averages from the U.S. Census, American Community Survey, and
other data sources relevant to the City of Atlanta.
The BCA approach monetizes the annual benefits, including safety benefits, travel time savings,
environmental benefits, and quality of life benefits that will result from completion of the project,
summarizes the annual benefits over 30 years, adjusts for inflation, and then discounts the values
to present value. The present value benefits and associated costs were then compared to determine
the BCR and Net Present Values (NPV).
There are two primary documents used during this analysis to define the benefits to immediate
users of the trail. The first is NCHRP: Report 552, which details demand calculations as well as
monetizes the associated benefits and provides formulas and assumptions for calculating the
benefits related to recreation, health, and safety. The second document is the 2021 USDOT’s
Benefit-Cost Analysis Guidance for Discretionary Grant Programs, which provides recommended
values for vehicular emissions and safety benefits.
Based on the available information, the value from constructing the SST and quantifiable benefits
included in the analysis are:
- Safety Benefits
o Reduction in Vehicular Crashes
o Reduction in Bike and Pedestrian Crashes
- Travel Time Savings
o Reduction in Trip Length
- Environmental Benefits
o Reduction in Emissions from Mode Shift
o Reduction in Emissions from Tree Planting
- Quality of Life Benefits
o Reduction in Mortality Rates
o Increase in Bike and Pedestrians Users
The project is expected to generate benefits for both trail users (including cyclists, pedestrians, and
shared mobility devices) and non-users (including remaining road users, local businesses, and
APPENDIX A: BENEFIT-COST ANALYSIS - 11Southside Trail Project RAISE Grant
property owners). Only benefits to pedestrian and cyclist trail users are estimated in this analysis
due to incomplete information on the number of additional users by scooter and their value of
mobility. It is thought, though, that their usage of the trail would substantially increase the value
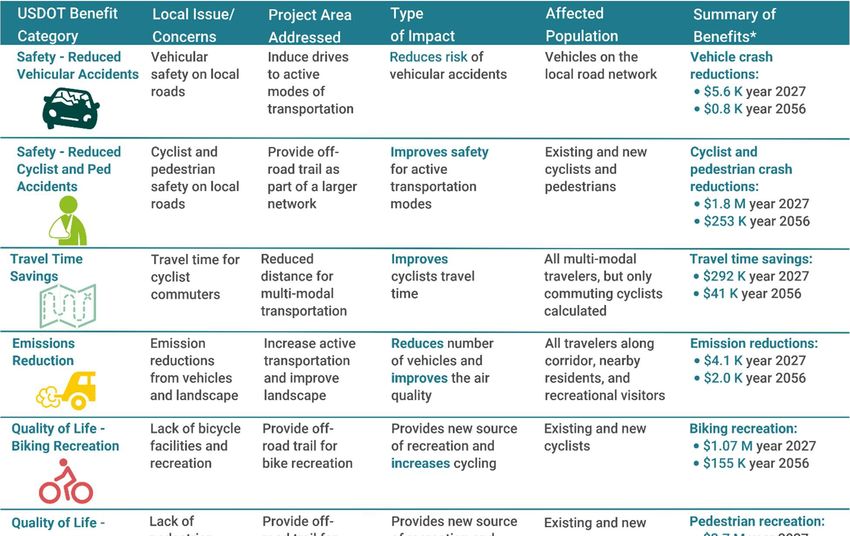
of the trail. The methodology and quantified benefits are listed below. An overview of the benefits
and their anticipated discounted values in the opening and final year of analysis are provided are
listed in Figure 4.
Figure 4: Associated Project Benefits
APPENDIX A: BENEFIT-COST ANALYSIS - 12Southside Trail Project RAISE Grant
5.1. Safety Benefits
Currently, most cyclists in the project area travel along sidewalks or ride on busy streets due to a
lack of bike lanes in the area. At the same time, pedestrians must cross busy intersections, many
of which are unsignalized. Figure 5 presents a map of crashes (by mode) recorded within 800
meters of the project extent in the last five years. Expanding to a slightly larger extent, Figure 6
overlays high-risk intersections found in the City of Atlanta’s High-Injury Network (HIN) 11 with
stressful routes identified by local cyclists through the Ride Report app. 12 The map underscores
that the proposed trail would address an urgent need for a safe east-west connection across
Atlanta’s Southside for pedestrians and cyclists traveling to work, school, commercial nodes, and
recreational opportunities. Figures 4 and 5 also highlight that the project would prove to be a safer
option for both cyclists and pedestrians as it provides a mode choice separated from traffic. A key
factor in the success of the existing Atlanta BeltLine’s Eastside and Westside trails today is their
safety from vehicular traffic, which helps to explain the trails high demand forecasts.
Figure 5: 5-Year Crashes Within 800m of the Project
11
City of Atlanta (2018). Atlanta’s Transportation Plan: Final Report. PDF retrieved from
https://www.atlantaga.gov/home/showpublisheddocument/48083/637353603332230000.
12
Street segments indicated in red represent routes rated as below-average by Atlanta-area cyclists through the Ride
Report smartphone app. In the underlying heat map, “hot spots” indicate concentrations of HIN intersections but are
also weighted by the severity of the intersection’s risk score (high, higher, and highest).
APPENDIX A: BENEFIT-COST ANALYSIS - 13Southside Trail Project RAISE Grant
Figure 6: City of Atlanta High-Injury Network Intersections in Last 5 Years
The number of vehicular and pedestrian/cyclist crashes avoided due to the project were calculated
using the 2021 USDOT’s Benefit-Cost Analysis Guidance for Discretionary Grant Programs for
monetized values of injury and fatal crashes. Crash data within 800 meters of the project for the
last five years (2015 – 2019) was averaged for fatal, injured, and property damage only. Crash data
for 2020 was not utilized in this analysis since it was not available. The total accidents were 2,063
for the study area after removing accidents associated with the I-75/I-85 freeway, as seen in Table
7. Using this data, the five-year average for pedestrians, cyclists, and vehicles were calculated in
Table 8.
Table 7: 5-Year Crash Averages (2015-2019)
Crashes Pedestrian Cyclists Vehicle
Fatal 1 0 1
Injury 11 1 462
Others 3 1 1,583
Source: Numetric13
Table 8: 5-Year Crash Rates (2015-2019)
Crash Rate by Type Pedestrian Cyclists Vehicle
Fatal 0.2 0 0.05
Injury 2.2 0.2 23.71
Others 0.6 0.2 81.23
13
Numetric (2021). Retrieved from https://gdot.numetric.com/signin?returnUrl=%2Fcrash-query.
APPENDIX A: BENEFIT-COST ANALYSIS - 14Southside Trail Project RAISE Grant
For pedestrian and cyclist crashes, the analysis assumes a 100% crash reduction rate since
pedestrians and cyclists will no longer travel along local roads to reach destinations and will utilize
the grade separated trail. For vehicular crashes, the crash rates were reduced by the “Reduced
Miles Per Year” growth rate from 2030 to 2050. The crashes avoided by mode are seen in Table 9
for 2030 and 2050. No growth was assumed for pedestrian or cyclist crashes, and thus these crash
rates will remain consistent over the SST project life. Only the crash rates for vehicles will change
over the project as these values are based on mode shifts over time.
Table 9: Crashes Avoided by Mode
No Growth Assumed 2030 2050
Crash Type
Pedestrian/Cyclists Vehicles Vehicles
Fatal 0.20 0.00 0.00
Injury 2.40 0.03 0.03
Others 0.80 0.10 0.11
Applied to the 2021 USDOT’s Benefit-Cost Analysis Guidance for Discretionary Grant
Programs cost per accident values of $12,071,000 for fatalities, $284,100 for injuries, and
$4,500 for others, the value of the crashes avoided are presented in Table 10.
Table 10: Value of Crashes Avoided in $2019
No Growth Assumed 2030 2050
Crash Type
Pedestrian/Cyclists Vehicles Vehicles
Fatal $2,414,200 $784 $807
Injury $681,840 $8,529 $8,771
Others $3,600 $463 $476
Total $3,099,640 $9,776 $10,053
The following benefits were realized for cyclists and pedestrians, as well as vehicles, in Table 11.
Table 11: Reduced Cyclist/Pedestrians and Vehicular Accidents Benefits
In Project Opening Over Project Lifecycle (2027 -2056)
Year (2027) In Constant Dollars Discounted at 7%
Reduced
Cyclist/Pedestrian $3,099,640 $92,989,200 $23,953,180
Accident Costs
Reduced Vehicular
$9,730 $298,060 $76,270
Accident Costs
Total Safety Benefits $3,109,370 $93,287,260 $24,029,450
APPENDIX A: BENEFIT-COST ANALYSIS - 15Southside Trail Project RAISE Grant
5.2. Travel Time Savings
By constructing the SST project, trip lengths for pedestrians and bicyclists will be shortened.
Currently, for users to go from the Eastside trail to the Westside trail, they have to take the No-
Build route shown in Figure 7. The path was determined using Google Maps to find the shortest
pathway and shows that there are currently no bike lanes along the route. The starting location
for the No-Build scenario was determined to be at the existing Atlanta BeltLine connection to
University Avenue since there is no direct connection from the western segment of the trail’s
origin to the local roadway network. This assumes that existing commuters know the trail ends
and would get off at the connection which would provide them with the shortest path instead of
doubling back from the dead-end of the current trail section. 14 The map also highlights the high-
injury network indicating that the No-Build pathway is highlighted by several HIN intersections.
Figure 7: Eastside to Westside Trail Pathway Scenarios
The methodology for calculating the annual travel time savings is as follows:
Annual Travel Time Savings = Marginal Detour Time * Daily Users * Hourly Value of Time *
Annualization Factor
The construction of the SST, or the Build scenario, would consist of a trip length of 1.9 miles.
Without the SST, the trip from the Eastside to the Westside trail would take 3.4 miles. Thus, the
marginal detour time is 1.5 miles. There was no local data available for average bicyclist travel
speeds, so a national average was evaluated. It was found that typical bicyclist speeds within an
urban setting are 12 – 18 miles per hour (mph) 15, though 11.8 mph was selected based on the
14
City of Atlanta (2021). Cycle Atlanta: Phase 1.0 Study: A Supplement to the Connect Atlanta Plan.
https://www.atlantaga.gov/Home/ShowDocument?id=18426.
15
Bernardi, Silvia and Federico Rupi. An Analysis of Bicycle Travel Speed and Disturbances on Off-Street and On-
Street Facilities (2013).
APPENDIX A: BENEFIT-COST ANALYSIS - 16Southside Trail Project RAISE Grant
16
calculations from the USDOT hypothetical BCA example. 2.38 mph was used for the
pedestrian commuter speed, which comes from the Manual of Uniform Traffic Control Devices
(MUTCD).17
Table 12: Marginal Detour Time
Inputs Values
No-Build Distance 3.4 miles
Build Distance 1.9 miles
Difference 1.5 miles
Bicyclist Speed 11.8 mph
Pedestrian Speed 2.38 mph
To ensure there is no double-counting of benefits applied to users of the SST, the daily users
were calculated by only taking into consideration those who would use it for commuting. To
remain conservative, no growth was assumed for bicycle or pedestrian commuters over the life
of the project.
Table 13: Daily Users
Number of Commuting Number of Commuting
Commuter Details
Bicyclists Pedestrians
Existing Adult Commuters* 60 155
Source: *Table 22 in Cyclist and Pedestrian Recreation Benefits
The hourly value of time was taken from 2021 USDOT’s Benefit-Cost Analysis Guidance for
Discretionary Grant Programs Table A-3: Value of Travel Time Savings, which estimates
cycling at $33.00 per hour. The annualization factor was calculated in Table 3, which found that
commuters would walk or bike 160 days out of the year.
Using the described formula, the benefits from travel time savings were carried over for the
duration of the analysis period and are summarized in Table 14. On a yearly basis, the SST would
save 1,235 bicycle and 13,986 pedestrian person hours for commuters in Atlanta.
Table 14: Total Travel Time Savings
In Project Opening Over Project Lifecycle (2027 -2056)
Year In Constant Dollars Discounted at 7%
Total Travel Time
$502,288 $15,068,641 $3,881,540
Savings
16
USDOT (2021). Preparing a Benefit-Cost Analysis for RAISE Grants.
https://www.transportation.gov/sites/dot.gov/files/2021-05/RAISE%2BGrants%2BPreparing%2Ba%2BBenefit-
Cost%2BAnalysis%2B5-6-21.pdf.
17
MUTCD (2009). Chapter 4E Pedestrian Control Features. https://mutcd.fhwa.dot.gov/htm/2009/part4/part4e.htm.
APPENDIX A: BENEFIT-COST ANALYSIS - 17Southside Trail Project RAISE Grant
5.3. Emissions Savings
By inducing commuters to active modes of transportation, the SST has the potential to reduce the
number of vehicles on the road, which would improve air quality through the reduction in auto
use. Additionally, through the planting of new trees, the SST has the potential to further reduce
carbon dioxide (CO2) and nitrogen oxide (NOx) emissions through sequestration. The
methodology for the modal shift reduced CO 2 and NOx emissions is as follows:
Reduction in Emissions = ((Annual Commuter Trips * Average Trip Length) / Conversion
Factor) * Emission Rate by Mile / Weekday Peak Occupancy of Commuters
The methodology for the tree planting reduced CO 2 and NOx emissions is as follows:
Reduction in Emissions = (New Trees Planted – Old Growth Trees Removed) * Conversion
Factor
The new adult daily commuters were calculated in Table 22 for the cyclists and pedestrian demand
calculations. Using the average trip length from Table 3, it is assumed that 56,464 annual vehicular
commuter trips will be removed with the new trail, as can be seen in Table 15. The conversion
factors to convert the emissions into their correct form, as well as the emissions rates per pollutant,
can be found in Table 16 and Table 17, respectively.
Table 15: Emissions Reduction Inputs
Commuter Details Modal Shift
New Adult Daily Commuters* 176
Annual Commuter Trips 56,464
Average Trip Length 6.51
Conservative Average Trip Length 3.25
Weekday Peak Occupancy of Commuters1 1.48
Source: *Table 22 in Cyclist and Pedestrian Recreation Benefits
Table 16: Conversion Factors
Grams in Metric Ton 1,000,000.00
Pounds in Metric Ton 0.000453592
Table 17: Emissions Rates per Mile
Vehicle Type Auto Emissions (Grams per mile per car)
NOx Emissions per mile18 1.39
CO2 Emissions per mile18 411
18
United States Environmental Protection Agency (2020). Average Annual Emissions and Fuel Consumption for
Gasoline-Fueled Passenger Cars and Light Trucks. PDF retrieved from
https://nepis.epa.gov/Exe/ZyPDF.cgi/P100EVXP.PDF?Dockey=P100EVXP.PDF.
APPENDIX A: BENEFIT-COST ANALYSIS - 18Southside Trail Project RAISE Grant
Source: United States Environmental Protection Agency (2020)
The 2021 USDOT’s Benefit-Cost Analysis Guidance for Discretionary Grant Programs Table A-
6 for damage costs associated with CO2 and NOx were used for calculating the emissions savings
from reducing vehicular usage by inducing commuters to bike and walk to work. The values for
dollars per metric ton are presented below in Table 18.
Table 18: Damage Cost Per Metric Ton of NOx and CO2
Year NOx CO2
2026 $17,000 $57
2027 $17,300 $58
2028 $17,500 $59
2029 $17,700 $60
2030 $18,000 $61
2031 $18,000 $62
2032 $18,000 $73
2033 $18,000 $74
2034 $18,000 $66
2035 $18,000 $67
2036 $18,000 $68
2037 $18,000 $69
2038 $18,000 $70
2039 $18,000 $71
2040 $18,000 $72
2041 $18,000 $73
2042 $18,000 $75
2043 $18,000 $76
2044 $18,000 $77
2045 $18,000 $78
2046 $18,000 $79
2047 $18,000 $80
2048 $18,000 $81
2049 $18,000 $83
2050 $18,000 $84
Source: 2021 USDOT’s Benefit-Cost Analysis Guidance for Discretionary Grant Programs
The Atlanta BeltLine aims not only to improve transportation, but also to improve the natural
landscaping surrounding the project. Tree planting data for the project was calculated by each
tree type and inserted into the iTree Tree Planting software to determine the estimated
sequestration of CO2 and reduction in NOx after taking the delta between the No-Build and Build
APPENDIX A: BENEFIT-COST ANALYSIS - 19Southside Trail Project RAISE Grant
tree scenarios. Benefits for trees were only taken starting in 2037 to account for the growth in
tree diameters to benefit emissions reductions. Table 19 displays the increase in emissions
reduced with the scheduled tree plantings.
Table 19: Tree Planting Emissions Reduction between No-Build and Build Scenarios
CO2 Sequestered (in
Per Year Emissions NOx Reduced (in pounds)
pounds)
No-Build (Per Year) 93.30 126,701
Build (Per Year) 138.37 142,419
Increase in Emissions Reduced
45.07 15,719
Per Year
Based on the reduced vehicular trips and tree plantings, the project is estimated to save 0.20
metric tons of NOx and 59.17 metric tons of CO2, as can be seen in Table 20.
Table 20: Annual Emissions Reduction by Pollutant
Modal Shift - 2030 (Metric Tree Plantings - 2037
Year
Tons) (Metric Tons)
NOx emissions 0.18 0.02
CO2 emissions 52.04 7.13
Using the project areas projected growth rate of 0.14% to grow the modal shift values, but not the
tree planting values, the benefits from reduced emissions were carried over for the duration of the
analysis period and are summarized in Table 21.
Table 21: Total Reduced Emissions Savings
Over Project Lifecycle (2027 -2056)
In Project Opening
Year Discounted at 7%
In Constant Dollars
(3% for CO2)
Total Reduced
$6,040 $232,465 $91,350
Emissions Savings
5.4. Quality of Life Benefits
The proposed SST project is expected to achieve three of the USDOT’s quality of life guidelines:
- Increased Recreational Cyclists
- Increased Recreational Pedestrians
- Increased Health Benefits from Active Transportation
The proposed methodologies used for each are described in the following sections.
APPENDIX A: BENEFIT-COST ANALYSIS - 20Southside Trail Project RAISE Grant
Cyclist and Pedestrian Benefits
The number of new recreational cyclists and pedestrians expected to use the proposed trail were
analyzed to determine the recreational benefits for these groups. The NCHRP 552 Report provided
the following formulas for calculation:
Number of Adult Commuters = R * 0.4
Daily Existing Commuters = R * C * 0.4
T(moderate) = 0.4 +1.2C
Existing Users = R * T * C
Ld = Distance from Project (L(400m) = 2.93, L(800m) = 2.11, L(1600m) = 1.39)
New Adult Users = ∑ (Existing Adult Users * (Ld - 1)
New Commuters = ∑ (Existing Commuters * (Ld - 1)
New Recreational Users = New Adult Users - New Commuters
Where:
- R = Population in Buffers of 1600, 800, 400 Meters from the Project
- C = Commuter Share (Cyclists or Pedestrians)
- T = Total Adult Bicycling Rates by Low, Moderate, or High Rates (Moderate was used
for this analysis)
- Ld = Likelihood Multiplier for Determining Project Usage Based on Distance
As noted in the key assumptions section, the formula assumes that 80% of the population are adults
and 50% of them commute to work, and thus 40% of the population commutes to work. To bring
this calculation closer to City of Atlanta factors, U.S Census QuickFacts 19 data was used to
determine that the adult population of Atlanta is 76.4%, and with 50% commuting provides us
with an estimate of 38.2% of Atlanta’s population commuting to work. In preparation for the
USDOT RAISE Grant, the Atlanta BeltLine conducted intercept surveys along the Eastside and
Westside BeltLine trail on from May 18th to 23rd. It was found that 11.7% of those surveyed used
the BeltLine to commute to work (C). This is a conservative estimate as only those who
volunteered to stop and be surveyed had their responses recorded, and the value is almost a quarter
of both what the NCHRP recommends and the City of Atlanta’s adult population that commutes.
Figure 8 displays the zip code origins of those surveyed as part of the intercept surveys. As can be
seen, more than half of those surveyed live next to and use the trail system.
19
United States Census Bureau (2021). Atlanta city, Georgia; Georgia. Retrieved from
https://www.census.gov/quickfacts/fact/table/atlantacitygeorgia,GA/PST045219.
APPENDIX A: BENEFIT-COST ANALYSIS - 21Southside Trail Project RAISE Grant
Figure 8: Eastside and Westside Intercept Survey – Zip Codes of Users
Using the same Atlanta BeltLine intercept surveys, the bike commuter share is estimated to be
3.27% of the BeltLine users. This is close to the 2.7% estimate found based on PUMA for the
Fulton County (East) – Atlanta City (Southeast) area that covers the project area. Similarly, the
pedestrian commuter share is estimated to be 8.4% based on intercept surveys, which is close to
the 7.28% estimate found based on the PUMA data.
Figure 9: Eastside BeltLine Users in Winter NCHRP 552 assumes a series of calculations
to get the adult bicycling and pedestrian rates.
Since the Atlanta BeltLine has permanent trip
counters at over eight locations along the
Eastside and Westside BeltLine, the trip
counts directly abutting the east and west
ends of the project at Allene Boulevard and
Wylie Street were utilized instead. To
calculate the growth for new adult users, the
historical growth rate for the trail segments
abutting the project were used. Based on the
counts, the total existing users and commuters,
as well as new users and commuters, are summarized in Table 22. An estimated 1,841 daily trips
were recorded on the Atlanta BeltLine’s Eastside and Westside trails in 2020. Despite the
pandemic, there was a 48% increase in trail users from 2019 to 2020, showcasing the BeltLine’s
vitality and value to the community. With the new project, it is estimated there will be an additional
APPENDIX A: BENEFIT-COST ANALYSIS - 22Southside Trail Project RAISE Grant
1,512 new adult users on this new section of the Atlanta BeltLine, which is conservative compared
to historical values.
Table 22: Adult Cyclist and Pedestrian Demand
2019 Values
Daily Users
Bike Pedestrians
Existing Adult Users 516 1,326
New Adult Users 423 1,089
Existing Adult Commuters 60 155
New Adult Commuters 49 127
New Adult Recreationalists 374 962
The new adult recreationalists for bikes and pedestrians were calculated by taking the difference
between the new adult users and the new adult commuters. Based on the ACS 2015 and 2019 5-
Year Commute to Work data, it was found that there has been a 12.6% growth in cyclists and a
3.6% growth in pedestrians over the last five years. However, the analysis remains conservative
and uses the US Census Block Groups population data for the SST project area from 2000 to 2019
which assumes a 0.14% growth in cyclist and pedestrian commuters for the area. Due to the
construction of this project, it is assumed that the bike and pedestrian growth in the area will be
higher, similar to the historic trends along the Atlanta BeltLine’s Eastside and Westside trails
(historical growth rates from 2018 to 2019 of 32% pedestrians and 21% cyclists between both
trails).
Figure 10: Eastside BeltLine Users in The NCHRP 552 Report utilizes a value of
Summer $10 for every hour of recreation per new adult
recreationalists, multiplied by 365 days in a
year. As the NCHRP 552 Report value is
from 2004, it was adjusted for inflation based
on the 2021 USDOT’s Benefit-Cost Analysis
Guidance for Discretionary Grant Programs
to $13.24. Applying the population growth
rate to the number of new adult
recreationalists over the 30-year project
analysis, along with the value per
recreationalist, the following benefits were
realized for cyclists and pedestrians in Table
23. To show how conservative our estimates
are utilizing the locally applied data, which
misses information due to intercept surveys not capturing all users, the recreational values
APPENDIX A: BENEFIT-COST ANALYSIS - 23You can also read