LOCAL ECONOMIC REPORT - SPRING 2020 - Sonoma County ...
←
→
Page content transcription
If your browser does not render page correctly, please read the page content below

SPRING 2020
LOCAL ECONOMIC REPORT

  FORECAST REPORT   2020

ECONOMIC DEVELOPMENT BOARD
     DIRECTORS
     BOARD OF

                 KATHRYN HECHT, CHAIR    JORGE ALCAZAR       SKIP BRAND
                 PAM CHANTER TERRI DENTE       TERRY GARRETT     LINDA KACHIU
                 WAYNE LEACH     MICHAEL NICHOLLS       MICHAEL TOMASINI
                 SHEBA PERSON-WHITLEY, Executive Director

                                         EDB FOUNDATION SPONSORS

                                           FOUNDATIONAL LEVEL

                                            PRESENTING LEVEL

                                              PREMIER LEVEL

                       EXECUTIVE LEVEL                                  MEDIA LEVEL
     •     AMERICAN RIVER BANK     •   NORTH BAY ASSOCIATION OF
     •     COMCAST                     REALTORS
     •     KEEGAN & COPPIN CO.     •   SONOMA COUNTY ALLIANCE
     •     MIDSTATE CONSTRUCTION   •   SUMMIT STATE BANK
     •     MORGAN STANLEY          •   PISENTI & BRINKER LLP

                    SONOMA COUNTY BOARD OF SUPERVISORS

SONOMAEDB.ORG                                       PG. 2
CONTENTS

                  4.    EXECUTIVE SUMMARY

                  6-10. SONOMA COUNTY ECONOMY

                  11-13. MOODY’S EXECUTIVE SUMMARY

                  14-15. MOODY’S FORECAST RISKS

SONOMAEDB.ORG   PG. 3
SPRING 2020 LOCAL ECONOMIC REPORT

   EXECUTIVE SUMMARY                                                                           June 2020

   The Sonoma County Economic Development Board is pleased to present the Spring 2020 Local
   Economic Report. Our research partner, Moody’s Analytics, provided the data for this report. For
   additional information, questions, comments, or suggestions, please contact us at (707) 565-7170
   or visit www.sonomaedb.org.
   Disclaimer to the Reader: The forthcoming details in this report reflect trends sourced from data
   gathered during the novel Coronavirus pandemic. Figures, such as employment rates, have been
   susceptible to great variability and are ever-changing. It is expected that Sonoma County will return
   to Pre-COVID employment levels in late 2021; when the projected vaccine is widely available and
   distributed.

   HIGHLIGHTS

                                       Manufacturing of non-durable goods, such as food and
                                       beverage, will continue to serve Sonoma County well in light
                                       of COVID-19. However small and mid-size wineries, breweries
                                       and distilleries, in partnership with local and state officials,
                                       need to compose creative solutions to safely accommodate in-
                                       person visits. Many of the manufacturers in this demographic
                                       rely on in person visits to meet their sales demands.

                                       On another hand, housing prices have remained relatively
                                       stagnant, despite pressures from COVID-19. The stagnation
                                       of home prices comes two-fold. Home-buyers are dissuaded
                                       from engaging in the market resulting in downward pressure
                                       on prices. Whereas, the continuing shortage of homes
                                       and dwellings, due to fires and lack of building permit
                                       volume, applies upward pressure on prices in the housing
                                       market. With both variables considered, housing prices are
                                       forecasted to decline by .5% in an already overvalued market.

SONOMAEDB.ORG                                      PG. 4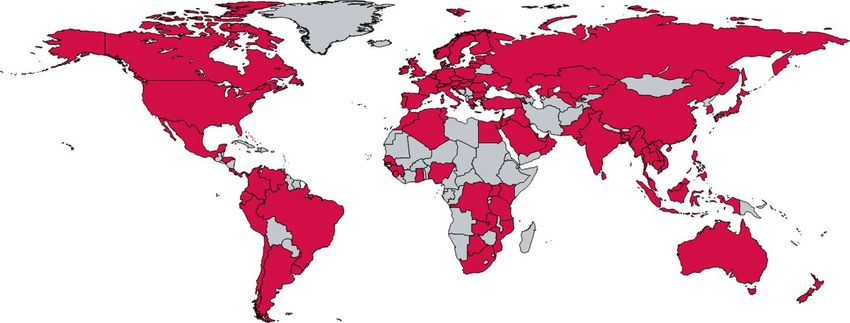
SONOMAEDB.ORG PG. 5
SONOMA COUNTY CA
METRO EMPLOYMENT GROWTH RANK RELATIVE COSTS VITALITY
COMPARISON LIVING BUSINESS RELATIVE RANK
Best=1, Worst=409 U.S.=100% U.S.=100% Best=1, Worst=402
Sonoma County 248 (4th quintile) 194 (3rd quintile) 137% 121% 104% 120
Santa Barbara County 245 (3rd quintile) 203 (3rd quintile) 137% 129% 109% 95
Santa Cruz County 158 (2nd quintile) 83 (2nd quintile) 151% 126% 107% 101
Sacramento MSA 208 (3rd quintile) 154 (2nd quintile) 112% 120% 112% 79
Monterey County 178 (3rd quintile) 143 (2nd quintile) 128% 121% 103% 127
BUSINESS CYCLE
CYCLE STATUS
STATUS ANALYSIS
ANALYSIS
Recent Performance. Sonoma County’s pos- down to about 150,000 passengers daily from
Mid
Expansion itive economic momentum will be halted by the more than 2 million a year earlier.
Late COVID-19 pandemic. Job growth steadily accel- Negative wealth effects from lower equity
Recovery Expansion
erated through 2019 and overtook the California prices and widespread unemployment will ham-
average in early 2020. Goods producers were the string sales of higher-end wines. Though alcohol
In Recession At Risk standout performers, with job gains up a robust purchases are less vulnerable than other luxury
8% year over year in March. Leisure/hospitality goods during economic downturns, wineries and
remained a sore spot, and early shutdowns and breweries will still be dealt a blow. Evidence from
STRENGTHS & WEAKNESSES
slowing travel put additional pressure on pay- the Great Recession shows that winery pretax
STRENGTHS rolls, though the full extent of the impact will not profits fell from 16% to 9% to 2% from 2007
» World-class wineries and craft breweries are show up until April data are released. The jobless to 2009, and sales volume swung from 22%
magnets for tourism. rate ticked up slightly but, at 3%, is still near its growth in 2007 to 2% in 2008 to a decline of
» Leader in organic food production. cyclical low. Meanwhile, residential building de- 4% in 2009, according to financial statements
» Climate draws outdoor enthusiasts. celerated but remained strong. However, permit collected by Silicon Valley Bank.
» High quality of life.
issuance and home sales cratered in March as Housing. The sharp downtick in both hous-
WEAKNESSES shelter-in-place orders dissuaded buyers from ing demand and supply will mirror the twin de-
» Limited land availability for new wineries and the market. mand and supply shocks inflicted on the overall
commercial construction. Manufacturing. Sonoma’s manufacturing U.S. economy by COVID-19. House prices, al-
» High costs relative to emerging tech hubs. base has been a robust growth driver in recent ready somewhat overvalued when compared
» Unfavorable age structure.
years, and while it will not be unscathed by with their long-term trend value, will register
COVID-19-related weakness, it will help buffer an average decline of 0.5 percentage point for
FORECAST RISKS the county’s tourism-reliant sectors. Sonoma 2020. Although demand will crater as poten-
X
County’s manufacturing industry is advancing tial homebuyers stay in their current dwellings,
W
SHORT TERM LONG TERM
at a healthy pace, in contrast to declines at the the persistent shortage of supply will mitigate
RISK EXPOSURE
92 2nd quintile
Highest=1
Lowest=403
state level. The manufacturing base is growing
ever more bifurcated; nondurable producers are
some of the downward pressure on prices. Ad-
ditionally, a sharp rebound in construction ac-
rapidly adding to payrolls while durable goods tivity and sales is expected toward the end of
UPSIDE payrolls have slid since early 2019. Food and 2020 and in early 2021 as the COVID-19 pan-
» Consumers embrace organic foods with even
beverage manufacturers, in particular, have been demic subsides and the housing market begins
greater enthusiasm.
» Marin biotech firms expand in Sonoma.
standout performers this decade. Supply chain a return to normalcy.
disruptions and a pullback in spending at restau- Sonoma County’s near-term outlook has
DOWNSIDE rants will crimp near-term growth. soured in light of COVID-19. Forced busi-
» COVID-19 does more economic damage. Wine. Shelter-in-place orders and travel re- ness closures, reduced travel volumes, and
» Population trends fail to improve.
strictions will deal a body blow to small and mid- other containment efforts have plunged the
» More wine enthusiasts flock to the Pacific
Northwest. size wineries and breweries whose sales rely on economy into recession in the first half of
» Weaker trade with East Asia hurts medical device in-person visits. Tasting room visits have ceased 2020. Fortunately, over the long run, income
and wine industries. as the state closed all nonessential businesses, gains will be in line with the national average.
sealing off a crucial source of sales for local win- However, the high cost of living will restrain
eries. Taprooms are also reeling. While Sonoma population and employment additions.
MOODY’S RATING caters heavily to in-state visitors, TSA volumes Colin Seitz 1-866-275-3266
Aa2 SANTA ROSA
AS OF DEC 20, 2017
point to the near-complete shutdown of travel, April 2020 help@economy.com
2013 2014 2015 2016 2017 2018 INDICATORS 2019 2020 2021 2022 2023 2024
24.4 25.8 27.5 28.0 29.4 30.8 Gross metro product (C12$ bil) 31.5 30.8 31.6 33.2 34.3 34.9
3.0 5.5 6.7 1.8 4.9 4.7 % change 2.3 -2.2 2.7 4.9 3.3 1.9
181.8 191.0 196.7 201.6 205.4 208.7 Total employment (ths) 211.4 206.6 207.6 212.3 216.0 216.9
4.7 5.1 3.0 2.5 1.9 1.6 % change 1.3 -2.3 0.5 2.3 1.7 0.4
7.1 5.6 4.5 4.0 3.4 2.7 Unemployment rate (%) 2.7 5.4 6.2 5.5 4.8 5.0
4.6 7.0 8.1 3.9 5.3 6.8 Personal income growth (%) 5.9 2.0 3.2 5.6 5.0 4.0
64.0 66.1 70.0 74.0 78.7 81.4 Median household income ($ ths) 83.7 86.3 89.0 92.6 96.1 99.3
494.0 498.4 500.9 502.7 502.7 498.7 Population (ths) 497.7 497.5 497.8 498.4 499.0 499.8
0.8 0.9 0.5 0.4 0.0 -0.8 % change -0.2 -0.0 0.1 0.1 0.1 0.1
2.9 3.5 1.5 1.0 -0.7 -4.3 Net migration (ths) -1.2 -0.6 -0.3 -0.0 0.0 0.1
453 419 431 621 840 3,169 Single-family permits (#) 2,135 1,409 1,533 1,624 1,458 1,355
593 244 190 298 338 110 Multifamily permits (#) 368 202 410 470 421 398
208.3 238.8 260.4 282.1 306.2 332.5 FHFA house price (1995Q1=100) 336.8 348.9 358.3 374.2 392.5 413.5
MOODY’S ANALYTICS / Précis® U.S. Metro / April 2020 PG. 6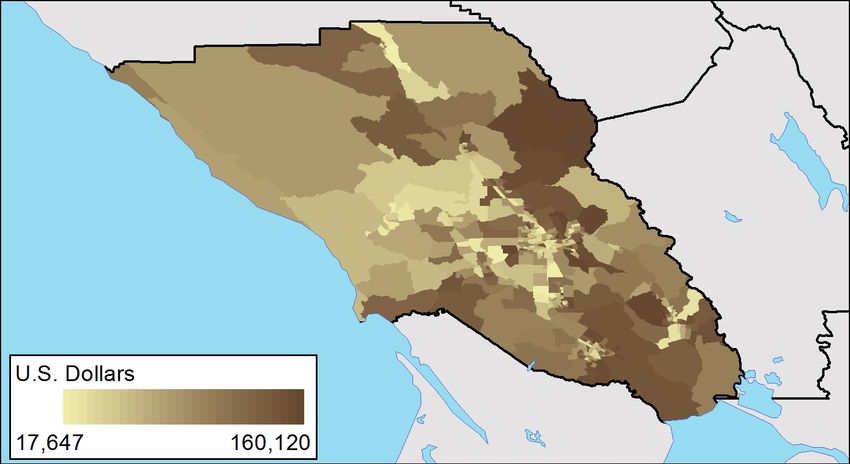
PRÉCIS® U.S. METRO • Sonoma County CA
ECONOMIC HEALTH CHECK BUSINESS CYCLE INDEX
3-MO MA Sep 19 Oct 19 Nov 19 Dec 19 Jan 20 Feb 20 JAN 2009=100
Employment, change, ths 0.9 0.8 0.5 0.3 0.2 0.1 130
Unemployment rate, % 2.7 2.7 2.6 2.5 2.4 2.5 125
120
Labor force participation rate, % 64.6 64.5 64.6 64.7 64.6 64.4
115
Average weekly hours, # 32.3 32.4 32.4 32.3 32.4 32.7
110
Industrial production, 2012=100 110.8 111.4 112.0 112.5 112.9 113.5 105
Residential permits, single-family, # 2,189 1,824 1,792 2,239 2,492 2,387 100
Residential permits, multifamily, # 494 451 170 172 155 157 95
Dec/Dec 2014 2015 2016 2017 2018 2019 90
09 10 11 12 13 14 15 16 17 18 19
Employment, change, ths 5.4 6.1 4.1 3.9 1.8 3.2
SAA CA U.S.
Better than prior 3-mo MA Unchanged from prior 3-mo MA Worse than prior 3-mo MA
Sources: BLS, Census Bureau, Moody’s Analytics Source: Moody’s Analytics
EMPLOYMENT TRENDS
CURRENT EMPLO DIFFUSION INDEX
% CHANGE YR AGO
8
Feb 19 Aug 19 Feb 20 70
6 Total 0.2 0.5 1.8
4 Mining -0.1 0.1 -0.0 65
2 Construction 10.6 8.6 10.2
Manufacturing 1.0 -0.4 2.1 60
0 Trade -1.1 -1.5 -1.2
-2 Trans/Utilities 0.8 4.1 -1.5 55
-4 Information -3.8 -3.6 0.0
-6
Financial Activities -3.1 -1.7 2.0 50
Prof & Business Svcs. 2.7 1.4 3.0
14 15 16 17 18 19 Edu & Health Svcs. 0.5 4.3 2.8 45
Leisure & Hospitality 2.5 0.4 -1.2 14 15 16 17 18 19
Government Goods producing
Other Services 0.4 -1.6 3.3 SAA CA U.S.
Private services
Government -6.7 -4.6 1.2
Sources: BLS, Moody’s Analytics Sources: BLS, Moody’s Analytics Sources: BLS, Moody’s Analytics
YMENT PERFORMANCE
RELATIVE EMPLOYMENT HOUSE PRICE
JAN 2009=100 FORECAST 1998Q1=100, NSA
VS. 6 MO PRIOR 350
125
120 2-Yr 5-Yr 300
115 250
▲
▲
▼
▼
l
l
110 200
105
▲
▲
150
▼
▼
l
l
100 100
▲
▲
▼
▼
l
l
95
50
90 98 01 04 07 10 13 16 19
09 10 11 12 13 14 15 16 17 18 19F 20F 21F 22F 23F
SAA CA U.S.
SAA CA U.S.
Sources: BLS, Moody’s Analytics Sources: FHFA, Moody’s Analytics
VACANCY RATES HOUSE PRICE TRENDS HOUSING AFFORDABILITY
HOMEOWNER, % HOUSES FOR SALE % GREATER THAN 100=MORE AFFORDABLE
60
220
50 200
40 180
30 160
0.0 0.2 0.4 0.6 0.8 1.0 1.2 1.4 1.6
140
SAA CA U.S.
20
RENTAL, % INVENTORY FOR RENT 120
10
100
0 80
-10 60
-20 40
98 01 04 07 10 13 16 19 96 98 00 02 04 06 08 10 12 14 16 18
0 1 2 3 4 5 6 7
SAA CA U.S. Overvalued Undervalued SON CA U.S.
Sources: Census Bureau, ACS, Moody’s Analytics, 2018 Sources: FHFA, Moody’s Analytics Sources: NAR, Moody’s Analytics
MOODY’S ANALYTICS / Précis® U.S. Metro / April 2020 PG. 7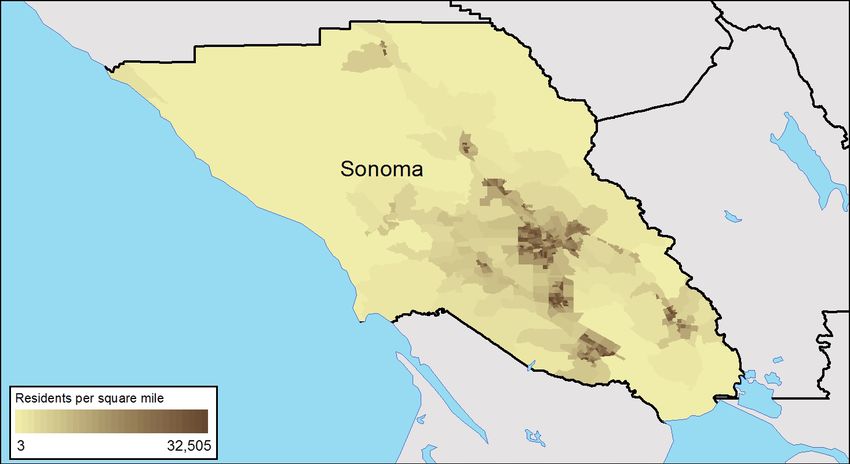
PRÉCIS® U.S. METRO • Sonoma County CA
YMENT AND INDUSTRY
EMPLOYMENT INDUSTR ENTREPRENEURSHIP
TOP EMPLOYERS INDUSTRIAL DIVERSITY EMPLOYMENT IN NEW COMPANIES, % OF TOTAL
Kaiser Permanente 3,508 Most Diverse (U.S.)
Graton Resort & Casino 2,000 1.00
St. Joseph Health System 1,640
Keysight Technologies 1,300 0.80
Safeway Inc. 1,200
Sutter Santa Rosa Regional Hospital 1,050 0.60 0.0 0.5 1.0 1.5 2.0
Medtronic CardioVascular 1,000 0.42 SAA CA U.S.
Amy’s Kitchen 988 0.40
Wells Fargo 916 Sources: Census Bureau, Moody’s Analytics, avg 2012-2016
Lagunitas Brewing Co. 900
Jackson Family Wine 800
0.20 EXPORTS
Cyan 700 0.00 Product $ mil
Walmart Inc. 650 Food and kindred products ND
Least Diverse
Hansel Auto Group 600
EMPLOYMENT VOLATILITY Chemicals 113.9
AT&T 600
Primary metal manufacturing ND
Lucky 550 Due to U.S. fluctuations Relative to U.S.
Santa Rosa Community Health Centers 523 100 Fabricated metal products 88.8
PG&E 500 Machinery, except electrical 204.9
Petaluma Acquisitions 455 80
Computer and electronic products 454.5
Ghilotti Construction Co. 425 Transportation equipment ND
Sources: North Bay Business Journal Book of Lists, 2017, San Francisco
Miscellaneous manufacturing ND
60
Business Journal Book of Lists, 2017 Other products 289.9
201
40
89% Total 1,231.7
PUBLIC Destination $ mil
20 100 Africa 7.8
Federal 1,344
State 3,824 Asia 573.9
Local 24,476 0 European Union 231.1
SAA U.S.
Canada & Mexico 256.5
2019 Not due to U.S. Due to U.S.
South America 17.9
COMPARATIVE EMPLOYMENT AND INCOME Rest of world 144.5
Total 1,231.7
% OF TOTAL EMPLOYMENT AVERAGE ANNUAL EARNINGS
Sector SON CA U.S. SON CA U.S. % of GDP 3.6
Mining 0.1 0.1 0.5 $18,208 $66,127 $103,785 Rank among all metro areas 230
Construction 7.3 5.0 4.9 $87,051 $78,900 $68,455 Sources: BEA, International Trade Administration, Moody’s
Manufacturing 11.2 7.7 8.5 $85,039 $108,759 $83,365 Analytics, 2018
Durable 36.4 63.9 62.6 nd $124,251 $86,331 PRODUCTIVITY
PRODUCTIVITY
Nondurable 63.6 36.1 37.4 nd $83,145 $78,483
REAL OUTPUT PER WORKER, $
Transportation/Utilities 2.0 3.9 4.0 $56,625 $57,283 $60,890
Wholesale Trade 3.6 4.1 3.9 $79,235 $91,917 $88,316
Retail Trade 11.9 9.8 10.6 $41,962 $42,493 $35,245
Information 1.3 3.2 1.9 $103,418 $184,240 $119,417
Financial Activities 4.3 4.9 5.8 $49,575 $68,248 $59,540
98,630 112,380
Prof. and Bus. Services 11.1 15.5 14.1 $57,455 $82,844 $71,767 92,845
Educ. and Health Services 16.7 15.9 15.9 $60,237 $57,703 $56,400
Leisure and Hosp. Services 12.3 11.6 10.9 $29,881 $36,319 $29,108
Other Services 3.4 3.3 3.9 $51,143 $42,403 $38,639
SAA CA U.S.
Government 14.9 15.0 15.1 $84,580 $98,813 $78,273
Sources: Percent of total employment — BLS, Moody’s Analytics, 2018, Average annual earnings — BEA, Moody’s Analytics, 2017 Sources: BEA, Moody’s Analytics, 2018
BUSINESS COSTS LEADING INDUSTRIES BY WAGE TIER
U.S.=100 TECH
Location Employees
EMPLOYMENT NAICS Industry Quotient (ths)
Total
Ths % of total 6221 General medical and surgical hospitals 0.7 4.3
HIGH
6214 Outpatient care centers 3.6 4.2
Unit labor SAA 9.3 4.4
6211 Offices of physicians 0.7 2.6
U.S. 7,498.9 5.0 5511 Management of companies & enterprises 0.7 2.3
Energy
GVL Local Government 1.3 25.3
TED 3121 Beverage manufacturing 24.8 8.0
MID
State and local taxes GVS State Government 0.7 5.0
EMPLOYMENT
2382 Building equipment contractors 1.0 2.9
Office rent Ths % of total 7225 Restaurants and other eating places 1.1 16.4
SAA 27.9 13.2 6241 Individual and family services 2.4 7.6
LOW
0 50 100 150 200 250 4451 Grocery stores 1.7 6.4
U.S. 14,552.2 9.6
2012 2017 FR Farms 1.6 6.1
Source: Moody’s Analytics Source: Moody’s Analytics, 2019 Source: Moody’s Analytics, 2019
MOODY’S ANALYTICS / Précis® U.S. Metro / April 2020 PG. 8PRÉCIS® U.S. METRO • Sonoma County CA
SKILLS MISMATCH
MISM MIGRATION FLOWS
% OF TOTAL INTO SONOMA COUNTY CA
Less than HS
Number of
Undereducated Balanced Overeducated Migrants
High School San Rafael CA 1,811
SON U.S.
San Francisco CA 1,413
Some College
Oakland CA 1,316
Associate’s T
ECONOMIC DISENFRANCHISEMENT Sacramento CA 661
Bachelor’s Los Angeles CA 581
Index 2018 Rank*
San Jose CA 458
Graduate Gini coefficient 0.46 197
Napa CA 451
Palma ratio 3.2 152
Vallejo CA 377
0 5 10 15 20 25 30 Poverty rate 10.1% 331
San Diego CA 292
*Most unequal=1, Most equal=403 Riverside CA 240
Occupations Population
Sources: Census Bureau, ACS, Moody’s Analytics, 2018 Total in-migration 13,891
HOUSEHOLDS BY INCOME, %
PER CAPITA INCOME FROM SONOMA COUNTY CA
0-19,999 Sacramento CA 1,543
$ THS 20,000-39,999
70 San Rafael CA 1,238
40,000-59,999 Oakland CA 1,108
65
60,000-74,999 San Francisco CA 834
60
75,000-99,999
Vallejo CA 705
55 Napa CA 582
100,000-124,999
50 Los Angeles CA 492
125,000-149,999 San Diego CA 383
45
150,000-199,999 Portland OR 365
40
200,000+ San Jose CA 364
35
Total out-migration 18,756
09 10 11 12 13 14 15 16 17 18 19
0 5 10 15 20
SAA Net migration -4,865
2019 SON $68,530 CACA
$66,661 U.S.
U.S. $56,663 SON U.S.
Sources: BEA, Moody’s Analytics Sources: Census Bureau, ACS, Moody’s Analytics, 2018
NET
Net MIGRATION,
Migration, SAA #
COMMUTER FL
FLOWS
RESIDENTS WHO WORK IN SON WORKERS WHO LIVE IN S SON 1,000
0
-1,000
-2,000
-3,000
83.2% 91.7%
-4,000
Top Five Outside Sources of Jobs Top Five Outside Sources of Workers -5,000
Sonoma County CA Share Sonoma County CA Share 16 17 18 19
San Rafael CA 7.4 San Rafael CA 2.1
2016 2017 2018 2019
San Francisco CA 3.3 Vallejo CA 1.3
Domestic 130 -1,061 -4,202 -4,534
Napa CA 1.9 Napa CA 1.0
Oakland CA 1.7 Oakland CA 0.9 Foreign 708 361 74 97
Vallejo CA 0.5 San Francisco CA 0.5 Total 838 -700 -4,128 -4,437
Sources: Census Bureau, Moody’s Analytics, avg 2009-2013 Sources: IRS (top), 2018, Census Bureau, Moody’s Analytics
GENERATIONAL BREAKDOWN EDUCATIONAL ATTAINMENT POPULATION BY AGE, %
POPULATION BY GENERATION, % % OF ADULTS 25 AND OLDER ≥75
70-74
100 65-69
Gen Z 14 13 13 60-64
80 55-59
22 21 20
Millennial 50-54
60 45-49
29 29 40-44
Gen X 40 34 35-39
30-34
20 21 27 25-29
Baby Boom 18 20-24
11 16 12 15-19
Silent & 0
10-14
Greatest SON CA U.S. 5-9
< High school High school 0-4
0 5 10 15 20 25 30
Some college College
0 2 4 6 8
SAA U.S. Graduate school SON U.S.
Sources: Census Bureau, Moody’s Analytics, 2018 Sources: Census Bureau, ACS, Moody’s Analytics, 2018 Sources: Census Bureau, Moody’s Analytics, 2018
MOODY’S ANALYTICS / Précis® U.S. Metro / April 2020 PG. 9PRÉCIS® U.S. METRO • Sonoma County CA
GEOGRAPHIC PROFILE
POPULATION DENSITY
MEDIAN HOUSEHOLD INCOME POPULATION & HOUSING CHARACTERISTICS
Units Value Rank*
Total area sq mi 1,767.9 202
Total water area sq mi 192.1 97
Total land area sq mi 1,575.8 211
Land area - developable sq mi 847.7 185
Land area - undevelopable sq mi 728.1 169
Population density pop. to developable land 581.8 109
Total population ths 494.3 126
U.S. citizen at birth % of population 81.8 345
Naturalized U.S. citizen % of population 7.1 61
Not a U.S. citizen % of population 9.8 46
AVERAGE COMMUTE TIME Median age 42.4 59
Total housing units ths 205.2 130
Owner occupied % of total 56.1 243
Renter occupied % of total 35.2 78
Vacant % of total 8.7 276
COMING SOON 1-unit, detached % of total 65.8 217
1-unit, attached % of total 7.8 57
Multifamily % of total 21.1 193
Median year built 1978
* Areas & pop. density, out of 410 metro areas/divisions, including metros in Puerto Rico;
all others, out of 403 metros.
Sources: Census Bureau, Moody’s Analytics, 2018 except land area 2010
Sources: ACS, Moody’s Analytics
MOODY’S ANALYTICS / Précis® U.S. Metro / April 2020 PG. 10BROAD VIEW �� Executive Summary
COVID-19: Global Economic Tsunami
BY MARK ZANDI
COVID-19 has created a worldwide to an economy. Chinese GDP is on track to Wave three will be a sharp pullback in
economic tsunami. The global economy is decline by 29% at an annualized rate in the business investment. Businesses were al-
engulfed in a serious downturn. The virus first quarter. ready on edge from the trade war between
has caused significant parts of the Asian and U.S. businesses immediately laid off the U.S. and China, Brexit, and a long list of
now European and U.S. economies to all but workers. Initial claims for unemployment other geopolitical concerns. But the virus
shut down (see Chart 1). More financial pain insurance spiked from about 210,000 in the will be too much to bear. Investment in the
is quickly coming as layoffs mount, busi- first week of March to nearly 3.3 million energy industry is already falling because
nesses curtail investment, and retirement the week of March 16, and 6.6 million the of the collapse in oil prices. That collapse is
nest eggs evaporate. Central banks have week of March 23. As there are numerous due in part to the global recession as well
responded aggressively but are running out reports of laid-off workers unable to file for as the brinkmanship between Saudi Arabia
of room to maneuver as interest rates hit UI because so many people are trying to file and Russia that prompted the Saudis to
the zero-lower bound. The onus is now on at the same time, more job losses will be ramp up oil production. A surge in business
governments to quickly provide substantial recorded in coming weeks, particularly for bankruptcies and failures is surely coming.
financial support to hard-pressed house- households that live paycheck to paycheck. It will further exacerbate the investment
holds and businesses. How much economic A survey conducted by the Federal Reserve decline and be an impediment to the future
damage COVID-19 ultimately does will de- last year found that almost half of Ameri- economic recovery.
pend on the trajectory of the virus—and how cans effectively live paycheck to paycheck.
governments respond. The second wave of the economic Dark global outlook
tsunami will hit when the other half of Our darkening outlook for the global
Economic tsunami households come to terms with their much- economy is struggling to keep up with the
The economic tsunami that hit China and diminished wealth. Losses in the U.S. stock growing magnitude of the crisis. We have
much of Asia earlier in the year and hit Eu- market are more than $10 trillion, depend- long been wary of the economy’s growth
rope a few weeks ago is now slamming the ing on the day and hour, down about one- prospects this year and the threats to that
U.S. economy as increasingly more parts of third from the peak in stock values just a few growth, but COVID-19 has resulted in
the country require nonessential businesses weeks ago. The negative wealth effects—the consistent substantial downgrades to the
to shut down. This sudden stop in the econ- change in consumer spending in response outlook. In January, prior to the virus, we
omy is unprecedented. The only analogue to a loss of wealth—will be substantial. The expected global real GDP growth of 2.6%
is the 9/11 terrorist attack. But that lasted baby boom cohort, now in its 50s and 60s in 2020 (see Chart 2). This is close to the
for a day or two, and except for airlines, and owning more than half of all stocks, will global economy’s estimated growth poten-
businesses continued to operate. China’s turn particularly cautious. If sustained, the tial, and thus unemployment was expected
experience with COVID-19 demonstrates loss of stock wealth will by itself reduce GDP to remain low and stable. With the virus
the economic devastation the disease brings over the coming year by an estimated 2%. now shutting down travel, trade and many
Economic Costs Are Quickly Adding Up Unprecedented Global Economic Downturn…
U.S. cumulative lost output, % of GDP, SAAR 2020 economic outlook
0
-1
-2
-3
Up to 3/15 3/17 3/19 3/21 3/23 3/25 Recession
Source: Moody’s Analytics Source: Moody’s Analytics
COVID-19: Economic Scenarios 1 COVID-19: Economic Scenarios 2
PG. 11 MOODY’S ANALYTICS / Précis® U.S. Macro / April 2020BROAD VIEW �� Executive Summary
businesses, the global economy is expected economy nearly a percentage point in GDP, it may not be pessimistic enough. There are
to suffer with real GDP falling by 4.2% (see and the losses are mounting rapidly. U.S. three critical known unknowns: the trajec-
Chart 3). real GDP is expected to decline by 5.8% this tory of the virus, the policy response, and
Europe will be especially hard-hit since year. A massive and mounting monetary and what other problems may develop due to
it has been unable to contain the spread of fiscal policy response will limit the economic the extraordinary pressure on the economy
the virus. Italy has had the most serious out- damage compared with much of the rest of and financial system. Numerous and far
break so far, but all of Europe’s major econo- the world. The Federal Reserve’s aggressive darker economic scenarios are possible de-
mies have closed borders and schools and actions should stabilize credit and equity pending on how these—and other unknown
quarantined large parts of their populations. markets, and President Trump signed a $2 unknowns—play out.
The European economy was fragile before trillion fiscal stimulus bill—deficit-financed In the U.S., an increasingly tenuous as-
the virus hit—it returned only recently to full increases in government spending and tax sumption is that, while the virus will not
employment after a decade-long struggle in cuts—equal to nearly 10% of GDP. Even so, play out nearly as well as in South Korea,
the wake of the financial crisis. Europe is also U.S. real GDP will decline. it will not be as bad as in Italy. The Korean
struggling to muster an economic policy Asia appears past the worst of the virus, government and healthcare system have
response. The Bank of England recently and while there is still considerable eco- managed the crisis well, while the Italians
lowered rates to the zero lower bound and nomic fallout to come, the region’s economy have been overwhelmed. To date, the U.S.
the European Central Bank has maintained should be able to eke out a small gain in federal government’s crisis management
negative rates since the crisis. Germany and GDP this year. After cratering in the first efforts have been poor—the lack of testing
the U.K. are implementing large fiscal stimu- quarter, China’s economy is staging a strong kits is symptomatic—suggesting the virus
lus packages, but the rest of Europe has little comeback. Barring a return of the virus, Chi- will be more widespread and result in more
fiscal space to respond. Euro zone real GDP na should be fully up and running later this hospitalizations and deaths than had been
is expected to decline by 7% in 2020. year. Of course, with global travel still large- assumed. Indeed, the recent spike in new in-
Emerging economies will be hammered ly shut down and the global economy strug- fections in the U.S. suggests that the trajec-
given the collapse in oil and other commod- gling to revive, the Asian economy will not tory of the virus may be even more serious
ity prices, which are staples for many Latin get into full gear until next year. The ability than in Italy (see Chart 4).
American, Middle Eastern and African econ- of Asian governments to quickly and effec-
omies. The price of a barrel of West Texas tively lock down their infected populations Policymakers break glass
Intermediate has slumped on weaker global has allowed them to restart their economies Global central banks and governments
demand as well as the Saudi-Russian brink- more quickly and to limit the damage to the are rapidly ramping up their response to the
manship. EM economies are also struggling region’s longer-term growth prospects. health and economic crisis. Central banks
with the flight-to-quality and the appreciat- are slashing interest rates, engaging in sub-
ing U.S. dollar. This is especially problematic Epidemiological assumptions stantially more quantitative easing, provid-
for countries such as Hong Kong and Saudi Our baseline outlook for the global econ- ing substantial liquidity to financial markets,
Arabia that peg their currencies to the dollar. omy is increasingly pessimistic. Still, given and reducing capital requirements for their
The U.S. economy will also suffer sig- how quickly events are moving and the high banks. Governments are declaring states of
nificantly. Lockdowns have already cost the degree of uncertainty around the virus’ path, emergency, appropriating funds to address
…That Is Intensifying U.S. Cases Double Every 3-4 Days
Real GDP growth, annualized % change # of COVID-19 cases, days since 100 confirmed cases, log-scale
2020Q1 2020Q2 2020Q3 2020Q4 2019 2020 100,000
World
January base
March base
2.7
0.7
2.9
1.6
2.7
3.5
2.6
2.8
2.5
2.4
2.6
1.9
Italy
April base -10.9 -22.1 19.9 4.5 2.4 -4.2 10,000 S. Korea
January base 1.5 2.2 1.5 1.2 2.3 1.8
United States March base 1.1 -0.4 1.7 2.4 2.3 1.3 U.S.
April base -8.1 -30.2 16.6 0.4 2.3 -5.8
January base 7.2 6.6 5.5 5.8 6.1 6.2 1,000
China March base -0.9 5.1 11.4 5.8 6.1 4.4 Day 1 dates
April base -29.0 14.9 27.7 13.0 6.1 -0.1 Italy Feb 22
January base 2.0 2.4 2.5 2.6 1.1 2.2 100
Brazil March base 1.3 2.0 2.5 2.6 1.1 2.0 S. Korea Feb 19
April base -8.8 -24.3 0.4 7.0 1.1 -6.1 U.S. March 3
January base 1.2 1.1 1.1 1.1 1.3 1.0
United Kingdom March base 0.6 0.5 1.2 1.1 1.4 0.7 10
April base -3.0 -36.7 25.8 5.8 1.4 -5.6
January base 1.4 1.5 1.8 1.4 1.2 1.3
Euro Zone March base 0.7 0.8 1.2 1.3 1.2 0.8 1
April base -14.8 -40.0 59.3 1.6 1.2 -7.0
0 2 4 6 8 10 12 14 16 18 20 22 24 26 28 30 32
Source: Moody’s Analytics Sources: Johns Hopkins CSSE COVID-19 Data Repository, Moody’s Analytics
COVID-19: Economic Scenarios 3 COVID-19: Economic Scenarios 4
MOODY’S ANALYTICS / Précis® U.S. Macro / April 2020 PG. 12BROAD VIEW �� Executive Summary
Stress in Corporate Debt Markets than $8 billion via own lending, the impact on the economy will
the first tranche of be severe and immediate.
Option-adjusted high yield spreads, %
stimulus, $90 bil- The high level of corporate debt is anoth-
25
lion in the second er threat (see Chart 5). There are many large
Europe U.S.
20 tranche, and $50 multinationals with strong balance sheets
billion freed up with and little debt, but there are also many
15 President Trump’s highly leveraged companies that will likely
emergency decla- face a Hobson’s choice: make their debt pay-
10
ration. The third ments in a timely way or cut payrolls and
5 tranche is $2 trillion investment. Either way the economy will suf-
in stimulus including fer. We assume these financial fault lines are
0 direct payments to not severe or persistent enough to materially
Jan-08 Jan-10 Jan-12 Jan-14 Jan-16 Jan-18 Jan-20
individuals, expand- weaken the economy. However, this is an in-
Sources: Bloomberg Index Services Limited, Moody’s Analytics
ed unemployment creasingly tough assumption to make.
COVID-19: Economic Scenarios 5 insurance benefits,
the health crisis and providing discretionary loans and loan guarantees to small busi- Dark scenarios
fiscal stimulus that includes more govern- nesses, and support for hard-pressed COVID-19 is an unprecedented global
ment spending and tax cuts. companies. These measures are in addi- pandemic and economic shock. Economies
In the U.S., the Fed has reduced the tion to the so-called automatic stabilizers around the globe are shutting down, and the
federal funds rate to the zero lower bound, built into the tax code and government sudden halt to business is resulting in serious
restarted quantitative easing, lowered re- programs. Even more fiscal stimulus is economic and financial damage. It is not dif-
serve requirements for banks, and is provid- increasingly likely. ficult to construct very dark scenarios—each
ing substantial liquidity to credit markets darker than the last. With the epidemiology
via a number of financial-crisis-era credit Financial fault lines of the virus all but impossible to gauge, these
facilities resurrected in recent days. We as- Our baseline outlook also depends on dark scenarios cannot be ruled out.
sume that a new, much larger credit facility credit markets functioning reasonably well, While our baseline outlook has turned
will soon be established to support lending albeit with significant support from the quickly more pessimistic, the recession that
to businesses via the banking system, and Federal Reserve. Liquidity in credit markets now engulfs the world ultimately should
potentially to certain non-bank financial has become increasingly impaired, including not be as severe as the financial crisis nor,
institutions that are critical to credit flows the repo and commercial paper markets. If certainly, as terrible as the Great Depression.
to businesses. liquidity dries up, and short-term funding However, the scenario that comes to pass
Discretionary fiscal stimulus in the U.S. markets effectively close to large corporates will depend critically on how effective global
is assumed to ultimately total at least $2.2 that issue short-term debt and financial in- policymakers are in containing the virus and
trillion. Already appropriated was more stitutions that raise funds necessary for their responding to the economic fallout.
PG. 13 MOODY’S ANALYTICS / Précis® U.S. Macro / April 2020BROAD VIEW
Forecast Assumptions
BY MARK ZANDI
Monetary policy Long-term Treasury yields have also fallen U.S. dollar
The Federal Reserve is aggressively respond- sharply, as global capital has poured into the The U.S. dollar remains strong, although the
ing to the economic fallout of COVID-19. It has safety of the U.S. Treasury market. Ten-year Fed’s emergency actions have diminished some
slashed the federal funds rate to the zero lower Treasury yields have declined to record lows of that strength. On a real broad trade-weight-
bound, reduced bank reserve requirements, and are currently around 70 basis points. ed basis the dollar remains more than half a
provided trillions of dollars in liquidity to short- The Fed is expected to manage long-term rates standard deviation above its long-run average
term funding markets, and restarted quantita- so they remain between 50 and 100 basis points since it began to freely float in the early 1970s.
tive easing through purchases of Treasuries and while the crisis is in full swing. If rates rise much The value of the U.S. dollar is expected to
agency mortgage backed securities and will above this, the Fed will ramp up QE; if rates fall remain strong, since the virus will do more
soon be buying municipal securities. much below this the Fed will tamp down QE. Long- damage to the global economy than to the
Most significantly, the Fed has stood up a num- term rates should rise to near 200 basis points by U.S. economy. The Chinese and European
ber of credit facilities to support different parts of the end of 2021 and back to their estimated long- economies will be especially hard hit.
the credit market. These include facilities that were run equilibrium of 400 basis points by mid-decade. Other geopolitical uncertainties, includ-
used during the financial crisis, such as a commer- ing the unresolved U.S. trade war with China
cial paper facility and a facility to support money Fiscal policy and the Brexit transition, will also continue
market funds, and a new facility to provide help to Lawmakers have rapidly implemented to fuel a global flight to the safe haven pro-
the struggling corporate bond market. three rounds of fiscal policy measures to vided by U.S. assets, and support the dollar.
The Fed’s efforts have been successful in cushion the blow from COVID-19. The cost
keeping credit markets open, at least so far. of these policy measures is an estimated Energy prices
Credit spreads have gapped out and new $2.4 trillion, equal to well over 10% of GDP. The global recession and collapse in global
issuance has been severely impaired, but This is approximately equal to the cost of all oil demand and the brinkmanship between
credit is still flowing. This is critical to ensure of the fiscal stimulus measures adopted dur- Saudi Arabia and Russia over who should
that the economic crisis created by the virus ing and after the financial crisis. shoulder the oil production cuts have pum-
does not become even more serious. This wide-ranging fiscal support includes signifi- meled oil prices. The price for a barrel of West
Looming downgrades in the corporate cantly expanded unemployment insurance bene- Texas Intermediate was near $25 per barrel.
bond market will further test the Fed’s ability fits, tax rebate checks to lower- and middle-income Oil prices are expected to get a lift when
to manage the turmoil in financial markets. households, and funds for hard-pressed state and the Saudis and Russians come to terms on pro-
Downgrades of investment grade companies local government and the healthcare system. duction cuts. Given the extraordinary financial
to below invest grade will ignite selling by It also provides financial support to busi- pressure on both countries, we expect at least a
investment funds that are required to hold nesses. Measures include expanded small tentative resolution by mid-year. Oil prices are
only investment grade debt. Collateralized business lending, direct bailout funds for the expected to end the year close to $40 per barrel.
loan obligation managers will also be forced airlines and other companies deemed critical Oil prices should rebound closer to their estimated
to sell loans that are downgraded to C rat- to national security, and funds to stand up long-run equilibrium level of $55 per barrel by late
ings. A self-reinforcing vicious cycle of selling a credit facility that will provide loans, loan 2021 once the impact of the virus on the global econ-
leading to lower bond prices leading to more guarantees and other help to companies. omy has passed.The equilibrium price is the cost of
selling could be set off. Even more fiscal support will be neces- producing and transporting oil from U.S. shale fields to
The Fed will also likely need to lower sary, with a fourth stimulus package expect- global markets. U.S. shale producers are currently sup-
capital and liquidity requirements for the ed later this year, although the Presidential plying the last barrel of oil to the global marketplace.
banks they regulate. With the banking sys- election may complicate the timing.
tem being asked to provide forbearance to The nation’s budget deficit will balloon to COVID-19
their household and corporate borrowers, close to $2.5 trillion this year, and over $2 tril- COVID-19 is doing significant damage to the
the Fed will also need to show forbearance lion next. The nation’s debt-to-GDP ratio will global economy, which is now engulfed in a serious
to the banks. surge to near 100% more than a decade sooner recession. While the worst of the economic fallout
The Fed’s emergency measures are expected than expected prior to the virus. Lawmaker are from the virus is expected through this summer,
to remain in place for the most part through 2021. appropriately not focused on all the red ink giv- without a vaccine or medical treatment for the
The zero interest rate policy will remain in place un- en the need to respond to the crisis. But, once virus, travel, tourism and trade will remain impaired
til it is clear the economy will return to full employ- the virus is in the history books, addressing the and the global economy will continue to struggle.
ment, which is not expected until late 2022. nation’s fragile fiscal situation will be critical. We are anticipating a vaccine by summer 2021.
MOODY’S ANALYTICS / Précis® U.S. Macro / April 2020 PG. 14BROAD VIEW
Forecast Risks
BY MICHAEL FERLEZ
COVID-19 in stimulus. While the monetary policy has increase in corporate borrowing and subse-
The COVID-19 pandemic presents an worked to stabilize the financial system, the quent rise in corporate leverage have made
unprecedented test of the global economy. fiscal response provides essential assistance corporations more exposed to slowing eco-
In the U.S., nearly the entire country is under to individuals and small-business owners hit nomic growth. With the operations of many
some form of lockdown, leading to the loss hardest by the coronavirus. businesses disrupted by government-man-
of millions of jobs and billions in lost eco- While further actions will likely be needed, dated shutdowns, the financial strain could
nomic output. In the Moody’s Analytics April Congress and the Fed have demonstrated a spur a tidal wave of defaults. The Fed’s newly
baseline forecast, U.S. real GDP declines 8% strong willingness to take whatever actions minted facility to purchase corporate debt
at an annualized rate in the first quarter and are necessary. Herculean fiscal and monetary will help, but it remains to be seen how much
a staggering 30% in the second quarter. The support will without a doubt help mitigate it can do for non-investment-grade compa-
baseline forecast assumes that COVID-19 the fallout from the virus and could set the nies that are most at risk. A wave of defaults
infections peak in May, with economic activ- stage for a stronger than expected recovery. would not just add significantly to the stress
ity beginning to gradually return to normal Clearly, the immense size of the stimulus in the financial system; the negative impacts
over the subsequent months. However, with carries longer-term risks, primarily over their would also seep into the real economy, cost-
the pandemic still not yet contained, it is cost and how the programs are eventually ing more jobs and lost output.
impossible to rule out a much more dire wound down. However, these risks pale in
scenario that pushes the economy into a comparison to the costs of doing nothing. Oil
deeper recession. Furthermore, until a vac- The U.S. oil market has showed some
cine becomes widely available, the threat of China struggles signs of improvement, but the outlook for
future outbreaks remains a possibility. While The Chinese economy is starting to come U.S. oil producers remains grim. The recently
the world is likely to be better prepared for back on line, but risks of another slowdown announced OPEC+ production cuts will help
another outbreak, the damage to consumer remain elevated. Across China, factories have prices, though the enormous uncertainty
confidence and investor psyche could still be begun to reopen, and workers have started created by COVID-19 still poses a significant
enough to slow or even derail the recovery. returning. However, growth is subdued so downside risk to the struggling U.S. oil in-
Trauma caused by COVID-19 also could far, and coronavirus fears remain high. China dustry. The longer current conditions persist,
result in a weaker than expected recovery. has controlled the domestic spread of the vi- the slower it will take oil prices to recover,
Still more damaging would be a permanent rus, but danger is high that the virus gets re- resulting in a greater hit to employment and
change in consumer behavior leading to introduced from abroad, making consumers nonresidential fixed investment.
lasting disruptions of certain industries, per- cautious. Additionally, the world economy is
petuating job losses and income inequality. in a much different place than when China Trade
closed its economy. The decline in global de- Although trade tensions have moved off
ÅStimulus mand for Chinese goods coupled with weak the front page, they remain an obstacle as
Record-setting amounts of fiscal and domestic demand could cause economic the global economy shifts into recession. As
monetary stimulus will help the U.S. growth to fall short of expectations, resulting part of the partial U.S.-China trade deal, the
economy through the dark days ahead. in a deeper global recession. U.S. canceled new tariffs that were set to
On the monetary side, the Federal Reserve go into effect in December and promised to
has reopened its crisis-era playbook with Corporate debt roll back existing tariffs in phases. In return,
the addition of some powerful new plays, Rising corporate debt levels pose a serious China agreed to several concessions, includ-
including facilities to purchase commercial downside risk as the global economy moves ing the purchase of more U.S. agricultural
mortgage-backed securities and corporate into recession. In the aftermath of the finan- products. However, at this point, most of
bonds and the ability to lend to select small cial crisis, record low interest rates provided the existing U.S. and Chinese tariffs remain
businesses. The Fed’s actions have bolstered corporations with a cheap source of capital, in place. The barriers created by tariffs could
the financial system, stabilizing asset prices resulting in a boom in corporate debt issu- exacerbate the recession, inflicting more
and restoring confidence. ance. Globally, outstanding corporate debt damage to trade-dependent industries.
Fiscal policies have been equally extraor- doubled in the decade from 2008 to 2018. Trade policy uncertainty could return as a
dinary. In March, Congress passed the Coro- In the U.S., nonfinancial corporate debt—in- major downside risk later this year. If Presi-
navirus Aid, Relief, and Economic Security cluding debt securities and loans—as a share dent Trump wins reelection, he could double
(CARES) Act, providing more than $2 trillion of GDP is at a record high of 47%. The rapid down on his efforts and reignite a trade war.
MOODY’S ANALYTICS / Précis® U.S. Macro / April 2020
PG. 15SONOMAEDB.ORG
707 - 565 - 7170
141 STONY CIRCLE, STE. 110, SANTA ROSA, CA 95401You can also read