Louth - Healthy County Plan 2018-2022 - National Government Framework to Improve Health and Wellbeing
←
→
Page content transcription
If your browser does not render page correctly, please read the page content below
Louth Healthy County Plan 2018-2022

National Government Framework to Improve Health and Wellbeing

Louth – Healthy County Plan
2018-2022

                                                                1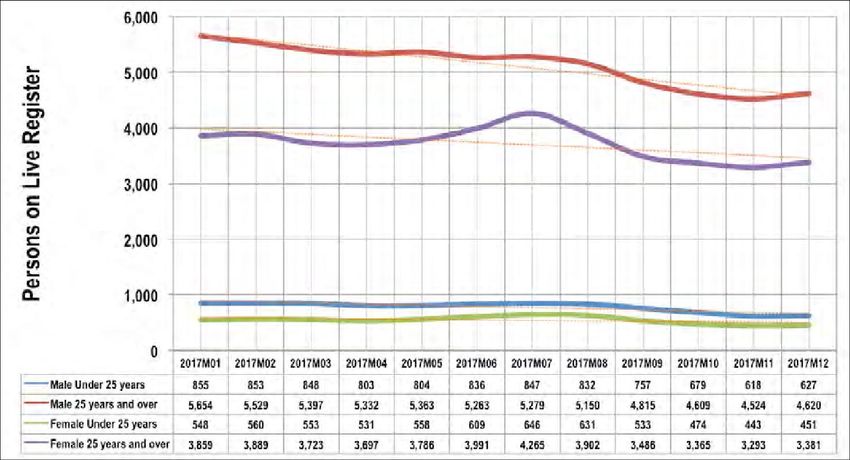
Louth Healthy County Plan 2018-2022

                                      2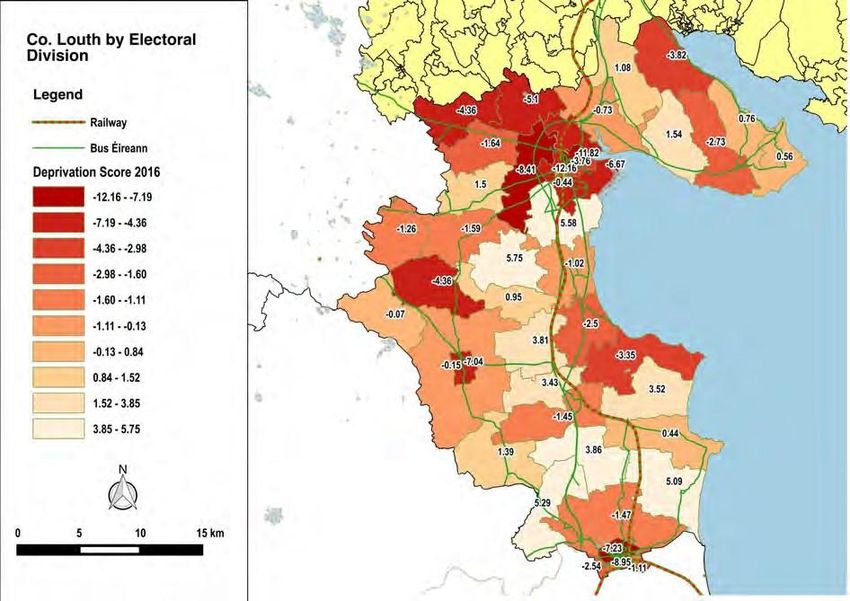
Louth Healthy County Plan 2018-2022

Appendix A: Socio-Economic Profile
   This Socio-Economic Profile is based upon the County Louth Local Economic and
   Community Plan 2016-20222.

Z1.1 Overview

   In 2016 Co. Louth was the sixteenth largest county (measured by population) in the State
   at 128,884 (CSO Census of Population). The county was the smallest of the 32 counties in
   area (827 sq. km). In 2016, the county had a population density of 156 persons per sq.
   km, compared to the state at 70 persons per sq. km.
   Co. Louth’s population growth during the period 2002-2006 (26.6%) was stronger than
   that of the State at 8.2%. In the intercensal period 2011-2016, the population of the
   county grew by 4.9% compared to the State at 3.8% (slowest rate of growth in twenty
   years).
   Quality road and rail networks that provide arterial connections to Dublin City, some 70
   km distant, serve Co. Louth, placing it within commuting distance of the city. Belfast City
   is approximately 80 km distant.
   Map 2 – Co. Louth Electoral Divisions

   Source: CSO Census of Population 2016 Co. Louth Local Community Development Committee (LCDC)

                                                                                                  3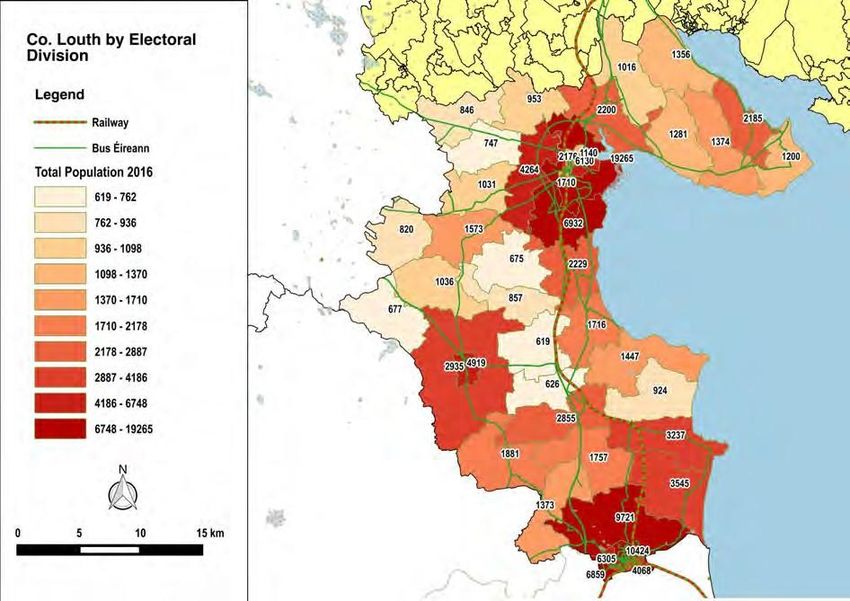
Louth Healthy County Plan 2018-2022

  Louth’s location, recognised in its regional move to partner counties along the eastern
  economic corridor coupled with its indicative youthful population, high commuter levels
  and reducing unemployment rates means that trends identified at regional level will be
  more like those of the former eastern rather than border region.

Z1.2 Demographics

Z1.2.1 Population

  Ireland experienced a population growth of 31.32% over the intercensal period 1996 to
  2016; however, during the period 2011-2016 the population of the State grew by 3.78%.
  During the period 1996 to 2016 the population of Leinster increased at a comparative
  rate of 38.67%, whilst increasing by 5.17% between 2011 and 2016.
  During the intercensal period 2006-2016 the population of the State increased by 11%,
  whilst the Eastern and Midlands Regional Assembly area increased by 15% and Co, Louth
  increased by 15.8%.
  Map 3 – Co. Louth Population Distribution by ED

  Source: CSO Census of Population 2016

  In 2016 there were 63,633 (49.4%) males and 65,251 (50.6%) females resident in the county.

                                                                                4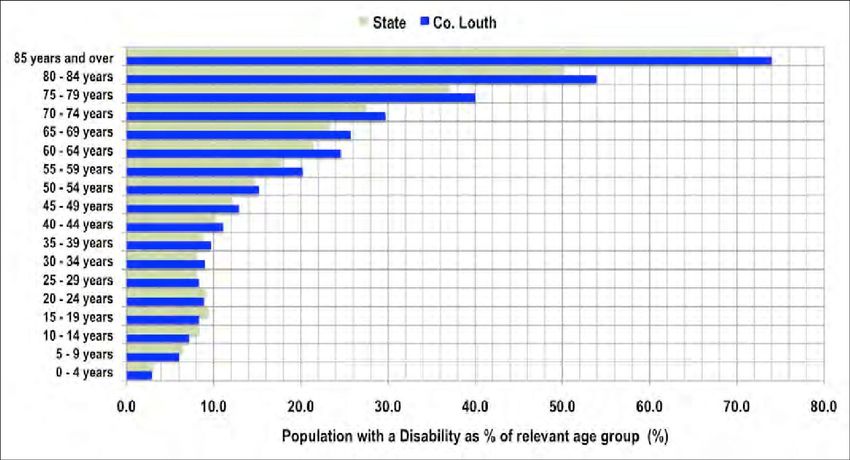
Louth Healthy County Plan 2018-2022

      Figure 7 – Co. Louth Gender Balance 2016

      Table 9 - Population Trend 1996-2016
                  Cens                           State            Leinster             Co. Louth
                   us
                  1996                       3,626,087          1,924,702                    92,166
                  2002                       3,917,203          2,105,579                   101,821
                  2006                       4,239,848          2,295,123                   111,267
                  2011                       4,588,252          2,504,814                   122,897
                  2016                       4,761,865          2,634,403                   128,884
      Source: CSO Census of Population

      The population growth that has been experienced in Co Louth can be largely attributed
      to external and internal migration (due to Louth’s proximity to Dublin and Belfast) as well
      as a natural increase in population.
Figure 8 – Population Trend 1996-2016

      Source: CSO Census of Population

                                                                                        5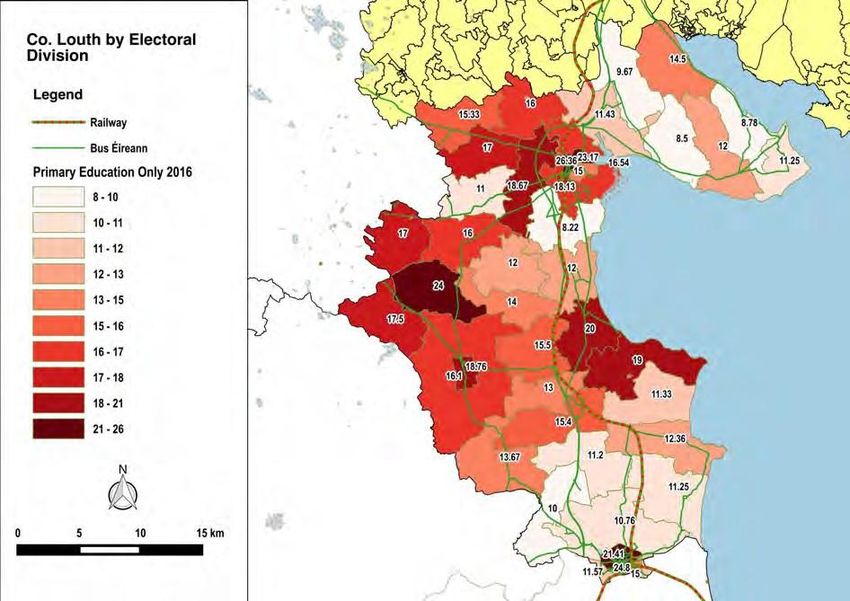
Louth Healthy County Plan 2018-2022
Table 10 – EDs With Population >4,000 2016
Total Population
Population Change
ED Name 2006 2011 2016 2006 2011 2016
Dundalk Rural (Pt.) 15,975 18,160 19,265 5.57 13.68 0.07
Fair Gate 9,792 9,806 10,424 -9.85 0.14 0.08
St. Peter'S (Pt.) 7,467 9,151 9,721 38.40 22.55 0.07
Haggardstown (Pt.) 5,862 6,390 6,932 19.82 9.01 0.10
St. Mary'S (Louth 6,003 6,563 6,859 27.27 9.33 0.04
Pt.)
West Gate 5,887 6,042 6,305 -8.00 2.63 0.05
Dundalk Urban No.4 6,183 6,039 6,130 2.30 -2.33 0.03
Ardee Urban 4,301 4,554 4,919 20.68 5.88 0.09
Castletown (Pt.) 3,944 4,210 4,264 33.03 6.74 0.03
St. Laurence Gate 3,846 4,004 4,068 6.59 4.11 0.02
Source: Haase, T. and Pratschke, J. (2017): 2016 Pobal HP Deprivation Index
In 2016 Dundalk Rural (Pt) was the seventh most populous ED in the State at 19,265 people.
The most populous was Blanchardstown-Blakestown (Co. Fingal) at 38,894.
The key population areas in Co. Louth are Dundalk, Drogheda, and Ardee. Ardee rural
(2,952) and urban (4,917) combined had a population of 7,869 according to the CSO
Census 2016.
Census 2016 results show that Drogheda has maintained its position as the largest town
in the State with 40,956 persons. Swords was in second place with 39,248 persons and
Dundalk occupied third place with a population of 39,004.
Population Density
Co. Louth was the smallest of twelve counties in the Province of Leinster measured by
land area (827 km²). It was the sixth largest in terms of population based on Census 2016
data.
It was the most densely populated county in Ireland outside of Dublin having a
population density of 156 people per km², compared to the national figure of 70.0
people per km².
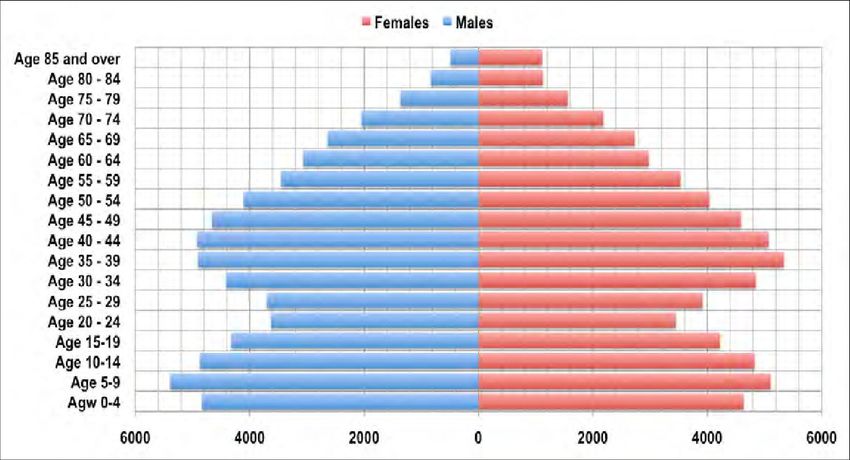
Age Profile
In Census 2016, Co. Louth returned 64.51% of the population (83,142) as being aged
between 15-64 years (working population), which was slightly lower than the State at
65% (3,117,746). Further analysis of the age profile reveals that the proportion of people
aged 75 years and older was lower in Co. Louth at 5.03% (6,483) than the State figure of
5.5% (264,059).
6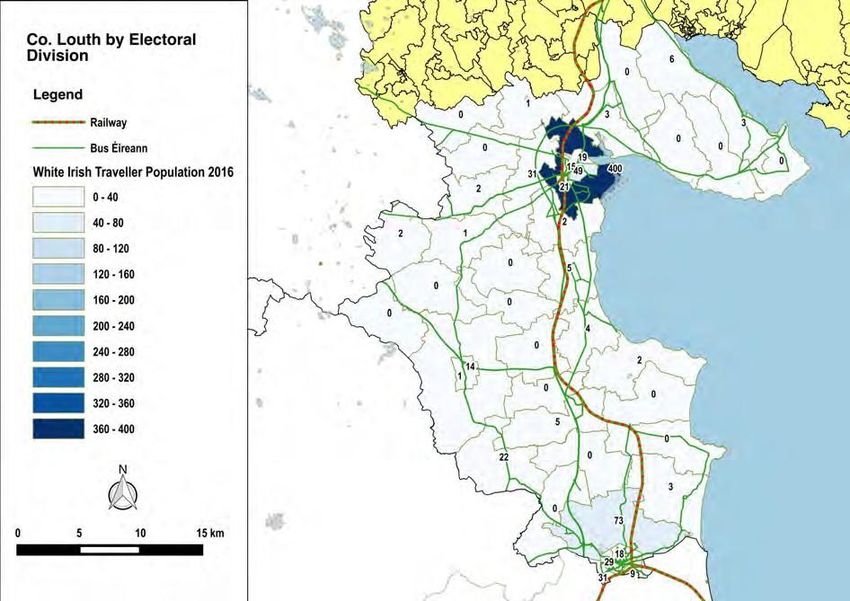
Louth Healthy County Plan 2018-2022

    Figure 9 - Population Pyramid 2016

         Source: CSO Census of Population 2016

    Age Dependency

         At national level age dependency, which is measured as the number of younger (0-14)
         and older (65+) people as a percentage of those of working age (15-64), increased from
         49.3% in 2011 to 52.7% in 2016. The number in the 65 and over category increased by
         102,174 – more than twice the 15-64 age category, which rose by 44,477 since 2011.
         Table 11 – Comparative Age Dependency 2016

                           Population                                 Age Dependency
            Under 15        Over 65             Total Age       Under 15:     Over 64: Old       Total           Total
                                               Dependent                            Age      Age             Population
                                                               Young Age                     Depende
                                                            Dependency %    Dependency       ncy %
                                                                            %
County         29,665         16,077               45,742          23.02            12.47        35.49          128,884
State       1,006,552        637,567            1,644,119          21.14            13.39        34.53        4,761,865

         Source: CSO Census of Population 2016

         In 2016 Co. Louth had a significantly larger cohort of young age-dependent population
         (23.02%) than was the case in the State (21.14%). The county had a lower percentage of
         old age dependent population (12.47%) than was the case in the State (13.39%).

                                                                                                         7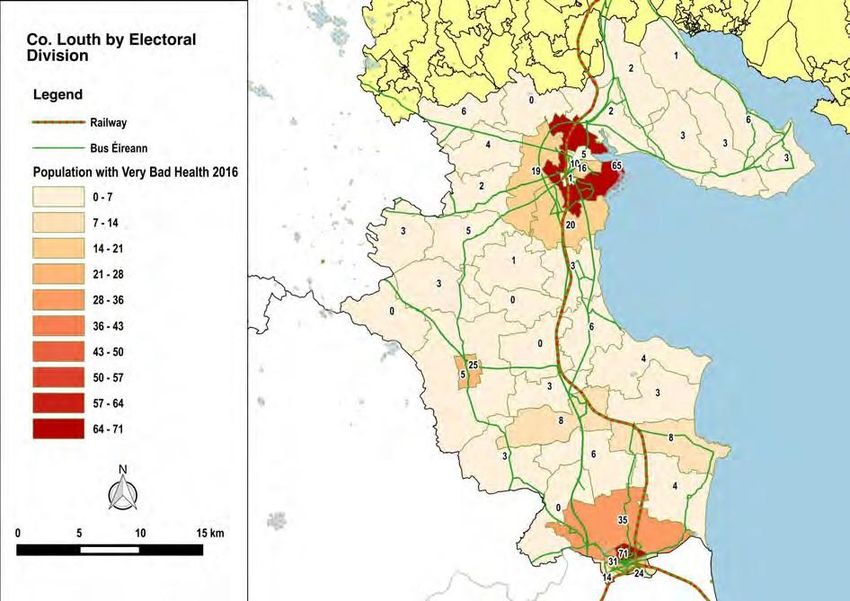
Louth Healthy County Plan 2018-2022

Map 4 – Age Dependency Rates by ED 2016

  Source: Pobal HP Deprivation Index 2016 - Haase, T. and Pratschke, J. (2017)

  There is evidence of a typical urban-rural differential with age dependency rates
  exceeding 38% in nine EDs: Carlingford (41.20%), Jenkinstown (41.07%), Stabannan
  (39.63%), Ravensdale (39.62%), Barronstown (39.35%), Dromin (38.94%), Dysart
  (38.82%), Greenore        (38.34%), Mansfieldstown (38.27%) and Creggan Upper
  (38.01%).
  Figure 10 – EDs With Age Dependency Rates >39%
  Source: Pobal HP Deprivation Index 2016 - Haase, T. and Pratschke, J. (2017)

                                                                                 8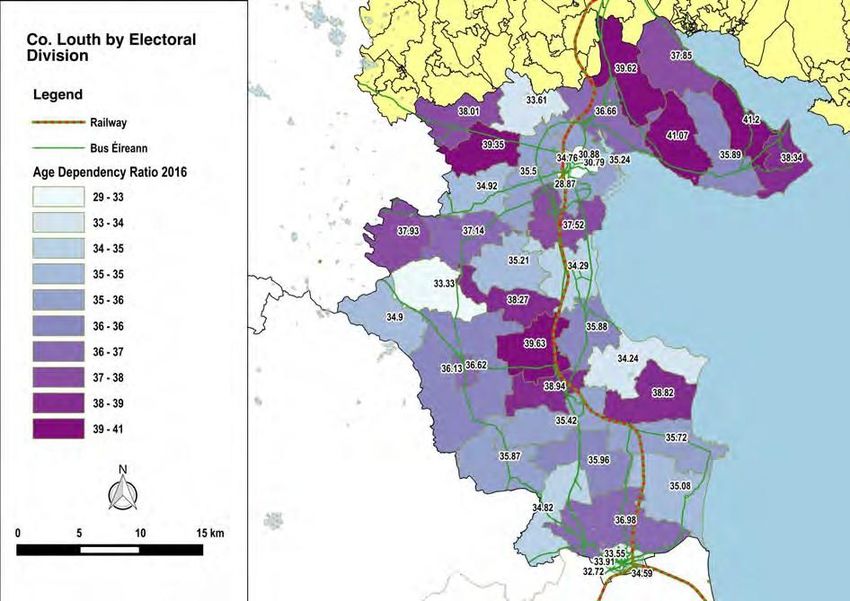
Louth Healthy County Plan 2018-2022

  Education

  In 2016, 9.43% of the total population of Co. Louth reported no formal or primary education
  only.
  Table 12 - Educational Attainment in Co. Louth 2016

                                      Population Aged 15          % Total Population       Average Age Education
                                                                                                         Ceased
                                     and Over Whose
                                     Education Has Ceased
  Co. Louth                                          81,745                      63.43                      19.3
  State                                           3,097,052                      65.04                      19.9

  Source CSO StatBank / Profile 10 - Education and Skills and the Irish Language / EA033

  There has been a continuous improvement in the level of education amongst adults over
  the past years throughout Ireland. In 1991, 36.7% of the adult population reported
  having only primary education. This dropped to half that level (18.9%) in 2006, and
  dropped significantly in 2011 to 13.8%. In 2016, 8.9% of the adult population of the State
  were recorded as having only primary education. The comparative figure for Co. Louth
  was 8.2%.

A1.3.1Low Educational Attainment

  The figure below shows the EDs that had the proportion of their population exceeding
  20% having attained only primary education.
  Figure 11 – EDs Primary Education Only >20 2016

  Source: Pobal HP Deprivation Index 2016 - Haase, T. and Pratschke, J. (2017)

                                                                                                      9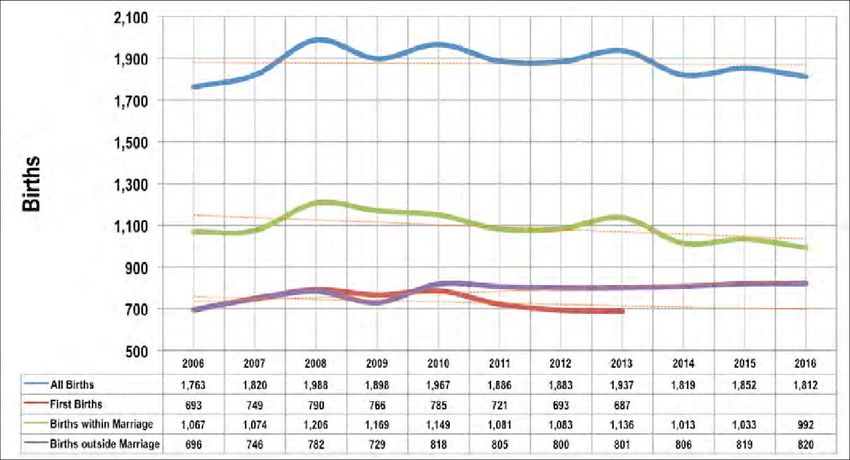
Louth Healthy County Plan 2018-2022

Map 5 – Primary Education Only by ED 2016

  Source: Pobal HP Deprivation Index 2016 - Haase, T. and Pratschke, J. (2017)

Z1.3.2 Third-Level Educational Attainment

  There is a growing recognition that the current model of higher education that sees very
  large numbers of young people proceed directly from school to third-level education
  might not best serve the countries future skills needs and might not be the best fit for
  student needs. Having said that, in 2016 all of the EDs in Co. Louth returned a proportion
  of their population with third level education exceeding 20.
  Those EDs that exceeded 35 are Haggardstown (46.72), Carlingford (41.40), Termonfeckin
  (38.72),
  Monasterboice (38.64), Dysart (37.83), Ravensdale (37.36) and Mullary (36.88) Those that
  exceeded 35 are noted in the figure below.

                                                                                   1
                                                                                   0
Louth Healthy County Plan 2018-2022
Figure 12 – EDs Third-Level Attainment > 35 2016
Source: Pobal HP Deprivation Index 2016 - Haase, T. and Pratschke, J. (2017)
Map 6 – Third-Level Education 2016
Source: Pobal HP Deprivation Index 2016 - Haase, T. and Pratschke, J. (2017)
1
1Louth Healthy County Plan 2018-2022
Z1.3.3 Primary and Post Primary Schools
Table 13 - Primary Schools 2017
Official Name Address Line 1 Address Line 2 Ethos Description Total Total Total
Girls Boys Pupils
Ardee Educate Together N.S Dundalk Road, Ardee Ardee Multi Denominational 61 82 143
Ardee Monastery Drogheda Road, Ardee Catholic 0 268 268
Aston Village Educate Dunlin Street Aston Village Multi Denominational 176 235 411
Together National School
Baile An Phusta N S Smarmore Drogheda Catholic 118 110 228
Bellurgan N S New Road Bellurgan Catholic 68 77 145
C.B.S. Primary Chapel Street Dundalk Catholic 214 244 458
Callystown Mixed N S Callystown Clogherhead Drogheda Catholic 144 166 310
Castletown Rd Convent Castletown Rd Dundalk Catholic 165 0 165
Dromin N S Dromin Dunleer Catholic 46 61 107
Dromiskin Mixed N S Dromiskin Dundalk Catholic 120 128 248
Dulargy Mixed N S Dulargy Ravensdale Dundalk Catholic 106 98 204
Dun Dealgan N S Jocelyn Street Dundalk Presbyterian 46 46 92
Gaelscoil Dhun Dealgan Muirtheimhne Mór Dún Dealgan Catholic 123 105 228
Kilcurley Mixed N S Kilcurley Dundalk Catholic 110 101 211
Knockbridge Mixed N S Knockbridge Dundalk Catholic 145 145 290
Le Cheile Educate Together Mornington Rd Drogheda Multi Denominational 174 260 434
Muire Na Ngael Ns Bay Estate Dundalk Catholic 339 351 690
Naomh Seosamh Mell Drogheda Catholic 138 167 305
Presentation Convent Ballymakenny Road Drogheda Catholic 292 0 292
Rathmullan N S Marley's Lane Drogheda Catholic 185 259 444
Réalt Na Mara School Mill Street Dundalk Catholic 215 234 449
S N An Tslanaitheora B Ard Easmuinn Dundalk Catholic 0 85 85
S N An Tslanaitheora C Ard Easmuinn Dun Dealgan Catholic 94 4 98
S N Aonghusa Geata An Domhnaigh Droichead Atha Catholic 97 115 212
S N Ard Mhuire C Ballsgrove Drogheda Catholic 267 22 289
S N Bhride Ard Achaidh Omeath Catholic 42 47 89
S N Bhride C Bothar Brugha Drogheda Catholic 302 0 302
S N Chaoimhin Naofa Philipstown Dunleer Catholic 60 72 132
S N Columcille Tullydonnell Togher Catholic 80 90 170
S N Mhuire Muchgrange Grianphort Dun Dealgan Catholic 76 63 139
S N Muire Pairc Na Rian Jenkinstown Dundalk Catholic 90 93 183
S N Muire Gan Smal Cartown Termonfeckin Catholic 123 125 248
S N Muire Na Trocaire Ardee Co Louth Catholic 267 0 267
S N Mullach Bui Mullach Bui Riverstown Dundalk Catholic 25 38 63
S N N Maolmhaodhagh B Anne Street Dundalk Catholic 0 207 207
S N N Maolmhaodhagh C Anne Stret Dundalk Catholic 243 0 243
S N N Maolmhaodhagh N Anne Street Dundalk Catholic 138 117 255
S N Naomh Fhionain Dillonstown Drumcar Catholic 47 52 99
S N Naomh Lorcan Omeath Dundalk Catholic 38 36 74
S N Naomh Peadar Bolton Street Drogheda Church Of Ireland 42 51 93
S N Oilibear Beannaithe Stonetown Lubhadh Dundalk Catholic 11 15 26
/continued
1
2Louth Healthy County Plan 2018-2022
Official Name Address Line 1 Address Line 2 Ethos Description Total Total Total
Girls Boys Pupils
S N Padraig Baile Ui Ir Mainistir Bhuithe Catholic 92 113 205
S N Padraig Naofa B Bothar Brugha Drogheda Catholic 0 286 286
S N Rath Corr Riverstown Dundalk Catholic 35 35 70
S N San Nioclas Tigh Banan Castlebellingham Catholic 32 69 101
S N San Nioclas Nicholas St Dundalk Church Of Ireland 56 78 134
S N Talamh Na Manach Talamh Na Manach Carlingford Catholic 66 75 141
S N Tigh An Iubhair Tigh An Iubhair Dunleer Catholic 95 114 209
S N Tulach Aluinn Tullyallen Drogheda Catholic 251 241 492
S.N Eoin Baiste Fatima Castletown Catholic 84 101 185
Sc Na Gcreagacha Dubha Blackrock Dundalk Catholic 196 233 429
Scoil Bhride Séalach Hackbalscross Dundalk Catholic 15 11 26
Scoil Bhride Mixed N S Lann Léire Ardee Road Catholic 118 104 222
Scoil Dairbhre Mixed Readypenny Dundalk Catholic 42 53 95
Scoil Fhursa Marlbog Road Haggardstown Catholic 102 111 213
Scoil Na Mbraithre Sn Geata An Domhnaigh Droichead Atha Catholic 0 301 301
Scoil Náisíunta Termonfeckin Drogheda Catholic 142 147 289
Naomh Feichín
Scoil Naomh Fainche Collan Co Louth Catholic 111 117 228
Scoil Oilibhéir Naofa St. Oliver's N.S. Ballymakenny Road Catholic 200 216 416
Scoil Phadraig Naofa Kilcurry Dundalk Catholic 103 117 220
Sn Chill Sarain Chill Sarain Baile An Ghearlanaigh Catholic 89 106 195
St Josephs N S Avenue Road Dundalk Catholic 279 304 583
St Marys Parish Dublin Road Drogheda Catholic 547 563 1110
Primary School
St Nicholas Monastery Ns Philip Street Dundalk Catholic 0 151 151
St Olivers Ns Dundalk Street Carlingford Catholic 85 75 160
St Pauls Senior Ns Marley's Lane Drogheda Catholic 170 285 455
St. Francis National School Rock Road Blackrock Catholic 117 117 234
St. Mochta's National Louth Dundalk Catholic 81 75 156
School
Tallonstown N S Tallonstown Dundalk Catholic 136 170 306
Walshestown N S Walshestown Grangebellew, Catholic 70 55 125
Drogheda
Source: Department of Education and Skills
Table 14 – Special School 2017
Total Total Total
Official Name Address Line 1 Address Line 2 Ethos Description
Girls Boys Pupils
St Thomas Special School Clonshaugh Priorswood Catholic 27 75 102
St L O Toole’s Special Aldborough Parade North Strand Catholic 47 96 143
School
St Roses Special School C/O Scoil Aengusa Sns Balrothery Catholic 25 44 69
Source: Department of Education and Skills
1
3Louth Healthy County Plan 2018-2022
Table 15 – Post-Primary Schools 2017
Official School Name Address 1 Address 2 Pupil Attendance Total Total Total Pupils
Type Girls Boys
St. Joseph's C.B.S. Newfoundwell Rd Drogheda Day 788 788
St Mary's Diocesan School Beamore Road Drogheda Day 783 783
Our Lady's College Greenhills Drogheda Day 958 958
Sacred Heart Sunnyside Drogheda Day 611 611
Secondary School
Drogheda Grammar Mornington Rd Drogheda Mixed 140 181 321
School
Colaiste Rís Sraid an tSéipéil Dún Dealgan Day 177 431 608
St Mary's College Nicholas Street Dundalk Day 280 454 734
De La Salle College Castleblaney Road Dundalk Day 1 707 708
St Vincent's Seatown Place Dundalk Day 911 911
Secondary School
St Louis Secondary School Dun Lughaidh Dundalk Day 505 505
Dundalk Grammar School The Crescent Dundalk Mixed 231 342 573
Bush Post Primary School Riverstown Dundalk Day 280 314 594
St Oliver's Rathmullen Road Drogheda Day 664 649 1,313
Community
College
Ó Fiaich College Dublin Road Dundalk Day 140 179 319
Scoil Ui Mhuiri Barn Road Dunleer Day 265 321 586
Coláiste Chú Chulainn Dundalk Dundalk Day 172 218 390
Ardee Community School Ardee Co Louth Day 367 439 806
Ballymakenny College Ballymakenny Road Drogheda Day 253 237 490
Source: Department of Education and Skills
DEIS Status Schools
Delivering Equality of Opportunity Schools (DEIS) the Action Plan for Educational
Inclusion is the Department of Education and Skills policy instrument to address
educational disadvantage. The action plan focuses on addressing and prioritising the
educational needs of children and young people from disadvantaged communities, from
pre-school through second-level education (3 to 18 years).
Where the level of disadvantage is greatest, primary schools are classified as
participating in Primary Urban Band 1 of DEIS. The remaining participating primary
schools are classified as participating in Band 2 of DEIS.
Table 16 – Primary Urban Band 1 DEIS Schools
School Name Address 1 Address 2 Address 3
S.N Eoin Baiste Fatima Castletown, Dundalk Co. Louth
St Joseph’s National School Avenue Road Dundalk Co. Louth
S N An Tslanaitheora C Ard Easmuinn Dun Dealgan Co. Louth
S N An Tslanaitheora B Ard Easmuinn Dundalk Co. Louth
St Nicholas Monastery National School Philip Street Dundalk Co. Louth
Castletown Road Convent Castletown Rd Dundalk Co. Louth
St Pauls Senior National School Rathmullen Drogheda Co. Louth
1
4Louth Healthy County Plan 2018-2022
Rathmullan National School Rathmullen Drogheda Co. Louth
S N Ard Mhuire C Ballsgrove Drogheda Co. Louth
Source: Department of Education and Skills
Table 17 – Primary Urban Band 2 DEIS Schools
School Name Address 1 Address 2 Address 3
S N San Nioclas Nicholas St Dundalk Co. Louth
Gaelscoil Dhun Dealgan Muirtheimhne Mor Dun Dealgan Co. Louth
Scoil Na Mbraithre SN Geata An Domhnaigh Droichead Atha Co. Louth
Presentation Convent Ballymakenny Road Drogheda Co. Louth
S N Padraig Naofa B Bothar Brugha Drogheda Co. Louth
S N Bhride C Bothar Brugha Drogheda Co. Louth
Source: Department of Education and Skills
Table 18 – Primary Rural DEIS Schools
School Name Address 1 Address 2 Address 3
S N Naomh Lorcan Omeath Dundalk Co. Louth
Source: Department of Education and Skills
Table 19 – Post-Primary DEIS Schools
School Name Address 1 Address 2 Address 3
Bush Post Primary School Riverstown Dundalk Co. Louth
St Oliver's Community College Rathmullen Road Drogheda Co. Louth
Ó Fiaich College Dublin Road Dundalk Co. Louth
Scoil Ui Mhuiri Barn Road Dunleer Co. Louth
Ardee Community School Ardee Co. Louth Co. Louth
Source: Department of Education and Skills
Z1.4 Housing Structure
Z1.4.1 Households
In 2016 the CSO Census of Population confirmed that there were 45,448 households in Co.
Louth.
Z1.4.2 Local Authority Rented Housing
A 1.9% decrease in the national population (from 9.8% to 7.9%) living in local authority
rented housing at national level was recorded over the 20 years to 2011. In 2016, 8.3%
(393,198 persons) of the national population was living in local authority rented housing.
The table below identifies the Co. Louth EDs with the highest proportion (above 20%) of
population living in local authority rented housing in 2016
1
5Louth Healthy County Plan 2018-2022
Figure 13 – Highest Rate Local Authority Renting 2016
Source: Pobal HP Deprivation Index 2016 - Haase, T. and Pratschke, J. (2017)
Map 7 – LA Rented Accommodation by ED 2016
Source: Pobal HP Deprivation Index 2016 - Haase, T. and Pratschke, J. (2017)
1
6Louth Healthy County Plan 2018-2022
Z1.4.3 Homelessness
Table 20 – Homelessness by Region 2016
Male Female Total
Border Region Persons 100 53 153
State Persons 4,018 2,888 6,906
Source: CSO StatBank / Profile 5 - Homeless Persons in Ireland / E5002
Table 21 – State Homelessness by Age Profile 2016
Male Persons Female Persons Total Persons Male Persons Female Persons Total Persons
0 - 4 years 379 386 765 49.54 50.46 100.00
5 - 9 years 292 273 565 51.68 48.32 100.00
10 - 14 190 174 364 52.20 47.80 100.00
years
15 - 19 165 170 335 49.25 50.75 100.00
years
20 - 24 286 335 621 46.05 53.95 100.00
years
25 - 29 355 375 730 48.63 51.37 100.00
years
30 - 34 381 297 678 56.19 43.81 100.00
years
35 - 39 436 263 699 62.37 37.63 100.00
years
40 - 44 384 198 582 65.98 34.02 100.00
years
45 - 49 348 151 499 69.74 30.26 100.00
years
50 - 54 290 86 376 77.13 22.87 100.00
years
55 - 59 213 66 279 76.34 23.66 100.00
years
60 - 64 122 48 170 71.76 28.24 100.00
years
65 - 69 103 26 129 79.84 20.16 100.00
years
70 - 74 44 13 57 77.19 22.81 100.00
years
75 - 79 12 12 24 50.00 50.00 100.00
years
80 - 84 14 4 18 77.78 22.22 100.00
years
85 years 4 11 15 26.67 73.33 100.00
and
over
4,018 2,888 6,906 58.18 41.82 100.00
Source: CSO StatBank / Profile 5 - Homeless Persons in Ireland / E5003
Z1.5 Affluence and Disadvantage
The Pobal Haase‐Pratschke Deprivation Index comprises successive deprivation indices
based on the Census of Population, 1991-2016. The HP Index rates small areas as either
extremely affluent, very affluent, affluent, marginally above average, marginally below
average, disadvantaged, very disadvantaged and extremely disadvantaged.
1
7Louth Healthy County Plan 2018-2022
Table 22 - HP Index Classification
Score Level of Disadvantage
20 to Very Affluent
30 Medium
10 to Affluent
20 Medium
0 to 10 Marginally Above Average
0 to -10 Marginally Below Average
‐10 to - Disadvantaged
20
‐20 to - Very
30 Disadvantaged
Below Extremely Disadvantaged
‐30
Source: Pobal HP Deprivation Index 2016 - Haase, T. and Pratschke, J. (2017)
Table 23 – Co. Louth Most Disadvantaged EDs 2016
ED Name Total Population 2016 Deprivation Score 2016 Classification
Dundalk Urban No.1 2,176 -12.16 Disadvantaged
Dundalk Urban No.2 1,140 -11.82 Disadvantaged
West Gate 6,305 -8.95 Marginally Below Average
Castletown (Pt.) 4,264 -8.41 Marginally Below Average
Fair Gate 10,424 -7.23 Marginally Below Average
Ardee Urban 4,919 -7.04 Marginally Below Average
Dundalk Rural (Pt.) 19,265 -6.67 Marginally Below Average
Faughart 953 -5.10 Marginally Below Average
Tallanstown 1,036 -4.36 Marginally Below Average
Creggan Upper 846 -4.36 Marginally Below Average
Drummullagh 1,356 -3.82 Marginally Below Average
Dundalk Urban No.4 6,130 -3.76 Marginally Below Average
Drumcar 1,447 -3.35 Marginally Below Average
Rathcor 1,374 -2.73 Marginally Below Average
St. Mary'S (Louth Pt.) 6,859 -2.54 Marginally Below Average
Castlebellingham 1,716 -2.50 Marginally Below Average
Barronstown 747 -1.64 Marginally Below Average
Louth 1,573 -1.59 Marginally Below Average
St. Peter'S (Pt.) 9,721 -1.47 Marginally Below Average
Dunleer 2,855 -1.45 Marginally Below Average
Killanny 820 -1.26 Marginally Below Average
St. Laurence Gate 4,068 -1.11 Marginally Below Average
Dromiskin 2,229 -1.02 Marginally Below Average
Ballymascanlan 2,200 -0.73 Marginally Below Average
Dundalk Urban No.3 1,710 -0.44 Marginally Below Average
Ardee Rural 2,935 -0.15 Marginally Below Average
Clonkeen 677 -0.07 Marginally Below Average
Source: Pobal HP Deprivation Index 2016 - Haase, T. and Pratschke, J. (2017)
1
8Louth Healthy County Plan 2018-2022
From the above it can be seen that there were no EDs in Co. Louth in 2016 that were
classified as either Extremely Disadvantaged or Very Disadvantaged. A total of 3,316
persons were living in EDs that were classified as Disadvantaged in 2016.
All of the remaining EDs in Co. Louth in 2016 were classified as Marginally Above
Average, with none being either Affluent or Very Affluent.
Table 24 - Co. Louth Most Affluent EDs 2016
ED Name Total Population 2016 Deprivation Score 2016 Classification
Clogher 3,237 0.44 Marginally Above Average
Greenore 1,200 0.56 Marginally Above Average
Carlingford 2,185 0.76 Marginally Above Average
Mansfieldstown 857 0.95 Marginally Above Average
Ravensdale 1,016 1.08 Marginally Above Average
Collon 1,881 1.39 Marginally Above Average
Castlering 1,031 1.50 Marginally Above Average
/continued
ED Name Total Population 2016 Deprivation Score 2016 Classification
Jenkinstown 1,281 1.54 Marginally Above Average
Dromin 626 3.43 Marginally Above Average
Dysart 924 3.52 Marginally Above Average
Stabannan 619 3.81 Marginally Above Average
Mullary 1,757 3.86 Marginally Above Average
Termonfeckin 3,545 5.09 Marginally Above Average
Monasterboice 1,373 5.29 Marginally Above Average
Haggardstown (Pt.) 6,932 5.58 Marginally Above Average
Darver 675 5.75 Marginally Above Average
Source: Pobal HP Deprivation Index 2016 - Haase, T. and Pratschke, J. (2017)
1
9Louth Healthy County Plan 2018-2022
Map 8 – Affluence and Deprivation by ED 2016
Source: Pobal HP Deprivation Index 2016 - Haase, T. and Pratschke, J. (2017)
2
0Louth Healthy County Plan 2018-2022
Z1.6 Ethnicity
Table 25 – Population by Ethnicity 2016
White Irish White Other White Black or Asian or Other Not stated
Irish Black Irish Asian Irish
Traveller
Population 106,031 771 10,006 3,570 2,406 1,767 3,211
Co. Louth Percentage 82.99 0.60 7.83 2.79 1.88 1.38 2.51
State Percentage 82.18 0.66 9.53 1.38 2.10 1.51 2.64
Source: CSO Census of Population 2016
Co. Louth had a relatively high proportion of Other White population (9.53%) in 2016
compared with the State at 7.83%.
Map 9 – White Irish Traveller Population
Source: Pobal HP Deprivation Index 2016 - Haase, T. and Pratschke, J. (2017)
2
1Louth Healthy County Plan 2018-2022
Z1.7 Single Parent Families
The CSO Survey on Income and Living Conditions (SILC) 2016 confirms that lone parents
are more likely than any other social group to be living in poverty.
Table 26 – Lone Parent Poverty Rate (Children Under 18)
Base Year 2012 Indicator 2016
Median Real Household Disposable Income €22,845
Mean Real Household Disposable Income €25,353
Median Nominal Household Disposable Income €23,090
Mean Nominal Household Disposable Income €25,625
Median Equivalised Real Disposable Income €13,693
Mean Equivalised Real Disposable Income €14,648
Median Equivalised Nominal Disposable Income €13,840
Mean Equivalised Nominal Disposable Income €14,805
At Risk of Poverty Rate 40.2%
Deprivation Rate 3 50.1%
Consistent Poverty Rate 24.6%
Source: CSO StatBank / Survey on Income and Living Conditions (SILC) / SIA16 / Select from table SIA16
There were 6,786 one parent family households with children of all ages in Co. Louth in
2016. Of these, 87% comprised of lone mothers and 13% of lone fathers.
Map 10 – Lone Parent Rate by ED 2016
Source: Pobal HP Deprivation Index 2016 - Haase, T. and Pratschke, J. (2017)
3
Deprivation Rate: An individual is defined as being deprived if they experience two or more forms of enforced deprivation.
2
2Louth Healthy County Plan 2018-2022
Z1.8 Labour Market
Z1.8.1 Unemployment Rate
Map 11 – Male Unemployment Rate by ED 2016
Source: Pobal HP Deprivation Index 2016 - Haase, T. and Pratschke, J. (2017)
Map 12 - Female Unemployment Rate by ED 2016
Source: Pobal HP Deprivation Index 2016 - Haase, T. and Pratschke, J. (2017)
2
3Louth Healthy County Plan 2018-2022
Z1.8.2 Live Register
The Live Register is compiled from returns made directly to the CSO by each of the local
offices of the Department of Social Protection. It is specifically not designed to measure
unemployment, however, it provides an invaluable short-term trend indicator of
unemployment.
Included on the Live Register are the following: -
All those on Jobseekers Benefit (JB) - excluding systematic short-time workers;
All those on Jobseekers Allowance (JA) - excluding smallholders/farm assists and self-
employed persons;
Part-time workers (those who work up to 3 days per week), seasonal and casual workers
entitled to Jobseekers Allowance or Benefit; and
Those signing on for 'PRSI credits' but receiving no payment.
There is a persistent note of concern at low wage growth and the relative levels of
persistently high youth (19%) and long-term unemployment rates (55% of unemployed).
There are three DSP (Intreo) local offices within Co. Louth; these are located at Dundalk
and Drogheda. Individuals registered at specific DSP local offices may not necessarily
reside within their immediate environs.
Figure 14 – Co. Louth Live Register 2017
Source: CSO StatBank / Live Register / LRM07 / Select from table LRM07
The figure above shows the relative seasonality of female unemployment (over 25 years
of age), and the near static rates of unemployment for young people aged under 25.
2
4Louth Healthy County Plan 2018-2022
Z2 County Health Profile
Z2.1 Key Facts
The following have been extracted from the HSE Health Profile 2015 Louth. This report
references the CSO Census of Population 2011.
Co. Louth has above average lone parent households of 12.4% (national rate 10.9%);
Births to females aged under 20 at 17.4 is higher than the national rate of 12.3;
Breast feeding rates are lower than the national average at 35.0% (national rate 46.6%);
Deaths rates for all ages, respiratory and injury and poisoning are higher than the
national rates, whilst heart disease in those aged under 65 years is lower than the
national rate;
Immunisation uptake at 24 months for the 3 rd 6 in 1 of 93% and MMR1 of 91% are lower
than the national rates.
Z2.2 General Health
The CSO Census of Population 2016 provides an assessment of the general health of the
population. The figure below provides the self-recorded health assessment of the Co.
Louth population by comparison with that of the State.
Figure 15 – General Health 2016
State 2016 Co. Louth 2016
Source: CSO Census of Population 2016
At State level the number of people with a disability increased by 47,796 between 2011
and 2016 and stood at 643,131 in April 2016, accounting for 13.5% of the population.
There were 331,551 females (51.6%) and 311,580 males (48.4%) with a disability. Among
those aged under 20, there was an increase of 11,828 persons (15.6%) with a disability
since 2011. This represented a disability rate of 6.7% in this group (up from 6% in 2011).
2
5Louth Healthy County Plan 2018-2022
The CSO reports that up to one in ten persons below 45 years of age had a disability in
2016, rising to 20% by age 60. Rates increased sharply above age 70; 27.7% of females
aged 70-74 had a disability while the rate had increased to 73.3% for females aged 84
and over.
Disability was more common amongst males in all age categories up to age 24, peaking in
the 5-9 age groups where there were almost twice as many disabled boys (14,964) as
girls (7,887).
Educational attainment amongst disabled persons was much lower than that of the
general population at all levels. Amongst those aged 15 to 50 (inclusive), 13.7% had
completed no higher than primary level education, compared with 4.2% of the general
population; 37.0% had completed third level education compared with 53.4% of all those
aged 15-50.
There were 176,445 persons with a disability in the labour force, giving a labour force
participation rate of 30.2% compared with 61.4% for the population overall. Of those
with a disability aged 15 and over in April 2016 (584,045 people), just 22.3% (130,067)
were at work, compared with 53.4% of the overall population in that age group. Overall
in April 2016, 6.5% of those at work had a disability.
Map 13 – Persons with Very Bad Health 2016
Source: CSO Census of Population 2016
2
6Louth Healthy County Plan 2018-2022
Z2.3 Disability
In 2016 there were 17,881 persons with a disability in Co. Louth, which means the
proportion of disabled persons in the county (13.9%) is slightly higher than that of the
State (13.5%).
Table 27 – Persons with a Disability 2011-2016
State Males Females Total
Total persons 2011 (Number) 2,272,699 2,315,553 4,588,252
Total persons 2016 (Number) 2,354,428 2,407,437 4,761,865
Persons with a disability 2011 (Number) 289,728 305,607 9,350,117
Persons with a disability 2016 (Number) 311,580 331,551 643,131
Persons with a disability as a % of total persons (%) 13.2 13.8 13.5
Actual change in persons with a disability since previous census (Number) 21852 25944 47,796
Percentage change in persons with a disability since previous census (%) 7.5 8.5 9.2
Co. Louth Males Females Total
Total persons 2011 (Number) 60,763 62,134 122,897
Total persons 2016 (Number) 63,633 65,251 128,884
Persons with a disability 2011 (Number) 7,829 8,103 15,932
Persons with a disability 2016 (Number) 8,732 9,149 17,881
Persons with a disability as a % of total persons (%) 2016 13.7 14.0 13.9
Actual change in persons with a disability since previous census (Number) 2,870 3,117 5,987
Percentage change in persons with a disability since previous census (%) 11.5 12.9 12.2
Source: StatBank / Profile 9 - Health, Disability and Carers / E9003
Table 28 – Persons With Disability By Age 2016
Co. Louth State 2016
2016
Total Population Population Population with Population with Population with Population with
(Number) a Disability a Disability as % a Disability as % a Disability as %
(Number) of relevant age of relevant age of relevant age
group group group
(%) (%) (%) Variance
0 - 4 years 9,473 271 2.9 3.0 -0.1
5 - 9 years 10,493 627 6.0 6.4 -0.4
10 - 14 years 9,699 701 7.2 8.3 -1.1
15 - 19 years 8,548 713 8.3 9.4 -1.1
20 - 24 years 7,078 632 8.9 9.1 -0.2
25 - 29 years 7,613 633 8.3 8.0 0.3
30 - 34 years 9,256 830 9.0 8.0 1.0
35 - 39 years 10,247 992 9.7 8.7 1.0
40 - 44 years 9,988 1,106 11.1 10.3 0.8
45 - 49 years 9,250 1,193 12.9 12.1 0.8
50 - 54 years 8,142 1,241 15.2 14.6 0.6
55 - 59 years 6,980 1,412 20.2 17.8 2.4
60 - 64 years 6,040 1,486 24.6 21.4 3.2
65 - 69 years 5,368 1,382 25.7 23.3 2.4
70 - 74 years 4,226 1,254 29.7 27.5 2.2
75 - 79 years 2,923 1,169 40.0 37.0 3.0
80 - 84 years 1,959 1,055 53.9 50.2 3.7
85 years and over 1,601 1,184 74.0 70.0 4.0
2
7Louth Healthy County Plan 2018-2022
Source: CSO StatBank / Summary Results Part 2 / EZ042
In 2016, the unemployment rate amongst persons with a disability was 26.3% in the
State, more than double the 12.9% rate for the population as a whole.
Figure 16 – Comparative Disability by Age 2016
Source: CSO Census of Population 2016
The table and figure above indicates a greater prevalence of disabilities in the population of
Co. Louth compared to the State for all age cohorts above 30 years of age in 2016.
Z2.3.1 Disability by Classification
Table 29 – Disability by Classification 2016
Co. Louth 2016 Males Females Total
Total persons 63,633 65,251 128,884
Total persons with a disability 8,732 9,149 17,881
Blindness or a serious vision impairment 805 827 1,632
Deafness or a serious hearing impairment 1,435 1,329 2,764
A condition that substantially limits one or more basic physical activities 3,370 4,285 7,655
An intellectual disability 1,210 659 1,869
Difficulty in learning, remembering or concentrating 2,389 1,850 4,239
Psychological or emotional condition 1,473 1,666 3,139
Other disability, including chronic illness 3,852 4,595 8,447
Difficulty in dressing, bathing or getting around inside the home 1,829 2,290 4,119
Difficulty in going outside home alone 2,294 3,079 5,373
Difficulty in working or attending school/college 2,969 3,097 6,066
Difficulty in participating in other activities 3,005 3,590 6,595
Total disabilities 24,631 27,267 51,898
Source: CSO StatBank / Profile 9 - Health, Disability and Carers / E9003
Z2.3.2 Physical and Sensory Disability
The 2016 Annual Report of the Health Research Board - National Physical and Sensory
Disability Database Committee (NPSDD) – provides a national record of the number of
people registered on the NIDD with a physical and sensory disability4.
4
HRB Statistics Series 34 Annual Report of the National Physical and Sensory Disability Database Committee 2016 Main Findings
2
8Louth Healthy County Plan 2018-2022
Co. Louth is within the HSE Community Health Organisation (CHO) Area 8 (Laois/Offaly
Local Health Office (LHO), Longford/Westmeath LHO, Louth LHO and Meath LHO).
The NPSDD recorded 3,107 people registered in CHO Area 8 in 2016.
Z2.3.3 Intellectual Disability
The 2016 Annual Report of the Health Research Board - National Intellectual Disability
Database (NIDD) Committee – provides a national record of the number of people
registered on the NIDD with an intellectual disability.
2016 Annual Report of the NIDD Committee notes that ‘there were 28,275 people
registered on the NIDD at the end of December 2016. Based on 2011 Census of
Population figures, this represents a prevalence rate of 6.16 per 1,000 population. The
prevalence rate for mild intellectual disability (which traditionally has been under-
reported) was 2 per 1,000, and the rate for moderate, severe or profound intellectual
disability was 3.59 per 1,000.’ Co. Louth is recorded as having 8.8 registrations per 1,000
population in 2016. Comparatively, Sligo had the highest registrations at 10.5, and
Leitrim had the lowest at 4.3 per 1,000 population.
Z2.4 Births and Deaths 2015
The following has been extracted from the National Perinatal Reporting System (NPRS).
Table 30 – Births 2015: Mothers County of Residence
Mothers County of Residence Number National %
Co. Louth 1,896 2.9
Source: NPRS: Perinatal Statistics Report 2015
Figure 17 – Co. Louth Birth-Rate Trends 2006-2016
Source: CSO StatBank / Births Occurrence / VSA16
2
9Louth Healthy County Plan 2018-2022
Figure 18 – Co. Louth Mothers Age Trends 2006-2016
Source: CSO StatBank / Births Occurrence / VSA16
The figure above shows that the average age of mothers in Co. Louth increased by 1.4
years over the period 2006-2016. Comparatively in the State over the same period the
average age of mothers increased by 1.6 years. During the period the average age of
first-time mothers in Co. Louth increased by 1.7 years compared to 2.1 years in the State.
Z2.4.1 Occurrences of Death
Table 31 – Co. Louth Occurrences of Death 2014-2016
External Occurrences of Death 2014 2015 2016
Accidents 27 20 19
External Causes of Death 44 35 33
Intentional Self-Harm (Suicide) 11 10 12
Assault 2 1 1
Events of Undetermined Intent 4 4 1
Other External Causes 0 0
Source: CSO StatBank / Deaths Occurrence / VSD24 / Select from table VSD24
3
0Louth Healthy County Plan 2018-2022
Table 32 – Co. Louth Deaths by Age Band 2016
Male Female
Under 1 year 1 1
1 - 4 years 0 0
5 - 9 years 0 0
10 - 14 years 0 0
15 - 19 years 2 0
20 - 24 years 2 0
25 - 29 years 4 1
30 - 34 years 6 1
35 - 39 years 6 2
40 - 44 years 7 2
45 - 49 years 5 9
50 - 54 years 15 7
55 - 59 years 15 19
60 - 64 years 21 25
65 - 69 years 44 27
70 - 74 years 49 34
75 - 79 years 51 44
80 - 84 years 65 48
85 years and over 102 154
Source: CSO StatBank / Deaths Occurrence / VSA07 / Select from table VSA07
Z2.4.2 Self-Harm by Age Group and Hospital
The National Suicide Research Foundation (NSRF) reports that there was variation in the
rate of self- harm by region in 2016. The male rate varied from 104 per 100,000 for
Roscommon to 402 per 100,000 for Cork City. The lowest female rate was recorded for
Monaghan (152 per 100,000) with the highest rate recorded for Limerick City residents at
493 per 100,000.
Figure 19 – Self-Harm by HSE Hospital Group 2016
Source: NSRF National Self-Harm Registry Ireland
3
1Louth Healthy County Plan 2018-2022
Z2.5 Carers
In the State in 2016 carers provided 6,608,515 hours of care per week, an average of
38.7 hours per carer. This was an increase of 321,005 hours (5.1%) on 2011. There
were 83,754 carers (42.9%) who provided up to two hours of unpaid care a day,
which made up 8.3% of the total care hours provided. There were also 16,926 carers
(8.7%) who provided full-time 24 hours per seven-day week unpaid care, which
represented 43% of total care hours provided.
Table 33 – Co. Louth Carers 2011-2016
Mal Female
e
2011 2016 2011 2016
All carers 1,912 2,095 3,036 3,257
1-14 hours unpaid help per week 848 891 1,290 1,314
15-28 hours unpaid help per week 289 342 519 595
29-42 hours unpaid help per week 123 159 212 252
43 or more hours unpaid help per week 366 404 702 689
Not stated - hours unpaid help per week 286 299 313 407
Total Hours Unpaid Help per Week 57,015 63,467 109,255 115,614
Average Hours Unpaid Help per Week 35.1 35.3 40.1 40.6
Source: CSO StatBank / Profile 9 - Health, Disability and Carers / E9049
The table above shows that in Co. Louth between 2011 and 2016 there was an
increase in male carers of 9.6%, and of female carers of 7.3%.
3
2You can also read