MA900 Multi-Application Cell Sorter - Sony Biotechnology Inc.
←
→
Page content transcription
If your browser does not render page correctly, please read the page content below
MA900
Multi-Application
Cell Sorter

Sony Biotechnology Inc.
MA900 Cell Sorter
                                  Sorting Made Simple™

                                  The MA900 from Sony meets the needs of most sorting applica-
                                  tions, supporting 12 fluorescence parameters and 4-way sorting.

                                  Powerful, modern technologies built into the MA900 system
                                  include a patented microfluidic chip-based design, comprehen-
                                  sive fluidic controls, and advanced automation that dramatically
                                  simplifies operation to make sorting less subjective and
                                  improve reliability.

                                  Up to 14 parameters from 4 lasers
Precision benchtop                The MA900 offers choice and flexibility, enabling the detection
                                  of up to 14 parameters. Choose from 4 excitation lasers—488 nm,
system that is easy to            638 nm, 405 nm, and 561 nm—on two beam spots. Free-form
                                  PMTs enable detection of fluorescence signals from each beam
use and supports 12               spot, allowing detection of up to 12 fluorescence parameters
                                  and 2 scatter parameters.
fluorescence parameters
                                  Automation across the workflow
and 4-way sorting                 The MA900 offers a high level of automation. Startup, aseptic
                                  cleaning, QC, and sort setup operate with a touch of a button
                                  to ensure optimal daily alignment of the chip to the lasers,
                                  precise targeting, and fast recovery from clogging. Wizard based
                                  cleaning cycles simplify maintenance and can be customized for
                                  aseptic sorting.

                                  Easy to learn and use
                                  The MA900 software guides operation. Advanced controls
                                  enable customization, and powerful tools let you focus on
                                  the biology, not the cytometer.

                          A compact 21.7” (55 cm) x 21.7” (55 cm) x 28.4” (72 cm)
                          footprint to fit easily on the benchtop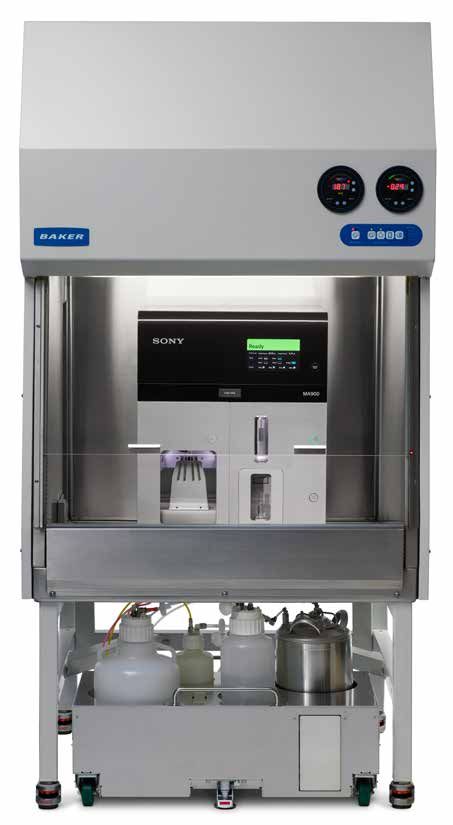
With the highest level of automation
                             available on any cell sorter, the MA900
                             uses sensors, software, and engineering
                             know-how across the workflow from
                             startup to aseptic cleaning, QC, and
                             sort setup. Intelligent automation
                             dramatically simplifies operation and
                             streamlines troubleshooting.

                             Initiation

                             Upon startup, the software initiates con-
                             nection between all subsystems and runs
                             diagnostics that ensure that everything is
                             working properly. Once the subsystems are
                             verified, the software displays status and a
                             green ready message on the instrument’s
                             LCD monitor.

Startup automation ensures
optimal daily alignment of
the chip to the lasers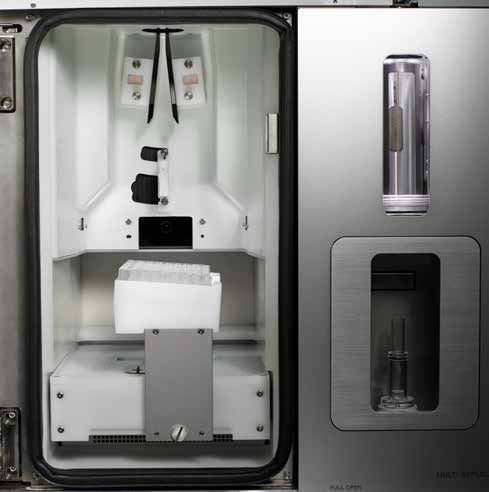
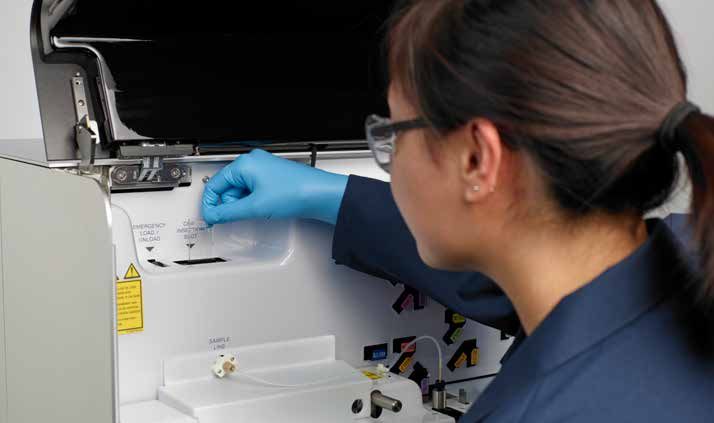
Automated Chip Loading and Positioning            Automated Optical Axis Adjustment            Automated Droplet Calibration

System setup begins with a one-touch              The alignment of the chip to the lasers is   The droplets are automatically calibrated
installation to load the microfluidic flow cell   optimized automatically using patented       by adjusting the frequency and the drop drive
chip. A setup software wizard guides you          technology. AutoSetup beads are used daily   to achieve an optimal breakoff point (BOP)
through the process of loading a sorting          to adjust the X and Z position of the chip   for the 70-μm, 100-μm, and 130-μm
chip, selecting lasers, and inserting the opti-   to ensure consistent results.                sorting chips.
cal filters required. Actuators ensure precise
positioning of the chip inside the chip loader.
The microfluidic sorting chip uses patented
CoreFinder™ technology to automate and
streamline key steps in the workflow includ-
ing chip alignment and accurate calculation
of the laser delay, drop delay, side stream
angle, and breakoff position.

Once the chip is loaded, the fluidics check
starts, and sheath, sample, and vacuum
lines connect and seal automatically to
their respective ports.

                                                  Automation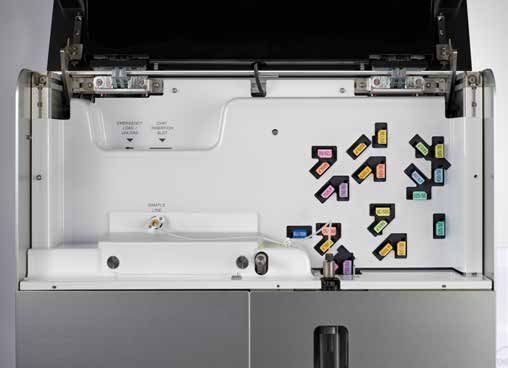
Software-driven workflows
from calibration to cleaning

            Automated Side Stream Calibration             Automated Drop Delay Calibration

            The angle and the position of the side        A dedicated laser and camera perform
            streams are calculated and adjusted during    real-time analysis of droplet images using
            setup for tube and plate sorting. This        AutoSetup beads. Patented technologies
            ensures that the sort stream is centered in   calculate drop delay to ensure cells are
            the collection tube automatically.            sorted to desired purity and yield.

                                                          Automated Quality Control

                                                          Using QC beads, the rCV and linearity are
                                                          measured and can be displayed in Levey-
                                                          Jennings plots. This information helps
                                                          administrators accurately assess optical
                                                          performance over time.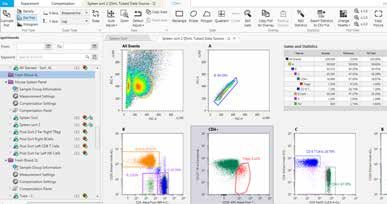
Automated Fluid Sensing

The fluidics cart houses autoclavable sheath,
deionized water, and waste tanks as well
as tanks containing bleach and ethanol.
Weighted sensors on the fluidics cart allow
a real-time measurement of the fluid levels,
which is displayed in the software.

Wizard-Driven Cleaning Cycle

Software guides the operation of default
and custom fluidic system cleaning. Default
cycles include cleaning with bleach or
ethanol. Software guides you through each
step of the selected cleaning cycle. Fluid
is pumped from three cleaning tanks via a
cleaning chip. The software also supports
user-defined protocols for setting the
time for cleaning. In addition, cleaning
reminders can be set up by administrators
for convenience.

                                                Automation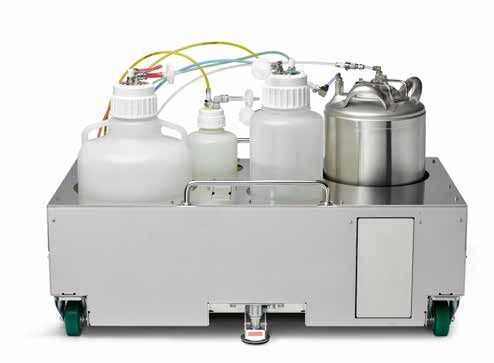
Sorting that adapts to your needs
                   with default and custom sort
                   modes as well as 4-way sorting

Experiment Settings

Experiments can be created by selecting
a new template, a recent experiment,
or a shared template (public) from the
experiment window. If a new template is
selected, the software guides you through
choosing experiment settings such as
sample groups, tubes, and pulse parameters
for data acquisition. Once a template is
selected or created, compensation data can
be acquired easily by using the software
based compensation wizard. Alternatively,
uncompensated populations can be
adjusted using the drag and drop feature
in the software.

Data Display and Using Gates

During acquisition, data is displayed on
worksheets as dot plots and histograms.
Events in the plots can be marked using
gates. A variety of tools are provided to
select, adjust, label, and measure statistics
of target populations. Once acquired, data
can be easily exported as FCS formats to
use with third party analysis software.

Automated Sort Monitoring

The software monitors and actively makes
adjustments to the drop drive to maintain
a stable breakoff point. This feature ensures
consistently good sort performance,
facilitates walk-away operation, and allows
detection of clogs and empty tubes.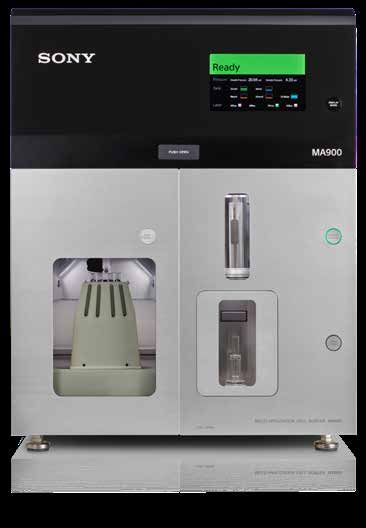
Sorting

     Once events are gated on plots, target
     cells can be sorted for further analysis. Sort
     mode, sort gates, and sort devices can
     be assigned using a simple dialog box. A
     choice of eight default and five custom sort
     modes is available to achieve the desired
     purity and yield of the sorted popu-lation.
     Sort devices supported include
     2-way and 4-way tubes as well as 6-, 12-,
     24-, 48-, 96-, and 384-well plates.

Sorting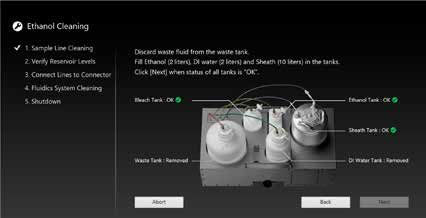
Precision engineering for accurate
cell deposition and easy to use
index sorting software

                               Sort Deposition System

                               The Sort Deposition System is an optional
                               hardware feature that facilitates high-
                               throughput sorting and precise deposition
                               of cells into 6-, 12-, 24-, 48-, 96-, and 384-
                               well plates or PCR plates. Several features
                               on the MA900 enable deposition of single
                               cells at a high efficiency. These include
                               the ability to precisely adjust the position
                               of a plate, assign the center of the drop
                               relative to the target cell position, and utilize
                               custom angled plate holders for multiwell
                               PCR and 384-well plates.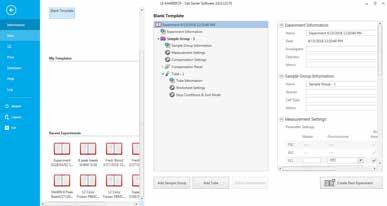
Index Sorting Software

Index sorting software records the X and                                                         After the sort, the index file can be exported                                    These index sort options allow you to
Y coordinates of each event sorted into                                                          in CSV format or analyzed on the cell sorter.                                     perform meta-analysis of data for several
a multiwell device. This very precise and                                                        The Well Select feature lets you choose                                           applications. For example, clonal variability
easy to use software brings powerful                                                             a well and display event(s) sorted in that                                        can be studied based on the expression
capabilities to research, enabling you to                                                        well on bivariate plots and histograms.                                           levels of the fluorescent protein or surface
track the scatter and fluorescence intensity                                                     The Gate Select feature lets you display                                          markers. Also, researchers can integrate
of individual cells sorted in each well.                                                         the location of events on a plate map                                             phenotypic data with mRNA expression
                                                                                                 based on a selected gate.                                                         analysis of the sorted cells.

                              Index Analysis                                         X                                                       Index Analysis                                    X

Analysis Mode:   Well Select Mode                                                                              Analysis Mode:    Gate Select Mode

   Show All Events       Show Cross Lines            Plot Size:     3                                          Selected Gates:   E                              X       Overlay Index Events

  A                                                                                                              A

  B         1        1   10    10                                                                                B                       1     1

  C         1        1   10    10                                                                                C                       2     1

  D         1        1   10    10                                                                                D                       2

  E                                                                                                              E
                                      x1,000

                                                                                                                                                     x1,000

  F                                                                                                              F

  G                                                                                                              G
                                               800                                                                                                            800
  H                                                                                                              H

       1    2        3   4      5    6         600
                                                 7     8     9      10   11     12                                     1    2        3   4     5    6         600
                                                                                                                                                                7   8   9     10    11    12
                                    BSC

                                                                                                                                                   BSC

                                               400                                                                                                            400

                                               200                                                                                                            200

                                                                                           Scatter                                                                                                   46.08%
                                                0                                                                                                              0
                                                      0       200        400         600       800                                                                  0   200        400         600     800
                                                                               FSC                   x1,000                                                                              FSC                  x1,000

                                                                                                 Sorting
High-purity 4-way sorting of a 12-color immunophenotyping panel
A
A B
B CC D
D
106 106 106
x1,000
CD8+ 43.63% CD4+ CD8+ 1.22%
CD45+CD27+ 23.38%
800 105 105
TCR g/d 0.58% 105
CD8 Brilliant Violet 570
CD45RA APC
600
TCR g/d PE
104
104
BSC
CD3- 38.61%
400
104
103
200 0 0
0
Lymphocytes 31.63%
CD3+ 60.45% CD4- CD8- 9.43% CD4+ 45.72%
0
0 200 400 600 800 0 103 104 105 106 0 103 104 105 106 0 103 104 105
FSC x1,000 CD3 Alexa Fluor® 488 CD4 PerCP-Cy5.5 CD27 Brilliant Violet 510
E
E F
F G
G H
H
106 106 106
x1,000
HLA-DR+ 31.66%
105 105
105 800
CD16+CD56+ 53.57%
CD19 Brilliant Violet 421
CD3 Alexa Fluor® 488
104 104
CD56 PE-Cy7
600
104
BSC
CD20+ 12.41%
400
103
103
103
0 0 0
200
CD14+ 2.91%
0
0 103 104 105 106 0 104 105 106 0 104 105 106 0 104 105 106
CD16 PE/Dazzle 594 HLA-DR Alexa Fluor® 700 CD20 Brilliant Violet 605 CD14 APC Cy7Engineered for flexibility to fit
a wide range of applications
II JJ K
K LL
106 106 106
x1,000
HLA-DR+ 99.21%
105 105 105 800
CD19 Brilliant Violet 421
CD16+CD56+ 99.65%
104
CD56 PE-Cy7
TCR g/d PE
600
104
104
BSC
CD3+ 99.49% CD14+ 97.13%
400
103
103
0 0 0 200
0 103 104 105 106 0 103 104 105 106 0 104 105 106 0 104 105 106
CD3 Alexa Fluor® 488 CD16 PE/Dazzle 594 HLA-DR Alexa Fluor® 700 CD14 APC-Cy7
Whole blood was lysed with RBC Lysis Buffer and stained with Alexa Scatter was used for gating lymphocytes (A). The CD3+ population
Fluor® 488 CD3, PerCP-Cy™5.5 CD4, BD Horizon Brilliant™ Violet (B) was used to gate CD4+ and CD8+ cells (C). CD4+ T-cell
570 (BV570) CD8, APC-Cy™7 CD14, PE/Dazzle™ 594 CD16, BV421 subsets were identified based on CD45RA and CD27 expression
CD19, BV605 CD20, BV510 CD27, APC CD45RA, PE-Cy7 CD56, Alexa (D). CD16+CD56+ NK cells were gated from CD3- cells (E).
Fluor® 700 HLA-DR, and PE TCR gamma/delta antibodies. Cells were CD19+CD20+ B cells were gated from CD3- cells (F), and the HLA-
incubated for 20 minutes on ice, washed 2X with staining buffer, DR expression of B cells was analyzed (G). CD14+ monocytes were
and analyzed on the MA900 equipped with 488-nm, 405-nm, and identified based on scatter (H). CD3+ T cells, CD19+CD20+ B cells,
638-nm lasers. CD16+CD56+ NK cells, and CD14+ monocytes were sorted by 4-way
sorting. Post-sort analysis of each sorted population is shown (I–L).
ApplicationsEase-of-use from multicolor
to single-cell analysis
High-purity sorting of a 12-color immunophenotyping panel using 5 violet fluorochromes
A
A B
B C
C D
D
105 106 106
x1,000
CD8+ 41.41% CD4 + CD8+ 0.44%
800 105 105
CD45RA Brilliant Violet 650
104
CD8 PerCP-Cy5.5
600 CD19 9.61% 104
104
CD19 PE
BSC
CD3 73.93%
400
103 103
103
0
200 0 0
Lymphocytes 30. 81%
CD4- CD8- 4.35% CD4 53.8%
0
200 400 600 800 0 103 104 105 0 104 105 0 103 104 105
FSC x1,000 CD3 Alexa Fluor® 488 CD4 Brilliant Violet 750 CCR7 Brilliant Violet 421
E
E F
F G
G H
H
106 105 106
55 HLA-DR 87.74%
105
CD19+ CD20+ 36.56% 105
CD45RA Brilliant Violet 605
44 104
CD3 Alexa Fluor® 488
104
104 33
CD19 PE
Events
CD16 6.14%
103
22
103
103 0
0 0
11
0
0 104 105 106 0 104 105 106 0 103 104 105 106 0 103 104 105
CD20 Brilliant Violet 605 HLA-DR Brilliant Violet 711 CD16 PE/Dazzle 594 CD27 Brilliant Violet 510
I J K
K LL
106 106 105 105
CD8 100%
105 105
104
CD3 Alexa Fluor® 488
104
CD8 PerCP-Cy5.5
CD8 PerCP-Cy5.5
104 104 CD19 99.03%
CD19 PE
CD16 98.75%
103
103 103 103
0 0
0 0
CD4 99.75%
0 104 105 0 104 105 0 103 104 105 0 103 104 105 106
CD4 Brilliant Violet 750 CD4 Brilliant Violet 750 CD3 Alexa Fluor® 488 CD16 PE/Dazzle 594
Whole blood was lysed with RBC Lysis Buffer and stained with the The CD3+ population (B) was used for gating CD4+ and CD8+ cells (C).
following antibodies: Alexa Fluor® 488 CD3, PE CD19, PerCP-Cy5.5 CCR7+CD45RA+ lymphocytes are shown in (D). CD19+CD20+ B cells
CD8, PE/Dazzle 594 CD16, BD Horizon Brilliant Violet 421 (BV421) CCR7, were gated from lymphocytes (E), and the HLA-DR expression of B cells
BV510 CD27, BV605 CD20, BV650 CD45RA, BV711 HLA-DR, and BV750 was analyzed (F). CD16+ NK cells (G) were gated from lymphocytes.
CD4. Cells were incubated for 20 minutes on ice, washed 2X with CD27 expression of CD45RA+ subsets of lymphocytes was analyzed (H).
staining buffer, and analyzed on the MA900. Lymphocytes were gated Using the 4-way sort mode on the MA900 cell sorter, CD4+ and CD8+ T
using the scatter gate (A). cells, CD19+ B cells, and CD16+ NK cells were sorted. Post-sort analysis of
each sorted population is shown (I–L).High-purity sorting of regulatory T cells
A B C D
106 106
x1,000
x1,000
800 800 105 105
CD4+ 32.68%
600 600 104 104 Tregs 97. 91%
CD127 PE
CD127 PE
BSC
BSC
400 400 103 103
Tregs 4.29%
Scatter
200 200 102 102
0 0.1 101 101
0 200 400 600 800 102 103 104 105 106 101 102 103 104 105 106 101 102 103 104 105 106
FSC x1,000 CD4 PerCP-Cy5.5 CD25 Alexa Fluor® 700 CD25 Alexa Fluor® 700
Mouse spleen cells were stained with following antibodies: CD4
PerCP-Cy5.5, Alexa Fluor® 700 CD25, and PE CD127. Cells were
incubated for 20 minutes on ice, washed 2X with staining buffer, and
analyzed on the MA900. Live spleen cells were gated using the scatter
gate (A). The CD4+ population (B) was used to gate CD4+CD25int/
highCD127low regulatory T cells (C). These cells were sorted using the
MA900. Post-sort analysis of the sorted regulatory T cells is shown (D).
Cell cycle analysis of Jurkat cells
550
Jurkat cells were stained using Propidium
x1,000
Iodide (1 µg/mL), and cell cycle analysis was
810 440
performed using the MA900.
620 330
Evetns
BSC
430 220
Scatter
240 110
50 0
50 240 430 620 810 3.8 53 103 152 201 251
FSC x1,000 Propidium Iodide x1,000
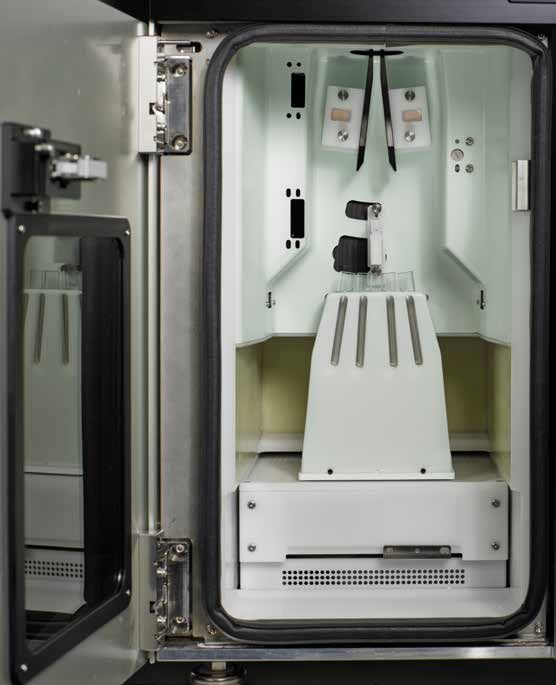
ApplicationsBiosafety Options
If desired, the MA900 can be installed inside
an optional custom class A2 level II biosafety
cabinet for protection for personnel and
products. The custom biosafety cabinets
offered by Sony Biotechnology are designed
and tested by their manufacturers using
microbiological assays with the MA900 in
the work area. The cabinets meet inter-
national standards including the National
Sanitation Foundation Standard 49 (NSF49)
and the European Standard 12469.
The cabinets incorporate a built-in aerosol
management system which operates inde-
pendently to actively evacuate aerosols from
the sort collection chamber. The dual routes
of aerosol evacuation maximize protection.
BiosafetyFluorochrome and Filter Guide
FL1 FL2 FL3 FL4 FL5
Fluorochrome
525/50 585/30 617/30 695/50 785/60
EGFP ●
FITC ●
Alexa Fluor® 488 ●
EYFP ●
mCitrine ●
CFSE ●
PE ●
dsRed ●
tdTomato ●
mCherry ●
PE-Texas Red® ●
PE/Dazzle 594 ●
Propidium Iodide ●
mPlum ●
7-AAD ●
PE-Cy™5 ●
PerCP ●
PE-Cy5.5 ●
PerCP-Cy5.5 ●
PerCP-eFluor 710 ●
PE-Cy7 ●
FL6 FL7 FL8 FL9 FL10 FL11 FL12
450/50 525/50 585/30 617/30 665/30 720/60 785/60
BD Horizon Brilliant
●
Violet (BV421)
Alexa Fluor® 405 ●
DAPI ●
Pacific Blue™ ●
mCFP ●
Hoechst 33342 ●
AmCyan ●
BV510 ●
BV570 ●
BV605 ●
BV650 ●
BV711 ●
BV785 ●
APC ●
Alexa Fluor® 647 ●
APC-Cy5.5 ●
Alexa Fluor® 700 ●
APC-Cy7 ●
APC-Alexa Fluor® 750 ●Specifications
Excitation lasers 488 nm, 638 nm, 405 nm, 561 nm
Output power Optical fiber output : 405 nm: (10 mW max.), 488 nm, 638 nm, and 561 nm: (36 mW max.)
Optics Beam alignment Dual axis optical system
Detection parameters 12 fluorescence + 2 scatter
Pulse measurement Height, Area, Width
Sample tube Single, auto-loading tube
Tube types 0.5-mL, 1.5-mL, 5-mL, and 15-mL tubes
Sort devices 2-way tube, 4-way tube, multiwell plates, PCR plates
Fluidics Temperature control 5°C, 37°C (electric cooling method)
Agitation unit Eccentric rotation
Magnetic drive 300 rpm speed
Sorting chip size 70 µm, 100 µm, 130 µm
Event rate 70,000 eps
Automated frequency search range
• 70 μm : 40 kHz to 52 kHz
• 100 μm [Targeted] setting : 21 kHz to 23.5 kHz
• 100 μm [Standard] setting : 27 kHz to 31 kHz
Sorting speed • 130 μm : 10 kHz to 12 kHz
Sort Using the 70-μm sorting chip at 52 kHz and a threshold rate of 12,000 events per second,
Performance purity >98% and recovery >80% can be achieved. The yield obtained is based on Poisson’s
statistics. Higher threshold events per second can be achieved without affecting purity but
with a decrease in yield based on Poisson’s statistics.
Scatter resolution 0.5 µm
Fluorescence resolutionNorth America/International Japan Europe 1730 North First Street 4-14-1, Asahi-cho, Atsugi-shi, The Heights, Brooklands. San Jose, CA 95112 U.S.A. Kanagawa, 243-0014 Japan Weybridge, Surrey, KT13 0XW, UK Tel: +1 800-275-5963 Tel: +81 120-677-010 Tel: +44 (0) 1932 817448 FAX: +1 408-352-4130 Fax: +81 120-388-060 sales_EU@sonybiotechnology.com sales@sonybiotechnology.com sales_Japan@sonybiotechnology.com https://www.sonybiotechnology.com https://www.sonybiotechnology.com http://www.sony.co.jp/LS ©2018 Sony Biotechnology Inc. All rights reserved. Sony and the Sony logo, CoreFinder, and Sorting Made Simple are trademarks of Sony Corporation. Alexa Fluor®, Texas Red®, and Pacific Blue™ are registered trademarks or trademarks of and licensed under patents assigned to Life Technologies Corporation. BD Horizon Brilliant™ (for BV dyes) is a trademark of Becton, Dickinson and Company. PE/Dazzle is a trademark of BioLegend. Cy is a trademark of GE Healthcare. All other trademarks are property of their respective owners. For non-clinical research use only. Not for use in diagnostic or therapeutic procedures, or for any other clinical purpose. The MA900 Cell Sorter is classified as a Class 1 laser product. 8.01.120219.1
You can also read