Mammals in the Chornobyl Exclusion Zone's Red Forest: a motion-activated camera trap study
←
→
Page content transcription
If your browser does not render page correctly, please read the page content below
Earth Syst. Sci. Data, 15, 911–920, 2023
https://doi.org/10.5194/essd-15-911-2023
© Author(s) 2023. This work is distributed under
the Creative Commons Attribution 4.0 License.

       Mammals in the Chornobyl Exclusion Zone’s Red Forest:
              a motion-activated camera trap study
                Nicholas A. Beresford1,2 , Sergii Gashchak3 , Michael D. Wood2 , and Catherine L. Barnett1
         1 UK Centre for Ecology & Hydrology, Lancaster Environment Centre, Bailrigg, Lancaster, LA11 4AP, UK
            2 Schoolof Science, Engineering and Environment, University of Salford, Manchester, M5 4WT, UK
          3 Chornobyl Center for Nuclear Safety, Radioactive Waste and Radioecology, International Radioecology

             Laboratory, 77th Gvardiiska Dyviiya St. 11, P.O. Box 151, 07100 Slavutych, Kyiv Oblast, Ukraine
                                 Correspondence: Nicholas A. Beresford (nab@ceh.ac.uk)

                               Received: 29 September 2022 – Discussion started: 10 November 2022
                        Revised: 17 January 2023 – Accepted: 24 January 2023 – Published: 23 February 2023

       Abstract. Since the accident at the Chornobyl Nuclear Power Plant in 1986, there have been few studies pub-
       lished on medium and large mammals inhabiting the area from which the human population was removed (now
       referred to as the Chornobyl Exclusion Zone, CEZ). The dataset presented in this paper describes a motion-
       activated camera trap study (n = 21 cameras) conducted from September 2016 to September 2017 in the Red
       Forest located within the Chornobyl Exclusion Zone. The Red Forest, which is likely the most anthropogenically
       contaminated radioactive terrestrial ecosystem on earth, suffered a severe wildfire in July 2016. The motion-
       activated trap cameras were therefore in place as the Red Forest recovered from the wildfire. A total of 45 859
       images were captured, and of these 19 391 contained identifiable species or organism types (e.g. insects). A total
       of 14 mammal species were positively identified together with 23 species of birds (though birds were not a focus
       of the study).
          Weighted absorbed radiation dose rates were estimated for mammals across the different camera trap locations;
       the number of species observed did not vary with estimated dose rate. We also observed no relationship between
       estimated weighted absorbed radiation dose rates and the number of triggering events for the four main species
       observed during the study (brown hare, Eurasian elk, red deer, roe deer).
          The data presented will be of value to those studying wildlife within the CEZ from the perspectives of the
       potential effects of radiation on wildlife and also rewilding in this large, abandoned area. They may also have
       value in any future studies investigating the impacts of the recent Russian military action in the CEZ.
          The data and supporting documentation are freely available from the Environmental Information Data
       Centre (EIDC) under the terms and conditions of a Creative Commons Attribution (CC BY) license:
       https://doi.org/10.5285/bf82cec2-5f8a-407c-bf74-f8689ca35e83 (Barnett et al., 2022a).

1   Introduction                                                   understorey vegetation and, to some extent, with deciduous
                                                                   trees. Whilst over the years many studies have been con-
Following the 1986 Chornobyl Nuclear Power Plant acci-             ducted within the Red Forest (e.g. Geras’kin et al., 2008;
dent, coniferous trees up to 4 km to the west of the reac-         Møller and Mousseau, 2013; Møller et al., 2016; Lavrinienko
tor were killed by radiation over an area of approximately         et al., 2018a, b; Antwis et al., 2021; Beresford et al., 2022),
4–6 km2 (coniferous trees covered approximately 40 % of            none have studied utilisation of the area by medium and large
this area in 1986; Kyiv Politech Institute’s Museum, 2022).        mammals. However, from the study site map within the orig-
The area is now known as the Red Forest, and it is likely          inal paper of Møller and Mousseau (2013), their mammal
the most anthropogenically contaminated radioactive terres-        snow track study did include some sites in the Red For-
trial ecosystem on earth. It has subsequently regenerated with

Published by Copernicus Publications.
912 N. A. Beresford et al.: Mammals in the Chornobyl Exclusion Zone’s Red Forest
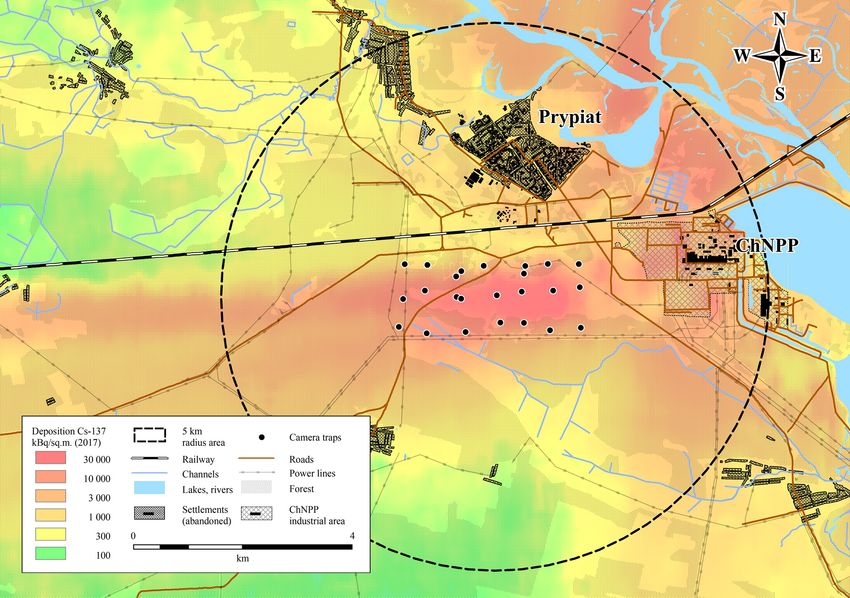
Figure 1. Map showing the location of the study cameras overlaid on a 137 Cs deposition surface (decay corrected to 2017). The large circle
is the 5 km radius area over which absorbed weighted dose rates were calculated. Figure produced by and published with the permission of
the Chornobyl Center.
est, as well as other sites in the Chornobyl Exclusion Zone 2 Materials and methods
(CEZ); this study concluded that the abundance of mam-
mals decreased with increasing radiation across the CEZ as 2.1 Motion-activated digital trap camera deployment
a whole. Other studies across the wider CEZ have found no
evidence of an influence of radiation on the distribution or Twenty-one Little Acorn 6210MC motion-activated digital
abundance/diversity of small-to-large mammals (Baker et al., trap cameras, fitted with 8 GB memory card to record im-
1996; Deryabina et al., 2015; Webster et al., 2016). ages, were installed across the Red Forest in early Septem-
In July 2016 there was a severe fire within the Red Forest ber 2016; the cameras were operated for approximately a
with approximately 80 % of the forest being burnt (Beresford year until September 2017. The cameras were deployed us-
et al., 2021). In September 2016 as one of a number of studies ing an approximate grid pattern with three rows of seven
(e.g. Antwis et al., 2021; Beresford et al., 2021) considering cameras (see Fig. 1). No bait was used to attract animals.
the effects of and recovery from the fire, we set up a network When deploying each camera for the first time, approx-
of 21 motion-activated camera traps across the Red Forest, imately 20 poles (1 m high with markings at every 20 cm)
which were left in place to record primarily medium and were positioned in front of the camera in three parallel rows
large mammals for a period of approximately 1 year. This pa- 1 m apart; each row began 3 m in front of the camera and
per describes and discusses this study; all the photographs are ended 8 m away from the camera. The camera was then ac-
freely available from https://doi.org/10.5285/bf82cec2-5f8a- tivated to capture an image of the poles in situ, and the
407c-bf74-f8689ca35e83 (Barnett et al., 2022a). poles were then removed (an image of the pole positions
at sites where these were recorded has been included within
the dataset associated with this study (Barnett et al., 2022a);
some of these images contain images of co-authors with their
Earth Syst. Sci. Data, 15, 911–920, 2023 https://doi.org/10.5194/essd-15-911-2023N. A. Beresford et al.: Mammals in the Chornobyl Exclusion Zone’s Red Forest 913
permission). The images of the poles can be used to esti- during each deployment period; and any notes relevant to
mate animal height and distance from the camera should this the cameras or their operation.
be desired. Tree branches, tall grasses and bushes that were At sites 163, 168 and 169, the trap cameras were stolen
likely to obscure the camera or cause false activation by their during setup 1; therefore, no images from these cameras
movement were cleared from an area of about 40–60 m2 in were recovered for that setup. The cameras were replaced
front of the camera at the initial setup and, when necessary, at the start of setup 2 with new cameras located at nearby
throughout the study. sites 362, 364 and 365, respectively. During setup 2, cam-
Each camera was mounted at a height of approximately eras from sites 157, 164, 170, 175 and 362 were stolen and
0.7 m (typically attached to trees) to principally record im- not replaced, and the memory cards from cameras 158 and
ages of medium and large mammals, although images of 171 were changed part way through; during setup 3, cam-
small mammals, birds and occasional insects were also cap- era 158 did not operate. In total, images were recovered from
tured. The cameras were positioned such that they mostly 18 cameras for setup 1, from 16 cameras for setup 2 and from
faced north to shelter them from false activation caused by 15 cameras for setup 3. The camera located at site 172 was
direct sunlight. When triggered by movement, all the cam- set to record video in error during setup 1 at a service visit in
eras were preset to take a three-image burst; the interval be- late October (photographs were recorded September to Oc-
tween these three images was < 1 s. The time delay between tober as for the other cameras); the videos (20 s each) are
one three-burst cycle and any immediate subsequent cycle included in the image catalogue and have been analysed in
was approximately 2–4 s; it was therefore possible that some the same way as the photographs (see Sect. 2.3).
animals may not have been captured if they were moving
rapidly across the field of view during this time. All the cam- 2.2 Study site and site characteristics
eras were capable of capturing images both day and night
(and during the transition period in between) by using an in- The site descriptive parameters, recorded by the same per-
frared sensor and invisible infrared flash (850 or 940 nm, ca- son for every site in early September 2016, include the fol-
pable of lighting an area of up to 10 m in front of the camera); lowing: numerical site identifier and location (latitude and
the appropriate day/night/transition setting is subjective as longitude, WGS84); ambient dose rate measured at a height
the camera automatically chooses the appropriate day/night/- of 1 m above soil surface; an evaluation of the fire dam-
transition setting based on light level. All the cameras were age as visible in September 2016 (“none”, “low”, “medium”
inspected, and the data (images and image metadata) down- or “high”) together with an estimate of the percentage of
loaded from the memory cards on three occasions during the the area within 100 m of the site affected by the fire; an
study (March, June and September 2017). These are referred estimation of the density of grassy vegetation and under-
to as setups 1–3 in the accompanying dataset; the cameras growth over a 20 m radius of the camera location; notes
were also randomly inspected throughout the year to check on habitat within a 100 m radius of the camera location;
functionality (and to ensure they had not been stolen). The the dominant (> 80 %) tree species present and the approx-
images and image metadata were supplied to the UK Centre imate age of trees within a 100 m radius of the site; and
for Ecology & Hydrology (UKCEH) by Chornobyl Center as the presence (or absence) of animal trails/tracks or water
*.jpeg, *.avi and *.xlsx files. The image catalogue described sources within 20 m of the site. The dataset also contains
in Sect. 2.3 was then populated by UKCEH using these files. an estimate of the 137 Cs and 90 Sr soil activity concentra-
Information related to each camera and each de- tions (kBq m−2 ) averaged over a 500 m radius centred on
ployment period has been provided in file “RED- the camera site estimated from a spatial dataset (Shestopalov,
FIRE_Trap_Camera_Details_And_Image_Summary”, 1996) and decay corrected to 1 March 2017. The Shestopalov
which is included within the dataset associated with this (1996) data are presented as becquerel per square metre
study (Barnett et al., 2022a). The information provided (Bq m−2 ); to convert to becquerel per kilogram (Bq kg−1 ),
includes the following: location (site number); numerical we assumed a soil bulk density of 1.14 g cm−3 dry mass esti-
camera identifier; setup number (1, 2 or 3; see above); mated from data for the Red Forest (Barnett et al., 2021b),
start date and time and end date; time of each deployment assuming a 10 cm soil depth as required for the subse-
period (most cameras were set to record at eastern European quent estimation of estimated weighted absorbed dose rates
summer time throughout with the exception of cameras (see below). This information is provided in the file “RED-
155 and 156 during setup 2, which were set to record at FIRE_Trap_Camera_Site_Descriptions” within the dataset
eastern European winter time in error, and cameras 161 associated with this study (Barnett et al., 2022a).
and 174 from setup 1, where the time shown on the image
was recorded incorrectly; the data related to date and time 2.3 Image catalogue
has therefore been manually corrected within the image
catalogue to eastern European summer time for these four The image catalogue contains a description of information
cameras); the total number of days each camera was in use related to each image. The majority of the images obtained
have been included within the dataset associated with this
https://doi.org/10.5194/essd-15-911-2023 Earth Syst. Sci. Data, 15, 911–920, 2023914 N. A. Beresford et al.: Mammals in the Chornobyl Exclusion Zone’s Red Forest study (Barnett et al., 2022a). However, to protect privacy, is allocated a new triggering event number)). If the image any images containing people have not been included, al- was too poor to definitely identify the animal, the species though observations of people (other than members of the re- common name was recorded as “Unidentifiable”. Occasion- search team setting up and servicing the cameras) have been ally for such images, the potential species/animal type was recorded in the catalogue. For cataloguing the images, a trig- entered into the notes column. Images containing no images gering event was assumed to begin when the camera motion of animals are included within the dataset associated with sensor was triggered by an animal. A new triggering event this study; these are catalogued separately. was not assumed until at least 90 s had elapsed since an ani- mal was last observed. However, there may be longer time 2.4 Quality control periods between triggering events where images are obvi- ously part of the same sequence (e.g. an animal lays down Data were entered into the image catalogue by UKCEH staff for a period of time). (who were not aware of the comparative contamination lev- Within the dataset associated with this study (Barnett et els at the different camera sites), these data were then com- al., 2022a), all the images (including those which did not pared to a second set of data entered into a second catalogue capture any animal) are located within three sub-folders by staff at the Chornobyl Center; any disparities were inves- called REDFIRE_Setup_1, REDFIRE_Setup_2 and RED- tigated and amended manually where necessary. Once this FIRE_Setup_3, and within each of these folders are multi- check was completed a final check was conducted by further ple sub-folders (with the format “Setup1_Site155_2317”), UKCEH staff to ensure the information within the catalogue which correspond to the “Image_Location_Folder_Name” matched the images included within the dataset. column within the image catalogue described below. Within each of these sub-folders are further sub-folders entitled the 2.5 Estimation of total weighted absorbed dose rate common species names of animals observed. The individual images of each animal are located within these folders and Indicative total weighted absorbed dose rates (i.e. internal are supplied as *.jpg files and have the format IMAG0016. plus external exposures) have been estimated for example As noted in Sect. 2.2, at site 172 the camera was set, at a mammals in the study area using the ERICA Tool (v2.0; service visit in October, to record videos in error; the text Brown et al., 2016). As inputs to the dose estimation, the “Video” has been used within the notes column of the image 137 Cs and 90 Sr soil activity concentrations estimated for a catalogue to identify where video rather than photographs 500 m radius around each camera site (see above) were used. was recorded (camera 172 setup 1 only); the videos have This area equates to the potential home range of brown hare, been provided within the dataset. which is likely the species with the smallest home range of In the file “REDFIRE_Trap_Camera_Image_Catalogue”, the most commonly observed mammals (Schai-Braun and which is included within the dataset associated with this Hackländer, 2014; CABI, 2013). However, it is unlikely that study (Barnett et al., 2022a), each image record (row) the majority of mammal species observed would spend all of within the catalogue gives details of the following: setup their time within the relatively small area of the Red Forest. number (1, 2 or 3; see Sect. 2.2); location (site num- Therefore, 137 Cs and 90 Sr soil activity concentrations were ber); numerical camera identifier; image location folder estimated over an area with a radius of 5 km, centred on the name (see above, e.g. Setup1_Site155_2317); image file- middle of the Red Forest, which may be appropriate for the name (e.g. IMAG0127); date, time and period of the day larger species observed (e.g. Okarma et al., 1998; Ofstad et (day, night, transition) related to when the image was cap- al., 2016). All soil radionuclide activity concentrations were tured; the common name of species captured in the image; decay corrected to 1 March 2017 (approximately the mid- the number of animals visible in the image; the number of point of the study). The ERICA Tool contains a default ter- animals seen per triggering event (cumulative; the trigger- restrial organism “Mammal – large” with dimensions equat- ing event number is recorded as “n/a” for observations of ing to a large deer species (mass 245 kg) and total dose rates people); triggering event number (sequential); the tempera- were estimated for this default organism. For comparison, an ture when image was captured (◦ C, recorded by the camera organism was created in the ERICA Tool equating to a red at the start of each new triggering event (note this measure- fox, a regularly observed smaller species which may spend ment is indicative only and not an absolute value (e.g. di- part of its time underground (assumed dimensions for the red rect sun on the camera affects the temperature recorded)); fox were 0.4 × 0.15 × 0.2 m with a mass of 6.6 kg; Pröhl, a marker (“Y”) identifying the start of each new triggering 2003). The large mammal geometry was assumed to spend event; a marker (“Y”) identifying if an obviously young an- 100 % of its time on the ground surface, and the red fox imal is present within the image (this is subjective and may 10 % of time underground (Brown et al., 2003). The prob- not always have been noted); and notes relating to the image abilistic “Tier 3” of the ERICA Tool was used for inputting (e.g. two species present within the image (where this oc- mean and standard deviation soil activity concentrations. Soil curs the data for the image is entered twice, once for the first dry matter was assumed to be 100 %; this assumption seems species and again for the second species; the second species reasonable given that measured soil dry matter percentages Earth Syst. Sci. Data, 15, 911–920, 2023 https://doi.org/10.5194/essd-15-911-2023
N. A. Beresford et al.: Mammals in the Chornobyl Exclusion Zone’s Red Forest                                                                             915

from other studies give typical values for the Red Forest of     Table 1. Species captured on the motion-activated digital trap cam-
circa 90 %, ranging from approximately 70 %–100 % (see           eras.
Barnett et al., 2021a, b). The default mammal concentration
ratios (and associated probability distribution functions) in             Common species name                     Latin species namea
the ERICA Tool were used to estimate whole-body radionu-                  Mammals
clide activity concentrations of the animals and consequently
the internal dose rate; default radiation weighting factors of            Brown hare                              Lepus europaeus
                                                                          Eurasian elk                            Alces alces
3 for low-energy beta emissions and 1 for other beta and
                                                                          Eurasian lynx                           Lynx lynx
gamma emissions were used. The resultant mean, variance                   European badger                         Meles meles
and median estimates of total weighted absorbed dose rates                Domesticated dog (feral)                Canis lupus familiaris
were recorded for each of 137 Cs and 90 Sr (all estimates are             Grey wolf                               Canis lupus
presented in micrograys per hour (µGy h−1 ) in Barnett et al.,            Marten sp.                              Martes (genus)
2022a).                                                                   Mouse sp.b                              Muridae (family)
                                                                          Przewalski’s horse                      Equus ferus przewalskii
                                                                          Raccoon dog                             Nyctereutes procyonoides
3    Overview of images included within the catalogue                     Red deer                                Cervus elaphus
                                                                          Red fox                                 Vulpes vulpes
A total of 45 857 images were captured (not including pho-                Red squirrel                            Sciurus vulgaris
tographs recorded during camera setup and servicing); of                  Roe deer                                Capreolus capreolus
these, 19 391 contained identifiable species or organism                  Wild boar                               Sus scrofa
                                                                          Unidentifiablec                         Not applicable
types (e.g. insects), 565 recorded people, 349 were of poor
quality such that the species could not be determined and                 Birds
25 552 images recorded no animals (i.e. predominantly false               Black grouse                            Lyrurus tetrix
triggers due to vegetation movement, light or potentially a               Common blackbird                        Turdus merula
triggering by an animal that was not captured). A total of 14             Common buzzard                          Buteo buteo
mammal species were positively identified together with 23                Common quailb                           Coturnix coturnix
species of birds (Table 1).                                               Common snipeb                           Gallinago gallinago
   A summary of the images within the catalogue (e.g. num-                Common wood pigeon                      Columba palumbus
                                                                          Corncrakeb                              Crex crex
ber of images with mammals, birds, or insects; number of
                                                                          Eurasian bittern                        Botaurus stellaris
images with nothing; number of images with people in) and                 Eurasian hoopoe                         Upupa epops
the total number of triggering events recorded (by setup,                 Eurasian jay                            Garrulus glandarius
by site, by camera) has been provided in the file “RED-                   Eurasian sparrowhawk                    Accipiter nisus
FIRE_Trap_Camera_Details_And_Image_Summary”                               Eurasian woodcock                       Scolopax rusticola
within the dataset associated with this study                             European nightjar                       Caprimulgus europaeus
(Barnett et al., 2022a). The dataset also pro-                            European robin                          Erithacus rubecula
                                                                          Fieldfare                               Turdus pilaris
vides a summary for mammals (filename: “RED-
                                                                          Finch sp.                               Fringillidae (family)
FIRE_Trap_Camera_Summary_Mammals”), by species,                           Great egret                             Egretta alba
by camera and by setup of the number of triggering                        Great grey shrike                       Lanius excubitor
events and the mean, minimum and maximum of the                           Great spotted woodpecker                Dendrocopos major
number of individuals recorded per triggering event. For                  Great tit                               Parus major
ease of comparing across setups, triggering events are                    Hazel grouse                            Tetrastes bonasia
presented as events per 75 camera trap days; 75 d was                     Marsh titb                              Poecile palustris
                                                                          Mistle thrush                           Turdus viscivorus
the shortest deployment period (setup 3). A similar sum-
                                                                          Red-backed shrike                       Lanius collurio
mary for birds (which were not the target of this study)                  Shrike sp.                              Lanius sp.
can also be found in Barnett et al. (2022a) (filename:                    Song thrush                             Turdus philomelos
“REDFIRE_Trap_Camera_Summary_Birds_And_Other”).                           Thrush sp.                              Turdus sp.
   The mammalian species observed in the Red Forest (Ta-                  Unidentifiable birdc                    Not applicable
ble 1) included most of those observed in our other camera                Other species
trapping studies across the CEZ (Wood and Beresford, 2016).
Exceptions were that we did not observe brown bear (Ursus                 Unidentifiable insect                   Insecta (class)
                                                                          Butterfly or moth                       Lepidoptera (order)
arctos), European bison (Bison bonasus) or Eurasian beaver
                                                                          Dragonfly                               Odonata (order)
(Castor fiber). The lack of these species in the Red Forest is            Spider                                  Araneae (order)
to be expected:                                                          a In some instances, animals are identified at the class, order, family level
                                                                         only. b Species is only mentioned within the notes column of the image
    – The Red Forest did not contain suitable habitat for                catalogue (i.e. as a potential but not definitive observation). c Mammal or
                                                                         bird which could not be positively identified at species/genus level.
      beaver during the study period.

https://doi.org/10.5194/essd-15-911-2023                                                    Earth Syst. Sci. Data, 15, 911–920, 2023
916 N. A. Beresford et al.: Mammals in the Chornobyl Exclusion Zone’s Red Forest
Table 2. Summary of medium and large mammal observations by setup.
Species Setup 1 Setup 1 Setup 1 Setup 2 Setup 2 Setup 2 Setup 3 Setup 3 Setup 3
Number Mean Mean/ Number Mean Mean/ Number Mean Mean/
of cam- number maximum of cam- number maximum of cam- number maximum
eras trig- number of eras trig- number of eras trig- number of
species gering animals species gering animals species gering animals
ob- events recorded ob- events recorded ob- events recorded
served per 75 d per trig- served per 75 d per trig- served per 75 d per trig-
on gering on gering on gering
event event event
Brown hare 16 6.1 1.0/2 16 27.0 1.1/3 13 15.9 1.0/1
Eurasian elk 18 5.4 1.2/3 16 6.3 1.3/3 15 12.8 1.3/3
Eurasian lynx 6 0.6 1.2/2 2 1.5 1.0/1 1 2.0 1.0/1
European badger 3 0.5 1.0/1 4 2.7 1.0/1 2 1.5 1.0/1
Domesticated dog (feral) 4 1.0 2.1/4 6 1.5 6.0/4 3 2.0 1.7/5
Grey wolf 13 0.9 1.6/6 5 0.9 1.2/2 5 1.8 1.1/2
Przewalski’s horse 6 1.5 1.2/5 5 1.5 1.2/3 n/a n/a n/a
Raccoon dog 2 0.8 1.0/1 8 2.3 1.0/2 8 3.4 1.0/2
Red deer 15 2.7 1.5/8 13 5.4 1.4/4 10 6.6 1.4/6
Red fox 9 2.1 1.1/2 9 3.9 1.0/1 7 3.1 1.0/1
Roe deer 15 1.4 1.3/4 16 8.1 1.1/1 13 7.1 1.2/3
Wild boar 5 0.8 2.0/6 6 1.4 2.5/7 n/a n/a n/a
Deployment periods were the following: setup 1: September 2016 to March 2017; setup 2: March–June 2017; setup 3: June–September 2017. The total number of cameras operating
in setups 1, 2 and 3 were 18, 16 and 15, respectively. n/a: not applicable, species not observed.
– Photographic evidence of European bison in the that had been burnt, potentially attracted by the new growth
Ukrainian CEZ was first recorded in 2015 at a site close of grassy vegetation.
to the Belarusian border (the species having been in-
troduced into the Belarusian CEZ in 1996) (Gashchak
et al., 2017); only one individual bull was recorded by 4 Estimated weighted absorbed dose rates
camera traps 2015–2016 in the Ukrainian CEZ.
Table 3 presents a summary of estimated total (internal plus
– The numbers of brown bear in the Ukrainian CEZ are external) weighted absorbed radiation dose rates for the ex-
low with no recorded sightings in the vicinity of the Red ample large mammal and red fox for each camera loca-
Forest at the time of this study (Gashchak et al., 2016). tion, assuming a home range of 0.5 km radius and also over
a radius of 5 km centred on the middle of our study area
A number of images recorded small groups of feral (domes- as estimated using the ERICA Tool. All mean, and most
ticated) dogs which we have not observed elsewhere in the median, estimated dose rates are above the lower end of
CEZ. It is likely that these are animals fed by workers at the International Commission on Radiological Protections
the nearby nuclear power plant complex. Images of so-called (ICRP) Derived Consideration Reference Level (DCRL) for
“stalkers” (illegal tourists) were also captured; these are not mammals of 1 mGy d−1 (approximately 40 µGy h−1 ) (Inter-
included in the dataset though they are identified in the image national Commission on Radiological Protection, 2008). The
catalogue. DCRLs are 1 order of magnitude dose rate bands, for mam-
For mammals, Table 2 presents a summary by species and mals 1–10 mGy d−1 , within which radiation effects may be
setup. For a number of species (brown hare, roe deer, red expected to occur.
deer), the number of triggering events was higher in setups 2 Our results do not support the low mammal abundance at
and 3; for Eurasian elk, triggering events were highest during Red Forest sites reported from the 2009 snow track study of
setup 3 (Table 2). Whilst wild boar and Przewalski’s horse Møller and Mousseau (2013). Furthermore, we observed no
were observed during setups 1 and 2, none were recorded reduction in the abundance of mammals with increasing total
during setup 3. Observations of Eurasian lynx, European weighted dose rate (which ranged over circa 1 order of mag-
badger and Raccoon dog were lowest during setup 1. Young nitude). The number of species observed at camera locations
(newborn) Eurasian elk started to be observed in April/- was relatively consistent with estimated median weighted ab-
May 2017, with young red deer and roe deer being observed sorbed radiation dose rate (Fig. 2). We also observed no rela-
from June. Przewalski’s horse were only observed in areas tionship between estimated median weighted absorbed radi-
Earth Syst. Sci. Data, 15, 911–920, 2023 https://doi.org/10.5194/essd-15-911-2023N. A. Beresford et al.: Mammals in the Chornobyl Exclusion Zone’s Red Forest 917
Table 3. Estimated weighted absorbed dose rates to mammals comparing those estimated for a large mammal (a deer) and a relatively small
mammal spending some time underground (red fox). Estimates are presented for an area of 5 km radius centred on the Red Forest and also
for an area of 0.5 km radius centred on each camera site.
Site Large mammal Large mammal Large mammal Red fox Red fox Red fox
total dose rate total dose rate total dose rate total dose rate total dose rate total dose rate
(µGy h−1 ) (µGy h−1 ) (µGy h−1 ) (µGy h−1 ) (µGy h−1 ) (µGy h−1 )
Mean SD Median Mean SD Median
5 km radius area 47 123 17 40 100 16
155 94 188 44 81 150 40
156 197 366 99 168 281 89
157 90 166 45 78 131 41
158 132 270 61 113 216 55
159 413 675 227 348 512 205
160 171 363 77 145 282 70
161 293 543 146 247 412 132
162 448 725 247 377 550 223
164 95 222 40 80 171 37
165 386 620 215 324 469 193
166 262 463 136 221 349 123
167 183 299 100 154 226 90
170 182 322 97 150 233 86
171 131 211 72 109 158 65
172 105 177 57 86 129 50
173 164 282 87 134 204 78
174 55 132 23 46 98 21
175 40 98 29 33 71 15
364 277 452 152 230 336 137
365 130 270 60 109 199 55
Figure 2. Number of species observed by estimated weighted absorbed dose rate (note the estimated weighted absorbed dose rates presented
are those estimated for the geometry approximating to a red fox).
https://doi.org/10.5194/essd-15-911-2023 Earth Syst. Sci. Data, 15, 911–920, 2023918 N. A. Beresford et al.: Mammals in the Chornobyl Exclusion Zone’s Red Forest
Figure 3. Relationship between number of triggering events and estimated absorbed weighted dose rates (using that calculated for the red
fox geometry as an example); data presented are from setup 3.
ation dose and the number of triggering events for the main ducted the fieldwork maintaining cameras and making field notes;
species observed (brown hare, Eurasian elk, red deer, roe CLB and SG, with input from NAB and QC’d, compiled the image
deer) (see examples from setup 3 in Fig. 3). catalogue and accompanying documentation (Barnett et al., 2022a);
NAB and CLB drafted the paper to which SG contributed and MDW
reviewed.
5 Data availability
The data described here (https://doi.org/10.5285/bf82cec2-
Competing interests. The contact author has declared that none
5f8a-407c-bf74-f8689ca35e83; Barnett et al., 2022a) are of the authors has any competing interests.
freely available from the Environmental Information Data
Centre (https://eidc.ac.uk/, last access: 16 January 2023) un-
der a Creative Commons Attribution (CC BY) licence. Disclaimer. Publisher’s note: Copernicus Publications remains
neutral with regard to jurisdictional claims in published maps and
6 Applications of data institutional affiliations.
The data presented will be of value to those studying wildlife
within the CEZ from the perspectives of the potential effects Acknowledgements. The authors are grateful to the following
of radiation on wildlife and also rewilding in this large, aban- people for their assistance during the project: Eugene Guliaichenko
doned area. Together with other trap camera datasets being (Chornobyl Center) for assistance during fieldwork and Claire Wells
(UKCEH) for assistance with data entry. We also thank Jacky Chap-
published (e.g. Barnett et al., 2022b; Gashchak et al., 2022),
low (UKCEH) for proofreading the article.
the data will help in establishing a picture of wildlife across
the CEZ. The data may also have value in any future studies
investigating the impacts of recent Russian military action in
Financial support. This study was funded by the Natu-
the CEZ. ral Environment Research Council (NERC) as part of the
RED FIRE project (Radioactive Environment Damaged by
Fire: a Forest in Recovery, https://www.ceh.ac.uk/our-science/
Author contributions. NAB and MDW secured funding for the
study; NAB, MDW and SG defined the study protocols; SG con-
Earth Syst. Sci. Data, 15, 911–920, 2023 https://doi.org/10.5194/essd-15-911-2023N. A. Beresford et al.: Mammals in the Chornobyl Exclusion Zone’s Red Forest 919
projects/red-fire-radioactive-environment-damaged-fire, last ac- radiation from radionuclides in the environment, Frame-
cess: 26 March 2022; grant no. NE/P015212/1). work for Assessment of Environmental Impact (FAS-
SET), Deliverable 3, Contract No FIGE-CT-2000-00102,
https://wiki.ceh.ac.uk/download/attachments/115802176/fasset_
Review statement. This paper was edited by David Carlson and d5.pdf?version=1&modificationDate=1263905014000&api=v2
reviewed by two anonymous referees. (last access: 17 February 2023), 2003.
Brown, J. E., Alfonso, B., Avila, R., Beresford, N. A., Cop-
plestone, D., and Hosseini, A.: A new version of the ER-
ICA tool to facilitate impact assessments of radioactivity on
References wild plants and animals, J. Environ. Radioact., 153, 141–148,
https://doi.org/10.1016/j.jenvrad.2015.12.011, 2016.
Antwis, R. E., Beresford, N. A., Jackson, J. A., Fawkes, R., Bar- CABI: Invasive Species Compendium, Lepus europaeus (Euro-
nett, C. L., Potter, E., Walker, L., Gaschak, S., and Wood, M. pean hare), https://www.cabi.org/isc/datasheet/77227 (last ac-
D.: Impacts of radiation on the bacterial and fungal microbiome cess: 16 January 2023), 2013.
of small mammals in the Chernobyl Exclusion Zone, J. Anim. Deryabina, T. G., Kuchmel, S. V., Nagorskaya, L. L., Hin-
Ecol., 90, 2172–2187, https://doi.org/10.1111/1365-2656.13507, ton, T. G., Beasley, J. C., Lerebours, A., and Smith,
2021. J. T.: Long-term census data reveal abundant wildlife
Baker, R. J., Hamilton, M. J., Van Den Bussche, R. A., Wig- populations at Chernobyl, Curr. Biol., 25, R811–R826,
gins, L. E., Sugg, D. W., Smith, M. H., Lomakin, M. D., https://doi.org/10.1016/j.cub.2015.08.017, 2015.
Gaschak, S. P., Bundova, E. G., Rudenskaya, G. A., and Chesser, Gashchak, S., Gulyaichenko, Y., Beresford, N. A., and Wood, M.
R. K.: Small mammals from the most radioactive sites near D.: Brown bear (Ursus arctos L.) in Chornobyl exclusion zone,
the Chernobyl nuclear power plant, J. Mamm., 77, 155–170, Proceedings of the Theriological School, 14, 71–84, 2016.
https://doi.org/10.2307/1382717, 1996. Gashchak, S., Gulyaichenko, Y., Beresford, N. A., and Wood, M.
Barnett, C. L., Gashchak, S., Maksimenko, A., Chaplow, D.: European bison (Bison bonasus) in the Chornobyl exclusion
J. S., Wood, M. D., and Beresford, N. A.: Soil and zone (Ukraine) and prospects for its revival, Proceedings of the
vegetation radionuclide activity concentrations and calcu- Theriological School, 15, 58–66, 2017.
lated dose rates from the Red Forest, Chernobyl, Ukraine, Gashchak, S., Paskevych, S., Gulyaichenko, E., Vishnevskyi, D.,
2016–2017, NERC Environmental Information Data Cen- Barnett, C. L., and Beresford, N. A.: Motion-activated camera
tre [data set], https://doi.org/10.5285/60782622-7bfa-4615-a9e3- trap images of Eurasian Lynx in the Ukrainian Chornobyl Exclu-
0a802a9f4674, 2021a. sion Zone, 2012–2018, NERC Environmental Information Data
Barnett, C. L., Gashchak, S., Wells, C., Maksimenko, A., Chaplow, Centre [data set], https://doi.org/10.5285/c099d04e-72e0-4ee9-
J., Wood, M. D., Parekh, N. R., and Beresford, N. A.: Soil biolog- ac72-11dc004ec1f6, 2022.
ical activity in the Chernobyl Exclusion Zone, Ukraine, Septem- Geras’kin, S. A., Fesenko, S. V., and Alexakhin, R.
ber 2005 and spring 2016, NERC EDS Environmental Infor- M.: Effects of non-human species irradiation after the
mation Data Centre [data set], https://doi.org/10.5285/19babe1c- Chernobyl NPP accident, Environ. Int., 34, 880–897,
b3a3-488c-b4fe-ebb4ab9237d8, 2021b. https://doi.org/10.1016/j.envint.2007.12.012, 2008.
Barnett, C. L., Gashchak, S., Wells, C., Guliaichenko, E., Wood, International Commission on Radiological Protection (ICRP): En-
M. D., and Beresford, N. A.: Motion-activated camera trap vironmental Protection – the Concept and Use of Reference An-
images of wildlife from the Red Forest, Chornobyl, Ukraine, imals and Plants, ICRP Publication 108, Ann. ICRP 38, 4–6,
2016–2017, NERC EDS Environmental Information Data Cen- 2008.
tre [data set], https://doi.org/10.5285/bf82cec2-5f8a-407c-bf74- Kyiv Politech Institute’s Museum: https://museum.kpi.ua/map/
f8689ca35e83, 2022a. ?d=chornobyl&l1=1972-01-24.US.KH.1202-1.47.F14&l2=
Barnett, C. L., Gashchak, S., Wood, M. D., and Beresford, N. A.: &z=15&lon=30.103800&lat=51.389000 (last access: 16 Jan-
Wildlife camera trap photographs from the Chornobyl Exclu- uary 2023), 2022.
sion Zone, Ukraine (June 2020–November 2020) following ex- Lavrinienko, A., Mappes, T., Tukalenko, E., Mousseau, T. A.,
tensive wildfires, NERC EDS Environmental Information Data Møller, A. P., Knight, R., Morton, J. T., Thompson, L. R., and
Centre [data set], https://doi.org/10.5285/9bd7754d-ea87-4b35- Watts, P. C.: Environmental radiation alters the gut microbiome
bec1-f39d5cc76db6, 2022b. of the bank vole Myodes glareolus, ISME Journal, 12, 2801–
Beresford, N. A., Barnett, C. L., Gashchak, S., Kashparov, V., 2806, https://doi.org/10.1038/s41396-018-0214-x, 2018a.
Kireev, S., Levchuk, S., Morozova, V., Smith, J. T., and Wood, Lavrinienko, A., Tukalenko, E., Mappes, T., and Watts, P.
M. D.: Wildfires in the Chernobyl Exclusion Zone – risks, con- C.: Skin and gut microbiomes of a wild mammal re-
sequences and management, Integr. Environ. Assess. Manag., 17, spond to different environmental cues, Microbiome, 6, 1–16,
1141–1150, https://doi.org/10.1002/ieam.4424, 2021. https://doi.org/10.1186/s40168-018-0595-0, 2018b.
Beresford, N. A., Wood, M. D., Gashchak, S., and Bar- Møller, A. P. and Mousseau, T. A.: Assessing effects of radia-
nett, C. L.: Current ionising radiation doses in the tion on abundance of mammals and predator–prey interactions in
Chernobyl Exclusion Zone do not directly impact on Chernobyl using tracks in the snow, Ecol. Indicat., 26, 112–116,
soil biological activity, PLoS ONE, 17, e0263600, https://doi.org/10.1016/j.ecolind.2012.10.025, 2013.
https://doi.org/10.1371/journal.pone.0263600, 2022. Møller, A. P., Morelli, F., Mousseau, T. A., and Tryjanowski, P.:
Brown, J., Strand, P., Hosseini, A., and Børretzen, P.: Hand- The number of syllables in Chernobyl cuckoo calls reliably indi-
book for assessment of the exposure of biota to ionising
https://doi.org/10.5194/essd-15-911-2023 Earth Syst. Sci. Data, 15, 911–920, 2023920 N. A. Beresford et al.: Mammals in the Chornobyl Exclusion Zone’s Red Forest cate habitat, soil and radiation levels, Ecol. Indicat., 66, 592–597, Schai-Braun, S. C. and Hackländer, K.: Home range use by the Eu- https://doi.org/10.1016/j.ecolind.2016.02.037, 2016. ropean hare (Lepus europaeus) in a structurally diverse agricul- Ofstad, E. G., Herfindal I., Solberg, J. E., and Sæther, B.-E.: Home tural landscape analysed at a fine temporal scale, Acta. Theriol., ranges, habitat and body mass: simple correlates of home range 59, 277–287, https://doi.org/10.1007/s13364-013-0162-9, 2014. size in ungulates, P. Roy. Soc. B., 283, 2832016123420161234, Shestopalov, V. M.: Atlas of Chernobyl exclusion zone, Ukrainian https://doi.org/10.1098/rspb.2016.1234, 2016. Academy of Science, Kyiv, 1996 (in Russian/English). Okarma, H., J˛edrzejewski, W., Schmidt, K., Śnieżko, S., Webster, S. C., Byrne, M. E., Lance, S. L., Lovel, C. N., Hinton, Bunevich, A. N., and J˛edrzejewska, B.: Home ranges of T. G., Shamovich, D., and Beasley, J. C.: Where the wild things wolves in Białowieża primeval forest, Poland, compared are: influence of radiation on the distribution of four mammalian with other Eurasian populations, J. Mamm., 79, 842–852, species within the Chernobyl Exclusion Zone, Front. Ecol. Env- https://doi.org/10.2307/1383092, 1998. iron., 14, 1–6, https://doi.org/10.1002/fee.1227, 2016. Pröhl, G. (Ed.): Dosimetric models and data for assess- Wood, M. D. and Beresford, N. A.: The wildlife of Chernobyl: 30 ing radiation exposures to biota. Framework for As- years without man, The Biologist, 63, 16–19, 2016. sessment of Environmental Impact (FASSET), Deliv- erable 3, Contract No FIGE-CT-2000-00102, https: //wiki.ceh.ac.uk/download/attachments/115802176/fasset_ d3.pdf?version=1&modificationDate=1263905014000&api=v2 (last access: 17 February 2023), 2003. Earth Syst. Sci. Data, 15, 911–920, 2023 https://doi.org/10.5194/essd-15-911-2023
You can also read