Properties of stream interaction regions at Earth and Mars during the declining phase of SC 24
←
→
Page content transcription
If your browser does not render page correctly, please read the page content below
Astronomy & Astrophysics manuscript no. geyer                                                                                         ©ESO 2021
                                               February 12, 2021

                                                Properties of stream interaction regions at Earth and Mars during
                                                                   the declining phase of SC 24
                                                                       Paul Geyer1 , Manuela Temmer1 , Jingnan Guo2, 3 , and Stephan G. Heinemann1, 4

                                                     1
                                                         University of Graz, Institute of Physics, Austria
                                                     2
                                                         School of Earth and Space Sciences, University of Science and Technology of China, Hefei, PR China
                                                     3
                                                         CAS Center for Excellence in Comparative Planetology, Hefei, PR China
                                                     4
                                                         Max-Planck-Institut für Sonnensystemforschung, Justus-von-Liebig-Weg 3, 37077 Göttingen, Germany

                                                     February 12, 2021
arXiv:2102.05948v1 [astro-ph.EP] 11 Feb 2021

                                                                                                                  ABSTRACT

                                                     Aims. We inspect the evolution of stream interaction regions (SIRs) from Earth to Mars, covering the distance range 1–1.5 AU, over
                                                     the declining phase of solar cycle 24 (2014–2018). So far, studies only analyzed SIRs measured at Earth and Mars at different times.
                                                     We compare existing catalogs for both heliospheric distances and arrive at a clean dataset for the identical time range. This allows a
                                                     well-sampled statistical analysis and for the opposition phases of the planets an in-depth analysis of SIRs as they evolve with distance.
                                                     Methods. We use in-situ solar wind data from OMNI and the Mars Atmosphere and Volatile EvolutioN (MAVEN) spacecraft as
                                                     well as remote sensing data from Solar Dynamics Observatory (SDO). A superposed epoch analysis is performed for bulk speed,
                                                     proton density, temperature, magnetic field magnitude and total perpendicular pressure. Additionally, a study of events during the two
                                                     opposition phases of Earth and Mars in the years 2016 and 2018 is conducted. SIR related coronal holes with their area as well as
                                                     their latitudinal and longitudinal extent are extracted and correlated to the maximum bulk speed and duration of the corresponding
                                                     high speed solar wind streams following the stream interaction regions.
                                                     Results. We find that while the entire solar wind high speed stream shows no expansion as it evolves from Earth to Mars, the crest
                                                     of the high speed stream profile broadens by about 17%, and the magnetic field and total pressure by about 45% around the stream
                                                     interface. The difference between the maximum and minimum values in the normalized superposed profiles increases slightly or
                                                     stagnates from 1–1.5 AU for all parameters, except for the temperature. A sharp drop at zero epoch time is observed in the superposed
                                                     profiles for the magnetic field strength at both heliospheric distances. The two opposition phases reveal similar correlations of in-situ
                                                     data with coronal hole parameters for both planets. Maximum solar wind speed has a stronger dependence on the latitudinal extent of
                                                     the respective coronal hole than on its longitudinal extent. We arrive at an occurrence rate of fast forward shocks three times as high
                                                     at Mars than at Earth.
                                                     Key words. Sun: solar wind – Sun: heliosphere – Sun: solar-terrestrial relations

                                               1. Introduction                                                             into a sharp, discrete boundary at the front and rear of the wave,
                                                                                                                           thus forming shocks. Hence, the further out in the heliosphere
                                               Solar wind (SW) high speed streams (HSS) emanate from coro-                 the higher the occurrence rate of both kinds of shocks, due to
                                               nal holes (CHs) on the Sun and form with the ambient slow                   further steepening as observed when comparing SIRs at 0.3 AU
                                               solar wind so-called stream interaction regions (SIRs). As CHs              and 1 AU (see also Richter & Luttrell 1986). More sophisticated
                                               are rather long-lived structures, SIRs can be observed over sev-            models taking the 3-D evolution of SIRs into account (see e.g.,
                                               eral rotations and are then called co-rotating interaction re-              Gosling & Pizzo 1999) conclude different occurrence rates for
                                               gions (CIRs). SIR/CIR structures are detected at various loca-              shocks depending on the heliographic latitude. Forward shocks
                                               tions in the inner heliosphere by in-situ instruments, showing              tend to weaken and eventually disappear for latitudes ' 30◦
                                               typical characteristics. As the fast SW (with speeds as high as             while the occurrence rate of reverse shocks is still significant
                                               800 kms−1 ) compresses the slow portion (about 400 kms−1 ),                 for these latitudes. Additionally to this latitudinal dependency,
                                               density and interplanetary magnetic field (IMF) magnitude are               interactions between front and reverse shocks are expected to
                                               rapidly enhanced (see e.g., Schwenn 2006). The density finds                take place from 10 AU on. A very recent review by Richardson
                                               its maximum just before the total perpendicular pressure has its            (2018) gives an overview of various studies of SIRs observed at
                                               peak (slow SW changes to fast SW regime) which is commonly                  different radial distances from the Sun.
                                               referred to as the stream interface (SI) (e.g., Jian et al. 2006). The
                                               fast SW propagates freely with its characteristic high speed in                 While the properties of SIRs/CIRs are well documented at
                                               the rarefaction region following the SIR. CIRs and SIRs may de-             1 AU, SW plasma and magnetic field measurements are per-
                                               velop forward or reverse shocks (or both) as they expand through            formed at very scarcely distributed locations in the heliosphere,
                                               the heliosphere (e.g., Jian et al. 2006; Huang et al. 2019).                especially beyond 1 AU. The Mars Atmosphere and Volatile
                                                   The formation of shocks can be explained using simple 1-D               EvolutioN (MAVEN, Jakosky et al. 2015) spacecraft launched
                                               modeling (e.g Hundhausen 1973): as the crest of the pressure                in November 2013 has been measuring SW plasma and mag-
                                               wave moves faster than the front decelerated by the slow SW                 netic field at the orbit of Mars to expand our knowledge to the
                                               ahead, the wave steepens. Eventually, this steepening evolves               outermost of the inner planets. Among other instruments used
                                                                                                                                                                      Article number, page 1 of 24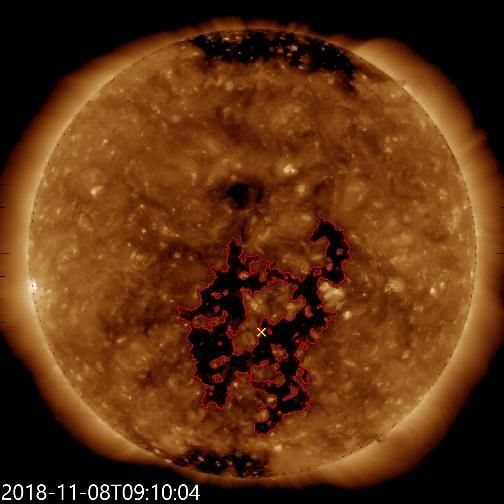
A&A proofs: manuscript no. geyer

for measuring atmospheric particles, MAVEN is carrying three
scientific instruments dedicated to SW measurements: the Solar
Wind Electron Analyzer (SWEA, Mitchell et al. 2016), the So-
lar Wind Ion Analyzer (SWIA, Halekas et al. 2015) as well as
the Magnetometer (MAG, Connerney et al. 2015). After reach-
ing Mars in September 2014, MAVEN was inserted into an el-
liptical orbit with a period of 4.5 h (Jakosky et al. 2015). Data
gaps in the observations occur when the spacecraft is in safe
mode and during scheduled observation campaigns, which re-
quire off-pointing. Besides, MAVEN often traverses through the
bow shock of Mars especially when the spacecraft crosses the
night-side of the planet. To select the data measured during the
solar wind intervals, Halekas et al. (2017) developed an algo-
rithm based on the SWIA aboard moments data and MAG mea-
surements to extract solar wind quantities over the upstream seg-
ment of each MAVEN orbit.
     Lee et al. (2017) and Huang et al. (2019) studied SW events
(i.e., SIRs/CIRs and coronal mass ejections) at Mars using
MAVEN data, also comparing individual events to those mea-
sured at Earth. However, the statistical comparison of a larger      Fig. 1: Position of the inner planets and the Solar TErrestrial Re-
sample of events measured both at Earth and Mars is still miss-      lations Observatory (STEREO, Kaiser et al. 2008) on July 10,
ing. Here, we study for a consistent set of CIRs detected at Earth   2016. The light blue shaded area marks the angular separation
and Mars over the time span November 2014 – November 2018            that is referred to as "aligned phase" and spans ±45◦ ahead and
their expansion behavior and physical characteristics over the       behind Earth’s heliographic longitude. SIRs and CIRs observed
heliospheric distance range 1 to 1.5 AU. For a subset of aligned     during this period of time are hence called "aligned events". Min-
events (which occurred during a limited time span in our sam-        imal temporal separation between the measurements of the same
ple) we investigate the spatial evolution of SIRs/CIRs and HSSs      structure is given when both planets lie on the same arm of the
when Earth and Mars were closely aligned longitudinally and          Parker spiral that is depicted as bent solid gray lines under the
compare the results to their solar sources, that is, CHs.            approximate SW speed of 400 kms−1 . Credits: Stereo Science
                                                                     Center.
2. Data and methods
For our study we use in-situ measured plasma and magnetic field      SIR/CIR time ranges, we followed a two-sided approach. On
data comprising the proton bulk speed, density, and temperature      the one hand, we related CIRs already identified for that time
as well as the magnitude of the total B. Data used cover 1-min       range at Mars by Huang et al. (2019) back to Earth and on the
resolution data from the OMNI database (King & Papitashvili          other hand, we manually cross-checked the in-situ data (OMNI)
2005) for near-earth in-situ measurements and 45-s resolution        as well as excluded coronal mass ejections identified from the
data from the MAVEN spacecraft for SW measurements at Mars           Near-Earth Interplanetary Coronal Mass Ejections list by Cane
between November 2014 and November 2018. The MAVEN SW                & Richardson (2003).
and IMF data in the undisturbed SW have been selected during             The back-relating procedure for SIRs/CIRs from Mars to
each orbit taking into account the Martian bow shock structure       Earth is based on Eq. 1 giving an estimation of the time delay, ∆t,
and the solar wind interactions with Mars (Halekas et al. 2017).     of the occurrence of an HSS between Earth and Mars according
As the Martian bow shock has significant variability in location,    to Opitz et al. (2009) with
it is possible to get interspersed periods with or without SW                         φM − φE rM − rE
coverage. After removing the periods when MAVEN is located           ∆t = tM − tE =          +        ,                             (1)
within the bow shock, the resolution of MAVEN data is lowered                          ωsun     vSW
to 270 s on average (ranging from 60–1000 s). We note that for       where φM − φE denotes the relative heliographic longitude of
long periods, when MAVEN was not at all in the upstream solar        the planets, ωsun the sidereal rotation rate of the Sun, rM − rE
wind, data are fully excluded.                                       the relative radial distances of Earth and Mars, and vSW repre-
     The catalogs given by Grandin et al. (2019) and Huang et al.    sents the median SW speed for the duration of the HSS at the
(2019) are used for identification of time ranges covering SIRs      location of Earth. An HSS is defined as a period over which the
and/or CIRs at Earth and Mars, respectively. The time intervals      SW speed is enhanced as compared to the background SW. In
of the events are extracted from these catalogs and applied to the   general, the speed profile of an HSS is asymmetric, gradually in-
respective spacecraft data to determine the corresponding SW         creasing to its maximum within about one day and then slowly
parameter profiles. Huang et al. (2019) reports during the pe-       decreasing for several days. In this study, the start of the stream
riod from November 2014 to November 2018 a total number of           is set to the occurrence of the density peak, the end of the stream
126 SIRs that could be clearly identified at Mars. Grandin et al.    is defined when the bulk SW stream drops below 350 kms−1 (ap-
(2019) analyzed from in-situ data at Earth/L1 location a total of    proximately corresponding to the minimum speed of an HSS at
588 SIR/CIR events between January 1995 and December 2017            both planets, cf. Table 1). For streams not reaching this value
(101 during November 2014–December 2017). For covering the           until the next stream occurs, the minimal value before this next
same time period including the entire data set for Mars, we en-      stream is taken as boundary. If, for a given HSS at Mars, there
larged the catalog provided by Grandin et al. (2019) and we man-     is a corresponding structure detected at Earth (i.e., sharp density
ually identified SIRs/CIRs from December 2017 until November         peak followed by a rise in and local maximum of the proton bulk
2018 by inspecting ACE data. In order to restrict the potential      speed) lying within the uncertainty boundaries of the expected
Article number, page 2 of 24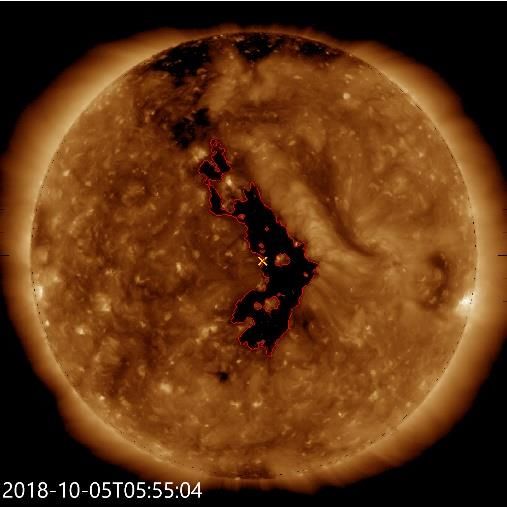
Paul Geyer et al.: Properties of stream interaction regions at Earth and Mars during the declining phase of SC 24
time delay and not falling into the transit time of a CME, this
structure is classified as an SIR at Earth. SIRs are identified as
CIRs according to their persistence for at least one solar rota-
tion (see e.g., Smith & Wolfe 1976). In total our data set, which
is consistent in time for Earth and Mars, covers 146 SIR/CIR
events at Earth and 126 SIR/CIR events at Mars. Note that the
lower number of events at Mars might be due to frequent data
gaps of the MAVEN SW measurements.
2.1. Superposed epoch analysis of SIRs
For the full data set, we applied a superposed epoch analysis
(SEA), which is a statistical means to extract characteristic prop-
erties of the individually measured profiles. We follow the orig-
inal approach given by Chree (1913) where the occurrence of a
key event embedded in a larger profile is defined as zero epoch
time. Here, the zero epoch time is set to be the occurrence of
the well-observable and sharp peak1 in proton density as it al-
ways slightly precedes the SI and drops sharply at the SI (see
e.g., Gosling & Pizzo 1999; Jian et al. 2006). We note that due
to MAVEN traversing through the magnetically shielded night
side of Mars, we assume for the determination of the zero epoch
an uncertainty of about ±2.25 h. Magnitudes derived by SEA in
this study present lower boundaries for the actual magnitudes.
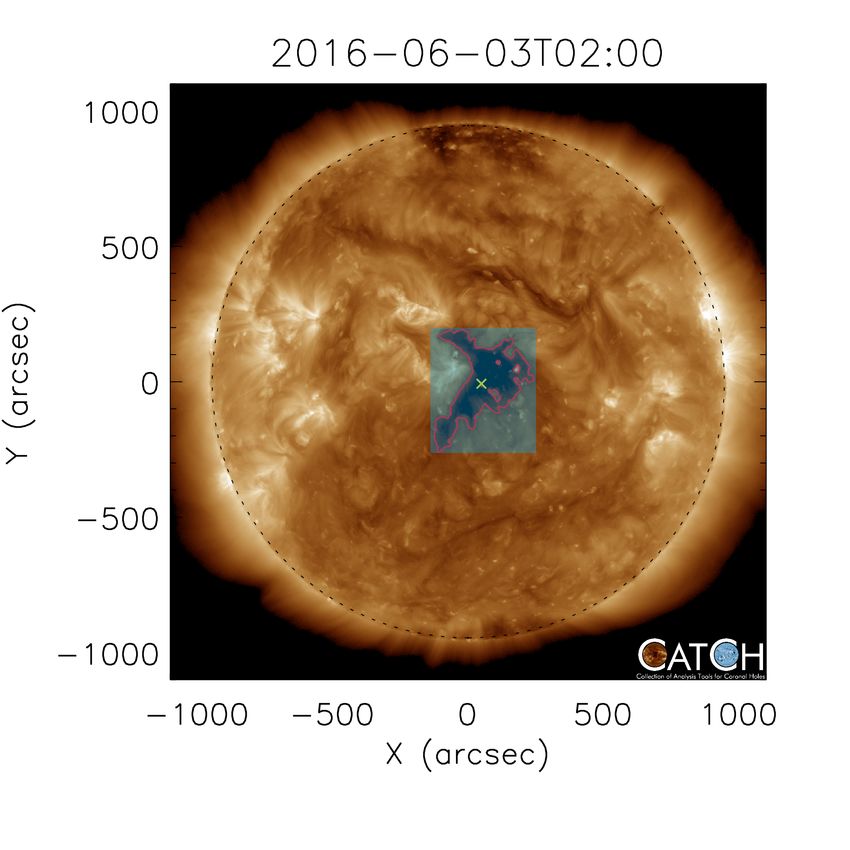
Individual SW profiles of SIR/CIR events are stacked into an ar- Fig. 2: Example of CH extraction using CATCH from June 3,
ray considering a total time range of 7 d, covering −2 d, which 2016; SDO/AIA 193 Å. The area of the CH is outlined by a
is identical to 2 d before the density peak (zero epoch time) and red line marking the boundary obtained by using a threshold
+5 d after the occurrence of the density peak. The asymmetry of 44% of the median intensity of the solar disk. The yellow
of this interval corresponds to the spatial asymmetry of the com- cross denotes the CH center-of-mass, and the horizontal/vertical
bined SIR and HSS structure, being compressed in the rising edges of the light blue shaded box give the maximum longitudi-
speed part and rarefacted in the trailing edge. From the resulting nal/latitudinal extent.
array, which shows the most dominant recurring structures from
the sample of individual profiles, we derive the median and the
25th and 75th percentile (i.e., lower and upper quartile, respec- pervised intensity-threshold extraction method that is modulated
tively). by the intensity gradient at the CH boundary, which also covers
uncertainty estimations of area and boundaries. From that we
derive for each SIR the associated CH area, its latitudinal and
2.2. Aligned events analysis longitudinal extent, as well as the geometrical center-of-mass
From a statistical study using data from STEREO and the Solar (CoM) in latitude and longitude. An example of a CH and its
Dynamics Observatory (SDO Pesnell et al. 2012), it is derived parameters extracted with CATCH is given in Figure 2.
that the source regions of SIRs, i.e, CHs, do not show a strong For deriving the correlations between SW and CH parame-
evolution over 2–3 d, especially during low solar activity phases ters we use the bootstrap method due to the low number of data
(c.f. Temmer et al. 2018). Based on that result we extract a subset points (in total 42). We apply 1,000 repetitions from which 1,000
of SIR/CIR events for times of small separation angles between statistical samples are created. From that we calculate the Spear-
Earth and Mars, hence, so-called opposition phases of Mars (i.e., man mean correlation coefficient at an 80% confidence level
when the Sun and Mars are on the opposite side as observed from (Efron 1979; Efron & Tibshirani 1993).
Earth). That enables us to study in more detail the radial evolu-
tion of SIRs and CIRs from 1 to 1.5 AU with only weak effects
of temporal evolution. Figure 1 shows the separation between 3. Results
Earth and Mars for the longitudinal range E45–W45 over which
we refer the planets to be “quasi-aligned,” corresponding to two 3.1. Superposed epoch analysis
time intervals, March until September 2016 as well as April un-
til November 2018. The subset of aligned SIRs/CIRs observed The SEA was performed for the full sample of events showing
at both planets covers for the first interval 20 events and for the SW parameters of SIRs/CIRs separately measured at Mars and
second interval 22 events (see Appendix). Earth including bulk speed, proton density and temperature as
For a more complete picture we study for the aligned events well as the components of the magnetic field and the total per-
also the source CH properties. The corresponding CHs (identi- pendicular pressure. The resulting profiles with the median as
fied via the central meridional passage 2–3 d before the peak well as the upper and lower quartile are given in Figs. 3 to 7.
in density, see e.g., Vršnak et al. 2007) are extracted using In relation to the zero epoch time, for the number density
SDO/EUV data and the Collection of Analysis Tools for Coro- we derive a gradual increase from −1 d that strongly steepens at
nal Holes (CATCH; see Heinemann et al. 2019). CATCH is a su- about −0.3 d until reaching the density peak at zero epoch time
(cf. Fig. 3). For Earth, the median of the peak number density
1
The density peak in the MAVEN data is found to be more significant is 28.0 cm−3 , while for Mars it is 12.5 cm−3 . After the density
compared to the SI peak. peak a strong decrease in density is observed that lasts at both
Article number, page 3 of 24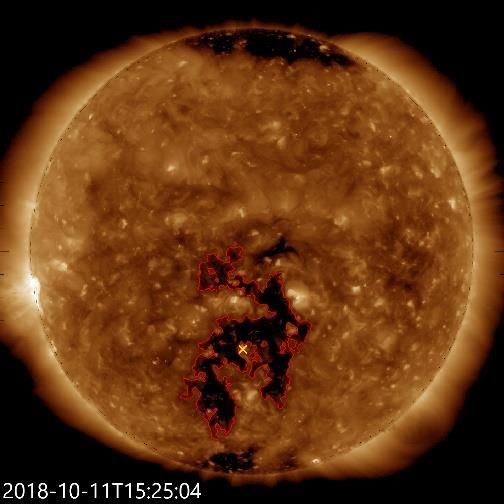
A&A proofs: manuscript no. geyer

Table 1: Median plasma and magnetic field properties of SIRs at          November 2018 (22). The occurrence of each SIR is numbered
Earth and Mars together with the time difference (in days) of the        in chronological order and, if recurrent, also the corresponding
maximum values with respect to zero epoch, which is where the            CIR is numbered (the CIR keeps the number over its lifetime, fa-
peak in density occurs.                                                  cilitating allocation in the table). In summary, the list covers 42
                                                                         SIR events out of which 8 are recurrent over one to five solar ro-
        Parameters      1 AU      1.5 AU     ∆tnE      ∆tn M             tations. In addition to the plasma and magnetic field peak values,
          vmax [ km
                  s ]    627        505      1.02      0.88              as derived for each SIR, the information of an associated shock
          vmin [ km
                  s ]    337        356      −0.38     −0.46             type (fast forward or reverse) as well as the separation angles
        nmax [cm−3 ]    28.0       12.5        0.        0.              between Earth and Mars are given.
         Bmax [nT]       14.5       7.5       0.02      0.21                  Figure 8 shows an example for the evolution of a CIR over its
        T p,max [MK]     0.50      0.23       0.35     0.54              lifetime covering five solar rotations (given in Table A.1 as SIR
        Pt,max [pPa]    116.0      32.2      0.15      0.17              no. 5, 10, 14, 17, 20 and CIR no. 2). The left panels give the EUV
                                                                         SDO/AIA image data with the corresponding CH extracted using
                                                                         CATCH. The right panels give the in-situ measured solar wind
heliospheric locations about 24 h but is slightly steeper at Earth       plasma profiles for the proton bulk speed and proton density at
than at Mars.                                                            Earth (top) and Mars (bottom). The black dashed vertical lines in
    For the bulk speed we derive for both Earth and Mars a char-         each profile mark the density peak and the end time of the event,
acteristic drop in the profile at about −0.5 d, followed by a strong     from which we derive the duration of the stream. For deriving the
increase of the HSS slightly before the zero epoch time (cf. Fig.        relation of the CH position on the Sun and the stream properties
4). This “turning point” (cf. Richter & Luttrell 1986) is located        observed at the planet, we note in each profile the heliographic
for Earth slightly closer to the zero epoch compared for Mars            longitude, ΘHG , and the heliographic latitude φHG of the planet.
distance (−0.38 d vs. −0.46 d). The maximum of the median                From this the co-latitude is obtained. Corresponding Figures for
bulk speed for Earth is 522 kms−1 reached at +1.02 d after the           CIRs no. 1 and 3–8 are presented in the Appendix.
median density peak, and for Mars we derive a maximum value                   Most similar profiles of SW speed and density measured at
of 475 kms−1 which is reached at +0.88 d from zero epoch.                Earth and Mars are obtained in the frames 2 and 3 in Fig. 8 (CH
    The median plasma temperature increases strongly after zero          at June 29, 2016 and July 26, 2016). For those times the dif-
epoch time, having values that remain relatively low prior to the        ference in heliographic longitude is ∼ 15 − 25◦ , meaning that
occurrence of the median density peak (cf. Fig. 5). At the median        the two planets lie on the same arm of the Parker spiral (assum-
density peak, the onset of a rise that is much steeper than that of      ing a solar wind speed of 400 km/s) and the temporal evolution
the median bulk speed, is clearly visible, leading to a maximum          of the stream is therefore minimal. While the density between
of 1.8 × 10⁵ K at +0.35 d for Earth and to 1.6 × 10⁵ K at +0.54 d        Earth and Mars drops by a factor of ∼ 2, the speed decreases
for Mars distance. Pre-HSS levels are not reached for neither of         only slightly over that distance. The difference in heliographic
the two planets after 5 d.                                               latitude (∼ 3 − 4◦ ) seems to have little influence on that re-
                                                                         sults. However, the second to last CH configuration observed on
    The magnitude of the IMF also shows notable properties, as
                                                                         August 21, 2018 produced quite different streams at both helio-
can be seen in Fig. 6. The profiles at Earth and Mars start to rise
                                                                         spheric distances. The bulk speed measured by MAVEN shows
at −1 d of zero epoch time, peaking shortly after the maximum
                                                                         a slow increase, peaking only ∼2.5 d after the density peak. In
median density. Almost simultaneously at the occurrence of the
                                                                         this case, the difference in heliographic latitude is maximal for
median density peak, a shock-like drop in magnetic field strength
                                                                         the observed CIR, reaching 4.2◦ . Possibly, the planets are located
can be clearly observed, for Mars even more pronounced than
                                                                         on different sides of the heliospheric current sheet (HCS) at this
for Earth. This drop is followed by a steep, nearly shock-like
                                                                         time, due to both relatively large latitudinal and longitudinal sep-
increase until the peak values are reached, 9.9 nT at Earth and
                                                                         aration. As the CH area and location on the Sun changes with
5.8 nT at Mars. The median IMF strength peaks shortly after the
                                                                         each rotation, also the speed and density profile varies, show-
median density peak, at +0.02 d for Earth and +0.21 d for Mars.
                                                                         ing in general the trend of increasing CH area and increased SW
Pre-HSS levels are reached after about +3 d in the case of Mars,
                                                                         speed as clearly shown in the left panel of Fig. 9.
and about +4 d in the case of Earth.
                                                                              For deriving more details on the characteristics of SIRs/CIRs
    The median total perpendicular pressure is given in Fig. 7.
                                                                         at Earth and Mars in relation to their solar sources, we performed
This profile combines the bulk density, magnetic field magnitude
                            B2
                                                                         correlation analyzes from which the results are shown in Figs. 9
and temperature (Pt = 2µ      0
                                + Σ(nkT perp ); cf. Jian et al. 2006).   to 11. We first investigate the well-known empirical relation be-
Accordingly, a rise can be seen from −1 d onward, being steepest         tween CH area and maximum SW speed of a SIR/CIR at 1 AU
from the occurrence of the median density peak to the maximum            (Nolte et al. 1976). In more recent studies, Hofmeister et al.
of the profile. The profile for Earth-bound data peaks at +0.15          (2018) found for a dataset covering CHs over 2010–2017 a lin-
d epoch time with 59.9 pPa. For Mars, the peak value of the              ear dependence of the maximum SW speed on the co-latitude of
median of Pt is reached at +0.17 d epoch time with 23.1 pPa.             the CHs and the CH area valid for 1 AU distance. The relation is
    Table 1 summarizes for the plasma and magnetic field prop-           given by Eq. 2,
erties of the entire sample of SIR/CIR events from the SEA study
the resulting minimum and maximum values, as well as the time
                                                                                                                                   |φco (◦ )|
difference in the peak value relative to zero epoch.                     vfit (kms−1 ) = 478 + (2.77 × 10⁻⁹ × ACH (km2 )) × (1 −              ), (2)
                                                                                                                                     61.4

3.2. Aligned events analysis                                                 where ACH denotes the CH area and φco is the co-latitude of
                                                                         the center-of-mass of the CH and the planet projected onto the
In the Appendix, Tables A.1 and A.2 list start and end times, to-        solar disk. We use that relation to calculate the SW speed fit, vfit
gether with the properties of all aligned SIR/CIR events detected        and compare that to the measured SW speed at 1 and 1.5 AU.
between March and September 2016 (20) as well as April and               The resulting scatter plot and correlation coefficients for Earth
Article number, page 4 of 24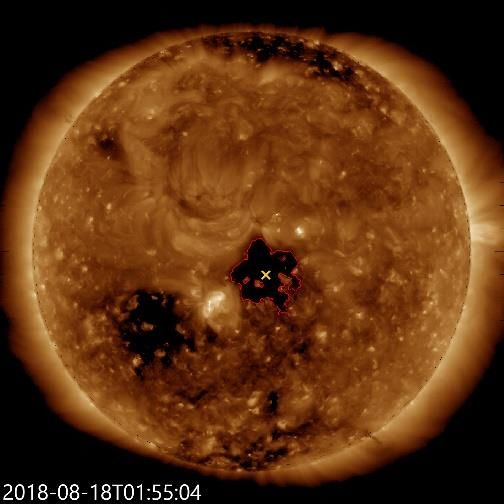
Paul Geyer et al.: Properties of stream interaction regions at Earth and Mars during the declining phase of SC 24

              50                                                                             20

                                                   N = 146                                                                          N = 126
             37.5                                                                            15
n p [cm-3]

                                                                                n p [cm-3]
              25                                                                             10

             12.5                                                                            5

               0                                                                             0
                -2    -1      0     1      2      3      4    5                               -2     -1       0     1      2      3      4    5
                           Time from zero epoch [days]                                                     Time from zero epoch [days]

Fig. 3: Superposed epoch analysis for solar wind density at Earth (left panel) and Mars (right panel). The maximum density of every
event is shifted to 0 on the x-axis. The blue curve represents the median, the upper and lower red curves represent the upper and
lower quartile, respectively. Mind the different scaling of the y-axes of the two plots.

              650                                                                            550

                                                    N = 146                                                                         N = 126
            562.5                                                                           487.5
vp [km/s]

                                                                                vp [km/s]

              475                                                                            425

            387.5                                                                           362.5

              300                                                                            300
                 -2   -1      0     1      2      3    4      5                                 -2    -1       0     1      2      3    4     5
                           Time from zero epoch [days]                                                      Time from zero epoch [days]

                                                   Fig. 4: Same as Fig. 3 for the bulk solar wind speed.

                                                                                                                                    Article number, page 5 of 24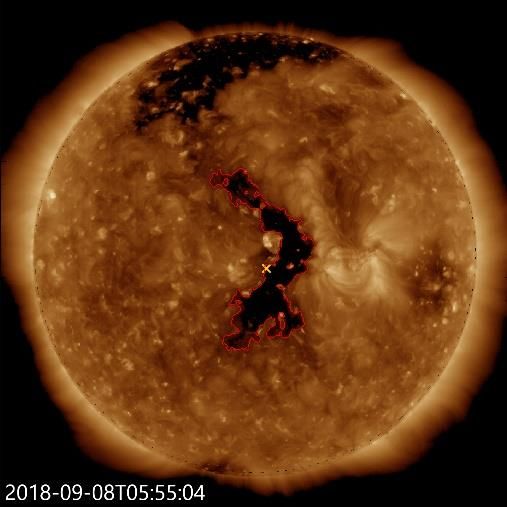
A&A proofs: manuscript no. geyer

            0.3                                                                      0.25

                                               N = 146                                                                     N = 126
          0.225                                                                    0.1875
Tp [MK]

                                                                         Tp [MK]
           0.15                                                                     0.125

          0.075                                                                    0.0625

             0                                                                         0
              -2   -1      0     1      2      3    4    5                              -2    -1      0     1      2     3     4     5
                        Time from zero epoch [days]                                                Time from zero epoch [days]

                                                Fig. 5: Same as Fig. 3 for the proton temperature.

and Mars are given in Fig. 9. The left panel shows the depen-              Table 2: Shock type and occurrence rate for the 42 SIR events
dence of measured maximum bulk speed on CH area, resulting                 detected during the aligned phases of 2016 and 2018 at 1 and
in a higher correlation coefficient for Mars (cc=0.49) than for            1.5 AU extracted from CfA and IPS. FF denotes fast forward
Earth (cc=0.36). The differences between the measured maxi-                shocks and FR denotes fast reverse shocks. The absolute number
mum speed values and vfit for Earth and Mars are shown in the              of occurrences is given in parentheses next to the percentage.
right panel of Fig. 9. These results may be applied in the future
to set up a simple forecasting tool for SW HSSs at Mars based                                 Shock type          Earth         Mars
on Eq. 2.                                                                                      FF only          6.7% (3)      20.0% (9)
    Figure 10 shows the dependence of the duration of the HSS                                  FR only         6.7% (3)       6.7% (3)
on the longitudinal extent of the CH for Earth and Mars. For the                              FF and FR         0 % (0)       8.9% (4)
CH longitudinal extension CH we derive a median of 26.5◦ , and                               FF and/or FR      13.3% (6)     35.6% (16)
except for one outlier, the widths are smaller than 50◦ . The me-
dian duration of the corresponding HSSs is obtained with ∼4.3
d at Earth and ∼4.1 d at Mars. The correlation between the two
parameters is rather weak with cc=0.35 for Earth and cc=0.36               the speed of the HSS is stronger influenced by the North-South
for Mars.                                                                  extent than by the East-West extent. The correlation is found to
    The relation between CH longitudinal extent and peak SW                be weaker for Mars (cc=0.52) than for Earth (cc=0.64).
speed is given in the left panel of Fig. 11. Although a trend to-              For each event during the opposition phases of 2016 and
ward higher maximum speed is visible for CHs of higher longi-              2018, we extract the shock type from databases (CfA: online
tudinal extent for both planets, the presence of a relatively large        database of interplanetary shocks observed by the Wind and
CH does not necessarily mean exceptionally high SW speed, for              ACE spacecraft maintained by the Harvard-Smithsonian Center
example, a CH of 15◦ longitudinal extent may produce streams               for Astrophysics https://www.cfa.harvard.edu/shocks/
of similar speed as a CH of 40◦ longitudinal extent. However,              and IPS: Interplanetary shock database maintained by Univer-
there seems to be a minimum threshold of SW peak speeds                    sity of Helsinki http://ipshocks.fi). The result is summa-
related to the CH extent, which is indicated in both panels of             rized in Table 2 giving the occurrence rates of fast forward and
Fig. 11 by a dashed line. The correlations are similar for Earth           fast reverse shocks at Earth and Mars. While the percentage of
(cc=0.42) and Mars (cc=0.39).                                              SIRs/CIRs connected with only fast reverse shocks is the same,
    In comparison, the right panel of Fig. 11 gives the relation           the rate of forward shocks increases to a value of ∼ 3 times as
of the SW peak speed to the latitudinal extent of the CH. For              much from Earth to Mars (i.e., from 6.7% to 20.0%). In the case
both planets we derive a higher correlation between the SW peak            of Earth, no events were observed that featured both a forward
speed with the latitudinal than with the longitudinal extent of            and a reverse shock, while at Mars there were even more events
the CH. Especially for CHs smaller than < 50◦ in longitude,                featuring both shocks than only a reverse shock (8.9% vs 6.7%).
Article number, page 6 of 24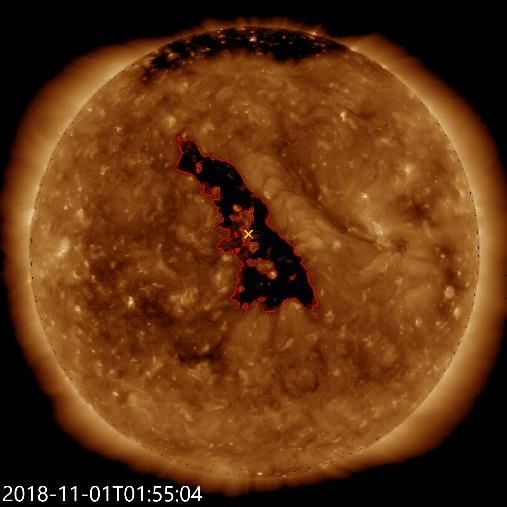
Paul Geyer et al.: Properties of stream interaction regions at Earth and Mars during the declining phase of SC 24

             14                                                                            8

                                                 N = 146                                                                       N = 126
           10.75                                                                         6.25
|B| [nT]

                                                                              |B| [nT]
             7.5                                                                          4.5

            4.25                                                                         2.75

              1                                                                            1
               -2   -1      0     1      2      3      4   5                                -2   -1      0     1      2      3      4    5
                         Time from zero epoch [days]                                                  Time from zero epoch [days]

                                       Fig. 6: Same as Fig. 3 for the interplanetary magnetic field magnitude.

4. Discussion                                                                    propagation through the heliosphere, but are also determined by
                                                                                 SIR/CIR evolution effects.
We prepared a consistent dataset of 146 SIR/CIR events at                            We further obtain that, on average, the speed profile of the
Earth and 126 at Mars that occurred during the time range from                   stream is only weakly steepening from Earth to Mars given by
November 2014 to November 2018 and investigate their evolu-                      the slightly shorter time difference from the velocity turning
tion from 1 to 1.5 AU. We performed an SEA for the full sample                   point to the maximum peak for Mars (cf. Table 1). Pressure and
of data and performed a more detailed analysis including the so-                 magnetic field magnitude show, within the uncertainties, a rather
lar source information of CHs, for a subsample of 42 aligned                     simultaneous peak at Earth and Mars inferring the dominance of
events that occurred during the special opposition phases of the                 the magnetic pressure. The temperature maximum roughly co-
planets.                                                                         moves with the maximum in the magnetic field magnitude and
                                                                                 the time difference for the magnetic field peak at Mars is about
                                                                                 +0.2 d compared to Earth. The maximum phase of the Pt (i.e.,
4.1. Superposed epoch analysis                                                   the SI) is broader for Mars than for Earth, hence, on average the
                                                                                 SIR can be considered to be broader at Mars.
The SEA profiles show overall similar features for SW parame-                        However, the overall duration of the stream is not revealing
ters at both planets. All absolute values show a clear drop from                 a broadening (4.3 d at Earth and 4.1 d at Mars as defined by
1 to 1.5 AU. This is also obtained when taking only the aligned                  the time that is needed until the SW speed drops below the aver-
events into account - the magnitudes slightly drop, while the time               age minimum speed; cf. Sect. 4.2). Huang et al. (2019) reported a
differences between density peak and parameter peak are similar.                 SIR duration2 that is similar for Earth (∼36.7 h) and Mars (∼37.0
Venzmer, M. S. & Bothmer, V. (2018, referred to as VB in the                     h). In accordance to that, we determine from Fig. 4, on average
following) derived exponents for the decrease/increase of SW                     an SIR duration of ∼33.5 h in the case of Earth and ∼35.8 h in the
parameters from 0.3–1AU (based on data from Helios 1+2 and                       case of Mars. On the other hand, we reveal a broadening of the
OMNI). For the further distance up to 1.5AU, we find similar                     HSS crest when comparing the profiles between 1 and 1.5 AU.
exponents for magnetic field strength Bavg ∝ r−1.63 (VB: r−1.55 )                Figure 12 shows the smoothed and normalized median profiles
                                                                                 for speed, IMF magnitude and total perpendicular pressure. As
and number density navg ∝ r−1.99 (VB: r−2.01 ). However, for                     we are interested in the crest part, we cut the profiles at a 95%
the temperature, we obtain a larger decrease T avg ∝ r−1.92 (VB:                 level from the maximum and compare their duration at Earth
r−0.79 ). Regarding the bulk speed, our results imply a decrease                 and Mars. For speed we derive an increase in duration by ∼17%,
vavg ∝ r−0.53 (VB: r−0.05 ). This means that magnetic field strength             and for the magnetic field and total perpendicular pressure an
and number density follow the modeled decrease in magnitude
up to at least 1.52 AU, implying a merely geometrical evolution,                   2
                                                                                   Defined as the time range that lies between the pressure waves ahead
also for SIRs/CIRs. In the case of temperature and bulk speed,                   and behind the SIR or, if present, between fast forward and reverse
the magnitudes at 1.52 AU are not simply a consequence of SW                     shocks.

                                                                                                                               Article number, page 7 of 24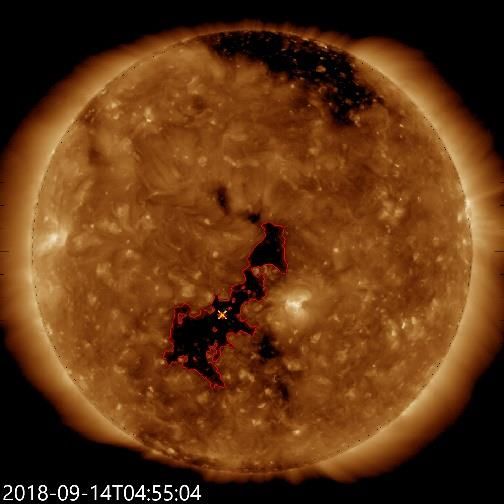
A&A proofs: manuscript no. geyer

            120                                                                         40

                                                 N = 146                                                                    N = 126
            90                                                                          30
P t [pPa]

                                                                            P t [pPa]
            60                                                                          20

            30                                                                          10

             0                                                                          0
              -2   -1      0     1      2      3      4    5                             -2   -1      0     1      2      3      4    5
                        Time from zero epoch [days]                                                Time from zero epoch [days]

                                             Fig. 7: Same as Fig. 3 for the total perpendicular pressure.

expansion of ∼47% and ∼44%, respectively. From that we con-                 stream interface and the HSS. Other explanations for the mag-
clude that the wave crest broadens related to the expansion of the          netic drop could be magnetic holes or blob-like plasma struc-
stream close to the SI (e.g., Gosling & Pizzo 1999), which also             tures, that might be formed close to the stream interface region
explains the increased occurrence rate of fast-forward and also             (Tsubouchi 2009; Neugebauer et al. 2004; Jian et al. 2019).
reverse shocks observed at Mars (see also Huang et al. 2019).
     Richter & Luttrell (1986) investigated Helios data (0.3–               4.2. Aligned events analysis
1.0 AU distance range) and found that the amplitudes of the SW
parameters normalized to the maximum value all increase with                For the aligned events we studied 42 SIR/CIRs from Sun to
increasing radial distance from the Sun. In analogy, we calculate           Mars. Garton et al. (2018) analyzed the dependence of SW speed
the normalized amplitudes as derived from the presented SEA                 measured near-Earth on the longitudinal extent of CHs during
analysis for 1.0 and 1.5 AU and compare to the results given                the years 2016 and 2017. In comparison with their results, the
by Richter & Luttrell (1986) for 0.35 and 0.95 AU (Fig. 13).                maximum stream duration of the HSS analyzed in this study
We obtain that the normalized amplitudes for density and mag-               is 8 d (versus 14 in Garton et al. 2018), while the longitudi-
netic field magnitude might continue the increasing trend as re-            nal extent of the CHs does not exceed 80 ◦ (versus 120 ◦ ) for
ported by Richter & Luttrell (1986), though with a much flatter             both planets. The linear correlation coefficient is weaker com-
slope. However, for the pressure component a clear stagnation               pared to Garton et al. (2018) and nearly the same for both plan-
is revealed and the temperature even strongly decreases beyond              ets. However, we note that the correlation is strongly influenced
1 AU. We conclude, beyond 1 AU the amplitudes do not follow                 by the most extended CH in longitude (but that is rather nar-
a clear linear increase anymore but rather stagnate and plasma              row in latitude), which produced a relatively medium peak SW
cools rapidly due to the further expansion of the stream.                   speed at both planets. That CH also lies in the width regime
    A striking feature of a strong drop in the IMF magnitude is             (> 67 ◦ in longitude) for which a saturation of peak SW speed
observed at the time of zero epoch, identical to the time of the            is found by Garton et al. (2018) and supported by simulations as
maximum median bulk density (Figs. 3 and 6). A similar feature              given in Hofmeister et al. (2020). Interestingly, the correlation
has been reported for heliospheric plasma sheets located close              of the maximum bulk SW speed with the CH latitudinal extent is
to the HCS, hence, before the stream interface, and is explained            greater than that with the CH longitudinal extent for both plan-
by pressure balance, where a drop in magnetic field magnitude               ets. This implies a stronger dependence of the peak SW speed
is connected with a rise in temperature and/or density (Crooker             on the N-S extension for CHs with small to medium longitudi-
et al. 2004). From the SEA for the total pressure we find a slight          nal extensions.
dip at the time of the magnetic field drop (Fig. 7) together with                We find for the aligned events, having therefore weak effects
a clear decrease in the entropy (S = ln(T p3/2 /N p ); not shown),          of temporal evolution, a higher shock occurrence rate for Mars
meaning that pressure balancing is most likely not the only cause           than for Earth (see Table 2) that is comparable to the results
of the magnetic decrease observed in the region between the                 given in Huang et al. (2019). The percentage of streams associ-
Article number, page 8 of 24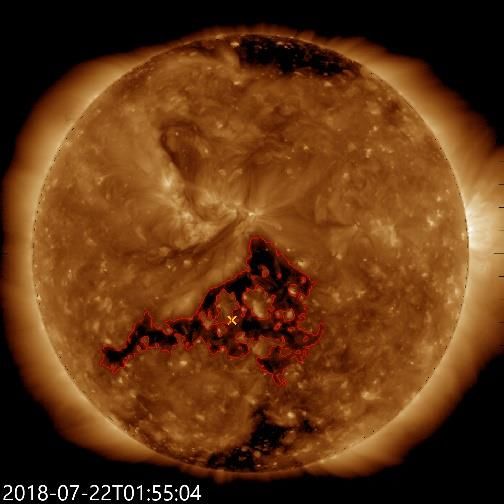
Paul Geyer et al.: Properties of stream interaction regions at Earth and Mars during the declining phase of SC 24

                                                                                                          Article number, page 9 of 24
Fig. 8: SDO/AIA 193 Å images and in-situ SW plasma measurements for CIR no. 2 recurring five times. Left:      EUV images showing
CHs extracted via CATCH and identified as the origin of HSS measured in-situ. Right: In-situ SW bulk speed (red) and density
(blue) measured by ACE/WIND (panels in an odd sequence) and MAVEN (panels in an even sequence). The density peak and the
end time of the event are marked by black dashed vertical lines. In the top right corner of the profiles the heliographic longitude,
ΘHG , and the heliographic latitude φHG , of the planet is given.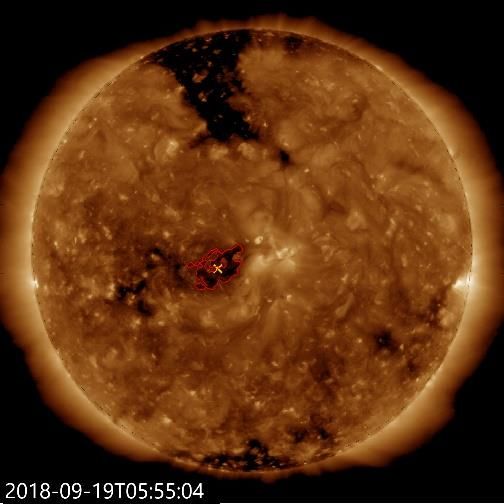
A&A proofs: manuscript no. geyer

                                                                                                                                     300
                   850
                             cc = 0.35±0.16
                             cc = 0.49±0.12
                   800                                                                                                               200

                   750

                   700
                                                                                                                                     100

                                                                                                                v fit-v max [km/s]
                   650
    v max [km/s]

                                                                                                                                       0
                   600

                   550
                                                                                                                                     -100
                   500

                   450                                                                                                               -200

                   400

                                                                                                                                     -300
                   350
                         0          2         4   6   8        10        12    14   16   18      20                                         0   2   4   6   8     10     12      14   16   18   20
                                                          A CH [10 10 km 2 ]                                                                                A CH [10 10 km 2 ]

Fig. 9: Left: Maximum in-situ measured SW speed versus CH area. Right: Absolute difference between the fitted value and the
measurements, with a black dashed line indicating zero difference. The blue circles denote data points related to Earth, the red
triangles denote data points related to Mars. The respective colors are also used for the correlation coefficient values as given in the
legend. The error of the CH area scales with the uncertainty of extraction, for instance, CHs that lie close to the solar limb have a
larger error. The error of the measured maximum bulk velocity was set to ±5 kms−1.

ated with fast reverse shocks suggests no strong evolution at the                                              rotations in June and July 2015. The source CH was found to
trailing edge of SIRs at the same time. The aligned events also                                                be of medium longitudinal extension, similar to the CHs identi-
reveal a similar overall HSS duration between Earth and Mars                                                   fied in the present study. As the CH declined in area, so did the
(4.3 d at Earth and 4.1 d at Mars). We also derive at both planets                                             bulk speed of the associated HSS, from ∼ 750 kms−1 to ∼ 522
similar correlations between stream and CH properties. We note,                                                kms−1 . The density also decreased, from ∼ 38.5 cm−3 to ∼ 5.7
that the rather small longitudinal extent of the CHs in the studied                                            cm−3 . This highly dynamical nature of CIRs can also be seen in
time range leads in general to a shorter stream duration, hence,                                               Fig. 8, as from the first to the second appearance, bulk speed and
these results might be limited to HSSs emanating from small-                                                   density are greatly reduced at both planets, independent of grow-
to medium-size CHs. From the SEA we find that the expansion                                                    ing latitudinal separation. In general, SIR/CIR in-situ signatures
of the stream is most dominant around the SI as it evolves from                                                look similar at both planets during opposition phases and also
Earth to Mars (see Table 1). From that we conclude that the ma-                                                show similar evolution over one solar rotation. Also, the latitu-
jor changes in the stream evolution over radial distance occur at                                              dinal separation is small (< 5◦ during the opposition phases) and
the front of SIRs close to the SI, leading to an increased rate of                                             the change of SIR 3D morphology might be at a larger latitudinal
forward shocks. Merging processes of small SIRs into a strong                                                  scale.
SIR occurring over distance ranges of several AU may also lead
to an increased shock rate of SIRs (Jian et al. 2011).
                                                                                                               5. Conclusions
    Lee et al. (2017) give a general overview of Space Weather
events at Mars during the period November 2014 – May 2016                                                      In conclusion, we find an expansion of the SIR/CIR most promi-
covering CMEs and CIRs in relation to flares and SEP events.                                                   nently visible in the total perpendicular pressure and the mag-
They describe the recurrent CHs and CIR properties at Earth and                                                netic field strength. The amplitudes of SW parameters show a
Mars during the first conjunction period from May to July 2015.                                                flatter increase from 1 to 1.52 AU than from 0.35 to 0.95 AU
Here we show as complementary analysis a complete list of re-                                                  or even a decrease in the case of proton temperature. The de-
current CHs during two opposition periods and their relation be-                                               crease of peak number density and magnetic field strength from
tween Earth and Mars in-situ signatures (see Figs. A.1 to A.7).                                                1 to 1.52 AU scales according to a geometrical expansion, while
Lee et al. (2017) analyzed a CIR observed by MAVEN over two                                                    proton temperature and speed show additional evolution effects.
Article number, page 10 of 24
Paul Geyer et al.: Properties of stream interaction regions at Earth and Mars during the declining phase of SC 24
8
cc = 0.35±0.17
cc = 0.36±0.18
7
6
5
t HSS [d]
4
3
2
1
0
10 20 30 40 50 60 70 80
∆ΘCH [°]
Fig. 10: SW HSS duration versus CH longitudinal extent. Same color scheme is used as for Figure 9. The error of stream duration
depends on the uncertainty of defining the stream end, for example, if the lower boundary of 350 kms−1 is not reached before the
occurrence of another SIR/CIR. The error of CH longitudinal extent again grows the closer it is located at the solar limb.
The dependence of stream duration and bulk speed on the prop- Acknowledgements. We thank Lan Jian for very valuable discussions. J.G.
erties of the source CH is similar for both planets, and reveal thanks Jasper Halekas for the support of MAVEN data. We also thank the re-
viewer for the careful revision of this manuscript to improve its content. J.G. is
moderate correlation coefficients between stream and CH prop- supported by the Strategic Priority Program of the Chinese Academy of Sci-
erties. The fast forward shock occurrence rate increases by a ences (Grant No. XDB41000000), the National Natural Science Foundation
factor of 3 from Earth to Mars, while no instance of SIRs fea- of China (Grant No. 42074222) and the CNSA pre-research Project on Civil
turing both fast forward and fast reverse shocks have been ob- Aerospace Technologies (Grant No. D020104). The MAVEN data are archived in
served at Earth during the aligned events period. The findings of the NASA Planetary Data System’s Planetary Plasma Interactions Node hosted
at https://pds-ppi.igpp.ucla.edu/.
this study can be used in the future to not only further expand
the knowledge about the evolution of SIRs and CIRs beyond 1
AU, but also serve for modeling of SIR/CIR propagation from
the Sun to the outer heliosphere. Studying the evolution of SW References
streams throughout the heliosphere is essential for better under- Cane, H. V. & Richardson, I. G. 2003, Journal of Geophysical Research: Space
standing the large-scale heliospheric magnetic structure and the Physics, 108
space weather conditions at various planets where future space Chree, C. 1913, Philosophical Transactions of the Royal Society of London Se-
explorations will take place. ries A, 212, 75
Connerney, J. E. P., Espley, J., Lawton, P., et al. 2015, Space Sci. Rev., 195, 257
Article number, page 11 of 24A&A proofs: manuscript no. geyer
800 800
cc = 0.42±0.16 cc = 0.64±0.12
cc = 0.39±0.17 cc = 0.52±0.17
750 750
700 700
650 650
∆v max [km/s]
v max [km/s]
600 600
550 550
500 500
450 450
400 400
350 350
10 20 30 40 50 60 70 80 10 20 30 40 50 60 70
∆ΘCH [°] ∆φCH [°]
Fig. 11: Left: SW maximum speed versus CH longitudinal extent. Right: SW maximum speed versus CH latitudinal extent. Same
color scheme is used as for Figure 9. Again, greater error applies to CHs lying close to the limb or polar regions.
Crooker, N. U., Huang, C.-L., Lamassa, S. M., et al. 2004,
Journal of Geophysical Research: Space Physics, 109
[https://agupubs.onlinelibrary.wiley.com/doi/pdf/10.1029/2003JA010170]
Efron, B. 1979, Ann. Statist., 7, 1
Efron, B. & Tibshirani, R. J. 1993, An Introduction to the Bootstrap (New York:
Chapman & Hall)
Garton, T. M., Murray, S. A., & Gallagher, P. T. 2018, The Astrophysical Journal,
869, L12
Gosling, J. T. & Pizzo, V. J. 1999, Space Sci. Rev., 89, 21
Grandin, M., Aikio, A. T., & Kozlovsky, A. 2019, Journal of Geophysical Re-
search: Space Physics, 124, 3871
Halekas, J. S., Ruhunusiri, S., Harada, Y., et al. 2017, Journal of Geophysical
Research (Space Physics), 122, 547
Halekas, J. S., Taylor, E. R., Dalton, G., et al. 2015, Space Sci. Rev., 195, 125
Heinemann, S. G., Temmer, M., Heinemann, N., et al. 2019, Sol. Phys., 294, 144
Hofmeister, S. J., Veronig, A., Temmer, M., et al. 2018, Journal of Geophysical
Research: Space Physics, 123, 1738
Hofmeister, S. J., Veronig, A. M., Poedts, S., Samara, E., & Magdalenic, J. 2020,
ApJ, 897, L17
Huang, H., Guo, J., Wang, Z., et al. 2019, The Astrophysical Journal, 879, 118
Hundhausen, A. J. 1973, J. Geophys. Res., 78, 1528
Jakosky, B. M., Lin, R. P., Grebowsky, J. M., et al. 2015, Space Sci. Rev., 195, 3
Jian, L., Russell, C. T., Luhmann, J. G., & Skoug, R. M. 2006, Sol. Phys., 239,
337
Jian, L. K., Luhmann, J. G., Russell, C. T., & Galvin, A. B. 2019, Sol. Phys.,
294, 31
Jian, L. K., Russell, C. T., Luhmann, J. G., et al. 2011, Sol. Phys., 273, 179
Kaiser, M. L., Kucera, T. A., Davila, J. M., et al. 2008, Space Sci. Rev., 136, 5
King, J. H. & Papitashvili, N. E. 2005, Journal of Geophysical Research: Space
Physics, 110
Lee, C. O., Hara, T., Halekas, J. S., et al. 2017, Journal of Geophysical Research:
Space Physics, 122, 2768
Mitchell, D. L., Mazelle, C., Sauvaud, J. A., et al. 2016, Space Sci. Rev., 200,
495
Neugebauer, M., Liewer, P. C., Goldstein, B. E., Zhou, X., & Steinberg, J. T.
2004, Journal of Geophysical Research (Space Physics), 109, A10102
Nolte, J. T., Krieger, A. S., Timothy, A. F., et al. 1976, Sol. Phys., 46, 303
Opitz, A., Karrer, R., Wurz, P., et al. 2009, Sol. Phys., 256, 365
Pesnell, W. D., Thompson, B. J., & Chamberlin, P. C. 2012, Sol. Phys., 275, 3
Richardson, I. G. 2018, Living Reviews in Solar Physics, 15, 1
Richter, A. K. & Luttrell, A. H. 1986, J. Geophys. Res., 91, 5873
Schwenn, R. 2006, Space Sci. Rev., 124, 51
Smith, E. J. & Wolfe, J. H. 1976, Geophys. Res. Lett., 3, 137
Temmer, M., Hinterreiter, J., & Reiss, M. A. 2018, Journal of Space Weather and
Space Climate, 8, A18
Tsubouchi, K. 2009, Journal of Geophysical Research (Space Physics), 114,
A02101
Venzmer, M. S. & Bothmer, V. 2018, A&A, 611, A36
Vršnak, B., Temmer, M., & Veronig, A. M. 2007, Sol. Phys., 240, 331
Article number, page 12 of 24Paul Geyer et al.: Properties of stream interaction regions at Earth and Mars during the declining phase of SC 24
Fig. 12: Top left panel: Smoothed and normalized median of the speed profile at Earth (blue line) and Mars (red line). The black
dashed line gives the threshold of 95% of the maximum. The colored dashed lines show the respective duration of the curve above
this threshold. The broadening of the wave crest for the median speed from Earth to Mars is then about 17%. The epoch time ranges
from -1 d to +3 d. Top right panel: Median of IMF magnitude around the stream interface. The marked features show an expansion
of ∼47%. The epoch time interval in this case is -0.25 d to +0.5 d. Bottom panel: Median profiles of the total perpendicular pressure,
given again from -0.25 d to +0.5 d. The expansion rate for this parameter is about 43%.
Article number, page 13 of 24A&A proofs: manuscript no. geyer Fig. 13: Amplitude (difference between minimum and maximum values) of the normalized SW parameters (given in the legend) taken across before zero epoch (front-side; left panel) and across after zero epoch (back-side; right panel) of the SEA profiles. Values for the distances 0.35 and 0.95 AU are taken from the study by Richter & Luttrell (1986). Article number, page 14 of 24
Paul Geyer et al.: Properties of stream interaction regions at Earth and Mars during the declining phase of SC 24

Appendix A: Aligned events
Here we give more detailed information about the aligned events
during the opposition phase of Mars and Earth in 2016 and 2018,
respectively. We list in the following additional Tables for exact
dates and occurrence frequency of the SIRs and CIRs. The Fig-
ures show corresponding EUV image data and in-situ measured
solar wind speed and density profiles for each CIR.

                                                                                                                  Article number, page 15 of 24
A&A proofs: manuscript no. geyer
Table A.1: Catalog of aligned SIRs and CIRs for 2016. Note. The units are as follows: Nmax [cm− 3], vmax [km s−1 ], Bmax [nT],
T max [104 K], Pt,max [pPa], ΦHG and ΘHG [◦ ], and denote the maximum of plasma density, bulk speed, IMF magnitude, proton
temperature and total perpendicular pressure, respectively. The two last columns denote heliographic latitude and longitude of the
planets. The occurrence of a fast forward (FF) or reverse (FR) shock is indicated with a Y. Shocks were allocated using CfA and
IPS databases (Earth) and Huang et al. (2019) (Mars).
Planet SIR # CIR # HSS Start HSS End FF? FR? Nmax Vmax Bmax T max Pt,max ΦHG ΘHG
Earth 1 03-06 18:20 03-09 22:17 33.4 632.7 20.9 85.2 359.5 -7.2 138.3
Mars 03-11 11:53 03-15 13:55 Y 17.2 588.6 9.7 32.0 58.7 -4.9 176.3
2 03-11 11:21 03-14 14:07 Y 71.9 591.8 26.2 49.7 328.1 -7.2 72.5
03-16 12:50 03-19 03:33 3.6 513.2 7.4 23.5 25.6 -4.8 107.7
3 03-14 18:34 03-22 01:49 Y 70.2 629.8 24.3 108.3 347.8 -7.2 32.9
03-20 01:23 03-26 15:05 10.7 577.6 7.9 29.4 37.7 -4.7 66.6
4 1 05-27 00:31 06-02 21:00 27.2 577.6 13.1 32.9 73.5 -1.2 135.6
05-29 02:40 06-05 01:09 12.4 471.8 5.5 20.0 26.1 -1.9 133.7
5 2 06-05 09:09 06-09 20:42 71.4 674.6 21.2 118.2 310.1 -0.1 16.5
06-07 01:39 06-11 17:06 Y Y 39.2 550.1 14.6 33.9 96.3 -1.5 10.8
6 3 06-10 13:26 06-14 10:23 27.0 574.8 14.0 83.0 125.8 0.5 310.3
06-12 12:11 06-15 08:39 Y 15.6 483.5 7.8 22.4 30.9 -1.2 302.5
7 06-14 19:49 06-22 02:42 Y 25.7 728.2 16.5 50.6 133.0 0.9 257.4
06-15 08:54 06-22 09:14 4.2 607.3 5.8 38.1 23.3 -1.0 248.0
8 1 06-22 20:11 06-23 06:21 43.0 440.2 14.1 37.2 96.6 1.9 151.5
06-23 08:47 06-24 05:25 Y 8.0 424.0 5.3 12.7 14.9 -0.6 138.8
9 06-23 08:13 06-29 21:14 15.3 564.2 10.6 42.4 55.5 2.0 138.2
06-24 10:25 06-30 10:51 5.6 504.6 7.9 24.7 28.0 -0.5 125.2
10 2 07-02 22:40 07-05 15:10 51.7 507.9 15.8 38.9 149.3 3.0 19.1
07-03 11:37 07-06 22:12 Y 19.3 498.8 8.3 23.9 44.9 0.0 2.5
11 3 07-07 01:17 07-11 22:01 49.0 659.7 14.2 42.3 120.1 3.5 312.9
07-07 19:21 07-11 07:27 Y 18.3 653.0 13.8 34.9 106.9 0.2 294.4
12 07-12 05:59 07-14 02:48 6.3 659.4 8.8 37.3 40.5 4.1 246.8
07-13 03:56 07-13 23:25 4.2 580.1 5.8 24.6 16.4 0.5 226.3
13 4 07-14 13:55 07-18 23:12 5.0 713.3 7.4 31.4 31.8 4.3 220.3
07-14 11:10 07-18 23:21 3.6 605.3 6.4 24.1 25.5 0.6 199.1
14 2 07-28 04:22 08-01 04:25 50.6 646.4 17.7 88.0 236.3 5.5 35.1
07-28 18:21 08-01 02:00 15.7 528.6 9.0 22.9 36.9 1.4 8.6
15 4 08-09 03:47 08-15 08:52 7.2 673.1 8.6 41.4 40.2 6.3 236.4
08-08 15:32 08-14 08:08 3.0 641.4 4.9 29.8 16.0 2.1 205.4
16 1 08-17 05:02 08-18 09:51 39.1 444.5 12.3 16.4 69.7 6.7 130.6
08-15 22:08 08-20 00:34 7.8 394.1 5.8 12.5 14.8 2.5 96.7
17 2 08-23 18:45 08-29 03:49 18.0 606.7 16.2 51.9 146.5 7.0 51.3
08-22 14:27 08-27 00:14 9.0 531.2 6.8 26.9 28.4 2.8 15.2
18 3 08-29 11:00 08-31 20:14 29.1 483.8 10.0 18.7 49.2 7.1 332.0
08-27 05:05 08-30 12:14 Y 12.8 543.6 7.1 22.6 27.7 3.1 293.8
19 09-01 05:23 09-10 17:10 12.4 742.0 11.1 49.3 84.6 7.2 305.6
08-30 14:51 09-07 10:20 5.9 576.7 6.4 27.1 25.4 3.2 266.6
20 2 09-19 21:11 09-24 10:26 38.4 773.9 21.9 110.4 252.9 7.1 41.5
09-17 23:21 09-22 23:46 Y Y 31.7 698.3 13.3 34.8 97.6 4.1 355.3
Article number, page 16 of 24Paul Geyer et al.: Properties of stream interaction regions at Earth and Mars during the declining phase of SC 24
Table A.2: Catalog of aligned SIRs and CIRs for 2018. Note. The units are as follows: Nmax [cm− 3], vmax [km s−1 ], Bmax [nT],
T max [104 K], Pt,max [pPa], ΦHG and ΘHG [◦ ]. The occurrence of a fast forward (FF) or reverse (FR) shock is indicated with a Y. NU
denotes no upstream period for MAVEN.
Planet SIR # CIR # HSS Start HSS End FF? FR? Nmax Vmax Bmax T max Pt,max ΦHG ΘHG
Earth 21 03-29 15:10 04-03 15:22 28.1 469.0 8.7 21.7 46.5 -6.7 280.0
Mars 04-05 11:05 04-09 13:08 15.2 500.4 7.1 20.2 29.7 -2.7 327.7
22 04-08 18:20 04-15 00:18 15.7 617.3 10.0 33.5 52.6 -6.1 148.1
04-15 21:49 04-21 07:30 19.1 544.2 7.6 21.6 35.6 -2.2 191.0
23 04-20 04:23 04-24 10:48 Y 68.2 669.6 23.4 64.3 272.6 -5.2 349.7
04-25 04:43 NU 4.7 544.0 5.2 31.7 30.6 -1.6 27.1
24 5 06-26 08:05 06-26 19:58 25.3 636.3 14.7 45.4 103.0 2.3 183.4
06-27 20:04 06-28 22:54 7.2 601.6 5.1 26.6 15.1 2.0 194.4
25 6 07-20 21:32 07-23 21:38 13.6 570.2 10.2 46.0 76.2 4.8 225.8
07-21 10:20 07-25 02:58 Y 6.1 507.4 6.7 27.0 29.5 3.3 228.4
26 5 07-24 05:50 07-28 09:21 46.4 612.8 13.7 43.1 97.7 5.1 172.9
07-25 18:46 07-30 06:35 25.9 587.1 10.6 31.7 54.9 3.5 174.1
27 7 07-31 19:27 08-02 01:27 24.3 422.3 9.8 26.1 43.0 5.7 80.3
08-01 16:42 08-03 04:00 7.8 332.9 5.6 10.5 13.9 3.8 79.2
28 08-02 02:14 08-02 22:09 32.2 404.7 8.9 15.7 39.8 5.9 40.6
08-03 12:35 08-04 11:35 Y 11.3 362.7 6.7 13.2 20.5 3.9 38.5
29 08-05 10:31 08-06 21:52 15.1 400.0 6.8 12.3 22.5 6.0 14.2
08-06 19:11 08-08 01:50 Y 11.8 424.6 6.3 16.2 20.2 4.0 11.3
30 08-07 16:51 08-08 21:26 24.8 433.8 10.0 16.3 41.9 6.2 347.7
08-09 05:12 08-11 03:06 14.2 363.2 5.5 7.0 16.0 4.1 344.2
31 8 08-11 07:37 08-14 01:32 35.6 425.3 11.4 15.4 60.9 6.5 281.6
08-12 04:49 08-14 23:51 Y 10.4 414.1 7.4 18.1 28.4 4.3 276.4
32 6 08-14 23:59 08-19 15:13 26.3 575.0 11.8 26.0 71.9 6.6 255.2
08-16 07:08 08-20 03:44 17.8 540.2 7.8 23.9 37.3 4.4 249.3
33 5 08-19 17:51 08-24 01:05 Y 25.0 672.8 12.9 58.9 97.4 6.8 189.1
08-20 14:57 08-25 19:11 13.6 646.2 11.0 39.1 60.8 4.6 181.5
34 7 08-26 13:18 09-02 04:12 34.0 633.9 19.2 46.4 162.5 7.1 83.4
08-27 23:40 08-31 22:42 Y 24.9 544.2 10.8 23.2 59.6 4.8 73.1
35 8 09-07 04:06 09-09 17:45 28.7 500.6 11.7 40.8 82.4 7.2 298.1
09-07 16:25 09-10 12:14 8.8 531.5 6.9 23.0 24.4 5.2 284.1
36 6 09-10 16:05 09-16 20:55 26.2 703.5 15.4 51.1 119.2 7.2 258.4
09-11 17:53 09-17 02:59 Y 15.9 547.8 9.4 24.9 47.7 5.2 243.4
37 5 09-17 02:26 09-20 15:30 37.0 585.6 11.9 43.5 85.5 7.2 166.0
09-17 11:02 09-21 16:18 17.1 526.1 8.6 27.8 34.8 5.4 148.6
38 8 10-03 15:29 10-06 23:57 16.0 515.9 9.3 30.5 50.8 6.6 314.8
10-03 18:26 10-06 18:59 16.1 532.2 11.2 28.5 51.2 5.6 291.8
39 6 10-07 10:45 10-12 22:04 66.9 640.1 18.2 44.2 161.4 6.4 262.1
10-07 02:01 10-11 17:19 12.6 601.2 8.1 28.9 46.3 5.6 237.6
40 5 10-13 17:49 10-18 16:58 32.1 641.1 12.5 39.6 71.6 6.0 182.9
10-11 21:46 10-18 03:28 7.0 577.6 5.9 24.6 22.3 5.6 156.3
41 6 11-04 21:01 11-09 15:41 24.4 638.5 13.6 54.9 152.5 4.1 252.8
11-03 14:58 11-08 00:13 Y Y 15.8 541.7 8.7 22.7 40.2 5.5 218.1
42 5 11-09 16:41 11-16 11:21 20.3 656.0 14.1 42.7 91.2 3.7 200.0
11-08 14:11 11-14 10:03 8.0 567.4 6.6 32.3 30.3 5.4 163.9
Table A.3: SIRs/CIRs ocurring at times of CME disturbances at Earth. Note. The units are as follows: Nmax [cm− 3], vmax [km s−1 ],
Bmax [nT], T max [104 K], Pt,max [pPa], ΦHG and ΘHG [◦ ]. The occurrence of a fast forward (FF) or reverse (FR) shock is indicated
with a Y.
Planet CIR # HSS Start HSS End FF? FR? Nmax Vmax Bmax T max Pt,max ΦHG ΘHG
Earth 1 2016 07-20 12:36 07-24 07:26 70.5 603.4 34.3 85.1 555.8 4.8 140.9
Mars 2016 07-21 06:57 07-25 13:27 13.7 686.8 11.8 36.2 73.5 1.0 117.4
3 2016 08-02 11:34 08-08 08:31 Y 55.7 713.1 25.2 67.1 333.7 5.9 328.9
2016 08-02 04:05 08-08 09:02 Y Y 2.5 707.0 6.4 6.5 18.5 1.7 300.6
7 2018 09-21 23:11 09-24 12:02 32.5 587.5 10.7 43.4 56.6 7.1 113.2
2018 09-22 10:47 09-25 05:00 12.5 566.5 10.2 32.4 46.9 5.4 94.4
Article number, page 17 of 24A&A proofs: manuscript no. geyer Fig. A.1: The first corotating interaction region (CIR 1) that occurred during the opposition phase in 2016. Left panels: SDO/AIA 193 Å images of the source CH extracted using CATCH. The via thresholding determined CH boundary is given in red, a yellow x marks the geometrical center-of-mass. Right panels: In-situ SW data showing proton number density (blue) and bulk speed (black) for one synodic rotation. The odd panels show SW data obtained from the OMNI database, the even panels depict MAVEN data. The heliographic coordinates of the planets at the time of SI passage are given in red in the upper right corner. Article number, page 18 of 24
Paul Geyer et al.: Properties of stream interaction regions at Earth and Mars during the declining phase of SC 24

                        Fig. A.2: Same as Fig. A.1 for CIR 3, occurring in 2016.

                                                                                                   Article number, page 19 of 24
A&A proofs: manuscript no. geyer
Fig. A.3: Same as Fig. A.1 for CIR 4, occurring in 2016.
Article number, page 20 of 24Paul Geyer et al.: Properties of stream interaction regions at Earth and Mars during the declining phase of SC 24
Article number, page 21 of 24
Fig. A.4: Same as Fig. A.1 for CIR 5, occurring in 2018.A&A proofs: manuscript no. geyer
Article number, page 22 of 24
Fig. A.5: Same as Fig. A.1 for CIR 6, occurring in 2018.Paul Geyer et al.: Properties of stream interaction regions at Earth and Mars during the declining phase of SC 24
Fig. A.6: Same as Fig. A.1 for CIR 7, occurring in 2018. No CH extraction was possible for the first two recurrences of the stream.
Article number, page 23 of 24You can also read