MANAGEMENT'S DISCUSSION AND ANALYSIS - For the quarter and year ended December 31, 2020 - Athabasca Minerals Inc
←
→
Page content transcription
If your browser does not render page correctly, please read the page content below
MANAGEMENT’S DISCUSSION AND ANALYSIS
    For the quarter and year ended December 31, 2020
April 20, 2021 The following management’s discussion and analysis (“MD&A”) of Athabasca Minerals Inc.’s (“Athabasca”, “AMI”, “our” or the “Corporation”) financial condition and results of operations should be read in conjunction with the Audited Consolidated Financial Statements for the year ended December 31, 2020. The accompanying Audited Consolidated Financial Statements have been prepared in accordance with International Financial Reporting Standards (“IFRS”). All dollar amounts referred to in this MD&A are Canadian dollars. Athabasca Minerals Inc. (“Athabasca”, “AMI”, “our” or the “Corporation”) is a reporting issuer in each of the provinces of Canada. The Corporation’s shares trade on the TSX Venture Exchange under the symbol AMI-V. Athabasca’s board of directors, on the recommendation of the audit committee, approved the content of this MD&A on April 20, 2021. Additional information about Athabasca, including our annual information form, management information circular and quarterly reports, is available at www.athabascaminerals.com and on the System for Electronic Document Analysis and Retrieval (SEDAR) at www.sedar.com. FORWARD LOOKING INFORMATION This document contains “forward looking statements” and “forward-looking information” (collectively referred to herein as “forward-looking statements”) within the meaning of Canadian securities legislation. Such forward-looking statements the Corporation and its subsidiaries, relating to, without limitation, expectations, intentions, plans and beliefs, including information as to the future events, results of operations and Athabasca’s future performance (both operational and financial) and business prospects. Forward-looking statements can be identified by the use of words such as “anticipates”, “believes”, “continue”, “estimates”, “expects”, “intends”, “may”, “pending”, “potential”, “plans”, “seeks”, “should”, “projects”, “will” or variations of such words and phrases. Forward-looking statements are based on the expectations and opinions of the Corporation’s management (“Management”) on the date the statements are made. The assumptions used in the preparation of such statements, although considered reasonable at the time of preparation, may prove to be imprecise and, as such, readers are cautioned not to place undue reliance on these forward-looking statements, which speak only as of the date the statements were made. Such forward- looking statements reflect Athabasca’s beliefs, estimates and opinions regarding its future growth, results of operations, future performance (both operational and financial), and business prospects and opportunities at the time such statements are made, and Athabasca undertakes no obligation to update forward-looking statements if these beliefs, estimates and opinions or circumstances should change, except as required by applicable securities laws. Forward-looking statements are necessarily based upon a number of estimates and assumptions made by Athabasca that are inherently subject to significant business, economic, competitive, political and social uncertainties and contingencies. Forward-looking statements are not guarantees of future performance. Although the Corporation believes that the material factors, expectations and assumptions expressed in such forward-looking statements are reasonable based on information available to it on the date such statements are made, undue reliance should not be placed on the forward-looking statements because the Corporation can give no assurances that such statements and information will prove to be correct and such statements are not guarantees of future performance. Since forward-looking statements address future events and conditions, by their very nature they involve inherent risks and uncertainties. Actual performance and results could differ materially from those currently anticipated due to a number of factors and risks. These include, but are not limited to: known and unknown risks, including those set forth in the Corporation’s annual information form dated March 12, 2021 (a copy of which can be found under Athabasca’s profile on SEDAR at www.sedar.com); exploration and development costs and delays; weather, health, safety, market and environmental risks; integration of acquisitions, competition, and uncertainties resulting from potential delays or changes in plans with respect to acquisitions, development projects or capital expenditures and changes in legislation including, but not limited to incentive programs and environmental regulations; stock market volatility and the inability to access sufficient capital from external and internal sources; general economic, market or business conditions; the COVID-19 health pandemic; global economic events; changes to Athabasca’s financial position and cash flow; the availability of qualified personnel, management or other key inputs; potential industry developments; and other unforeseen conditions which could impact the use of services supplied by the Corporation. Accordingly, readers should not place undue importance or reliance on the forward-looking statements. Readers For the quarter and year ended December 31, 2020 Management’s Discussion and Analysis 1
are cautioned that the foregoing list of factors is not exhaustive and should refer to “Risk Factors” set out in the Corporation’s annual
information form dated March 12, 2021.
Statements, including forward-looking statements, contained in this MD&A are made as of the date they are given and the
Corporation disclaims any intention or obligation to publicly update or revise any forward-looking statements, whether as a result
of new information, future events or otherwise, unless so required by applicable securities laws. The forward-looking statements
contained in this MD&A are expressly qualified by this cautionary statement.
Additional information on these and other factors that could affect the Corporation’s operations and financial results are included
in reports on file with applicable securities regulatory authorities and may be accessed under Athabasca’s profile on SEDAR at
www.sedar.com.

OUR BUSINESS
Incorporated in 2006, Athabasca Minerals is an integrated group of companies capable of full life-cycle development and
supply of aggregates and industrial minerals. The Corporation is comprised of the following business units:
     •    AMI Aggregates division produces and sells aggregates out of its corporate pits and manages the Coffey Lake
          Public Pit on behalf of the Government of Alberta.
     •    AMI Silica division (www.amisilica.com) is positioning to become a leading supplier of premium domestic silica
          sand with three regional deposits located in Alberta and NE-BC (White Rabbit, Firebag and Montney), and holds
          a 5-year purchase agreement with Shell Canada for the supply of proppant.
          o    Privco1 & Privco2 are private Alberta corporations owned by AMI that hold the Montney and White Rabbit
               domestic sand deposits, respectively which are strategically located with respect to the Montney and
               Duvernay sedimentary basins. Privco2 supports the Duvernay Sand Project, which is finalizing FEED (Front-
               End Engineering & Development) with the participation of an international industrial partner who brings
               access to rail, power, industrial water and heat recovery with green benefits, utilities and infrastructure.
     •    AMI RockChain division (www.amirockchain.com) is a midstream, technology-enabled business that deploys its
          proprietary RockChain™ digital platform, associated industry econometrics, supply-chain algorithms, quality-
          assurance & safety programs to bring customers integrated supply-delivery solutions of industrial minerals to
          industry, infrastructure and construction sectors.
          o    TerraShift Engineering (www.terrashift.ca) was acquired by AMI RockChain in June 2020. TerraShift offers
               engineering and project services, proprietary technology applications such as TerraMaps, with expertise in
               resource exploration & development, mine planning, environmental reclamation and remediation,
               regulatory approvals, and compliance reporting, serving a growing customer base across Western Canada
               and Ontario.

For the quarter and year ended December 31, 2020 Management’s Discussion and Analysis                                                  2
BUSINESS HIGHLIGHTS
Athabasca Minerals reports the following key highlights in 2020 and subsequent highlights for 2021:
• On March 15, 2021, the Corporation announced a three-year agreement with a two-year renewal option for AMI
RockChain to supply aggregates and related services to the Rural Municipalities of Alberta ("RMA"), their provincial
membership of 69 rural municipalities, and their inter-provincial affiliates.
• On March 15, 2021, the Corporation announced TerraShift securing contracts valued over $600,000 to: (a) provide
municipal services associated with environmental waste management for the Ministikwan Lake Cree Nation for the
next 12 months, and (b) secure peat resources and regulatory approvals for a confidential industry client.
• On February 5, 2021, the Corporation announced the acquisition of 100% interest in Privco1 and Privco2, the private
Alberta corporations that hold the Montney In-Basin Project and the Duvernay Sand Project, respectively. These
transactions were combined and concluded for $1.00 of cash consideration and 8,000,000 common shares at a value
of $0.25 per common share for a total purchase price of $2,000,001 released over three milestone installments.
o 4,000,000 shares were paid on February 5, 2021. The remaining shares are held in escrow with 2,000,000
common shares to be paid at the Corporation's discretion by June 30, 2021, and 2,000,000 common shares to
be paid at the Corporation's discretion by June 30th, 2022. If the Corporation elects not to release the common
shares from escrow for either of the two milestone payments, then the founding partners will be returned an
equivalent pro-rata interest in Privco2 in exchange.
• The Corporation is also using common shares to make one final Annual Minimum Royalty ("AMR") payment for
Privco1, consisting of 800,004 common shares at a value of $0.25 per share, for a total value of $200,001, with three
corresponding milestone installments.
o 400,002 shares were paid on February 5, 2021. The remaining shares are held in escrow with 200,001 common
shares to be paid at the Corporation's discretion by June 30, 2021, and 200,001 common shares to be paid at
the Corporation's discretion by June 30th, 2022.
• AMI Aggregates was impacted by lower activity due to COVID-19 as well as the economic downturn. Production out
of Coffey Lake resumed in January 2021, and production out of AMI’s other corporate pits is anticipated to resume
in 2021.
• In fiscal 2020, AMI RockChain has increased sales volumes relative to 2019; however, anticipated volumes were
impacted by the economic downturn from COVID-19.
• On October 26, 2020, the Corporation announced the closing of a $1.48 million non-brokered private placement with
the issuance of 9,866,688 common shares. The deal was priced at $0.15/share representing a 30% premium to the
prior day closing price. Proceeds from the private placement were allocated to advance Front-End Engineering &
Development ("FEED") activities for the Duvernay Project and for general corporate purposes. The private
placement was supported by JMAC Resources Ltd. as an anchor investor. With the private placement, insider
ownership of the Corporation’s Common Shares increased from 8.1% to 22.5% as of the date of closing.
• On October 26, 2020, the Corporation also announced the addition of Jon McCreary, CEO of JMAC Resources Inc., to
the Board of Directors, effective November 1, 2020.
• On September 17, 2020, the Corporation announced the advancement of a strategic Joint Venture (“JV”) initiative
with an international industrial partner to pursue the Duvernay Project. The JV initiative aims to co-develop and
operate one of the greenest sand facilities in North America. The JV initiative offers many unique synergies including
industrial land for the construction of the facility, as well as access to industrial utilities and transportation
infrastructure.
• On June 30, 2020, the Corporation and its wholly-owned subsidiary AMI RockChain announced the acquisition of
TerraShift. TerraShift was a privately-owned company based in Edmonton, Alberta with proprietary technology that
focuses on resource data, search intelligence, and geospatial software that will further strengthen the functionality
and capabilities of AMI’s RockChainTM digital platform. TerraShift also brings technical services with highly efficient
methods and streamlined approaches. The acquisition was predominantly a share-based transaction with two
trailing payments and performance-based installments on the anniversary of closing.
For the quarter and year ended December 31, 2020 Management’s Discussion and Analysis 3• On March 18, 2020, Alberta Environment & Parks granted the Corporation a disposition for the True North Staging
Hub: 30 hectares (74 acres) of land strategically located 7 km from Coffey Lake. The True North Staging Hub
provides supplementary services for aggregate crushing, processing, and inventory management.
• On February 3, 2020, AMI Silica Inc and Shell Canada Energy (“Shell”) ratified a Master Purchase Contract to purchase
Premium Domestic sand from AMI’s Duvernay Basin Silica Project beginning on the later of mid-2021 or 30 days after
the Duvernay facility has been commissioned. Under terms of the contract, there is a minimum sales volume at
predetermined prices, with an optional maximum annual volume that books a significant portion of the Duvernay
Project production capacity. The contract has a five-year term from the effective delivery date and gives Shell the
right to extend for an additional two 12-month terms thereafter, with the option to procure sand from AMI’s future
Montney In-Basin Project as well.
• The Corporation’s subsidiary Aggregates Marketing Inc. rebranded to AMI RockChain Inc. in February 2020. This
rebranding included a new website with improved functionality.
• Effective January 13, 2020, the Government of Alberta issued the Corporation a disposition for the Coffey Lake Pit
and a Surface Mineral Lease that allows for the extraction of sand and gravel. This authorization enables the
Corporation, as pit management contractor on behalf of the Government of Alberta, to commence activities to open
aggregate operations at Coffey Lake to the public.
Fiscal Management & Reporting
• The Corporation has undertaken several financial initiatives in response to the COVID-19 pandemic:
o A $40,000 loan for AMI Silica and a $40,000 loan for AMI RockChain were secured through the Canadian
Emergency Business Account (“CEBA”) program to support these businesses through the COVID-19
pandemic. TerraShift also had a $40,000 CEBA loan at the time of acquisition. These loans are interest-free,
require no principal payments until December 2022, and $10,000 is forgivable if repaid by December 2022. In
October 2020, the Government of Canada announced its intention to increase CEBA loans from $40,000 to
$60,000, of which $20,000 will be forgivable if repaid by December 2022. AMI Silica received the additional
$20,000 in December 2020; AMI RockChain and TerraShift received similar loan increases in Q1-2021.
o AMI applied for the Canadian Emergency Wage Subsidy (“CEWS”) program to assist its businesses through
the COVID-19 pandemic. The CEWS program is currently in place until June 2021, and AMI has received and
accrued subsidies totaling $450,560 as of December 31, 2020 from the CEWS program.
o Principal repayment of the $1,500,000 bank loan purposed for Coffey Lake Public Pit and the True North
Staging Hub construction was deferred three months to a total of six months of interest-only payment terms
which ended in July 2020.
• In an effort to preserve the Corporation’s cash position and retain employees during the COVID-19 pandemic and
economic downturn, AMI implemented a 90/10 compensation program whereby 90% of base salary is paid in cash
and 10% of base salary is paid in treasury-issued shares. For this compensation program, the Corporation has put
into place an Employee Share Purchase Plan (“ESP Plan”) and participation in the ESP Plan is voluntary. The
compensation program was put into effect June 1, 2020 for employees and management. For director’s fees, the
compensation program was retroactive to April 1, 2020. The ESP Plan was approved by the shareholders on
September 22, 2020 and by the TSX Venture Exchange on October 16, 2020 and was in place until December 31,
2020.
• The Corporation remains financially prudent during the COVID-19 pandemic. Effective January 1, 2021, AMI
implemented 10% reductions of Management salaries and Board fees and continues to participate in the Canada
Emergency Wage Subsidy program.
• AMI’s cash position as of December 31, 2020 was $2.0 million free cash and $1.1 million restricted cash.
For the quarter and year ended December 31, 2020 Management’s Discussion and Analysis 4SELECTED FINANCIAL INFORMATION
Three months ended December 31, Years ended December 31,
2020 2019 % Change 2020 2019 % Change
FINANCIAL HIGHLIGHTS:
Aggregate Sales Revenue $ 397,476 $ 631,241 -37% $ 1,271,759 $ 1,689,792 -25%
Management Services Revenue 116,671 477,399 -76% 673,421 911,034 -26%
Revenue 514,147 1,108,640 -54% 1,945,180 2,600,826 -25%
Gross loss (87,812) (211,259) -58% (399,328) (1,064,552) -62%
Gross loss percent -17% -19% -21% -41%
Operating loss (907,011) (1,187,674) -24% (3,828,470) (2,845,697) 35%
-
Other non-operating income 76,012 71,895 6% 393,277 39,827 887%
Total loss and comprehensive loss $ (934,533) $ (1,101,728) -15% $ (3,530,525) $ (2,720,668) 30%
Loss per share, basic ($ per share) (0.017) (0.024) -30% (0.071) (0.063) 10%
Loss per share, fully diluted ($ per share) (0.017) (0.024) -30% (0.071) (0.063) 10%
CASH FLOW HIGHLIGHTS:
Net cash used in operating activities (567,907) (921,909) -38% (2,038,601) (2,789,714) -27%
Purchase of property and equipment (15,740) (6,548) 140% (15,740) (51,372) -69%
Spending on resource properties (1,280) (18,424) -93% (2,807) (75,609) -96%
Weighted Average # of Shares Outstanding 56,113,640 44,987,364 49,657,351 43,354,271
OPERATIONAL HIGHLIGHTS:
Tonnes sold
Susan Lake operations - - 0% - 341,459 -100%
Coffey Lake operations - - 0% 80,155 - 100%
As at
December 31, 2020 December 31, 2019 % Change
FINANCIAL POSITION:
Working capital¹ $ 917,834 $ 2,776,312 -67%
Total assets 18,543,202 18,272,460 1%
Total liabilities 5,358,368 4,000,646 34%
Shareholder's Equity 13,184,834 14,271,814 -8%
¹Non-IFRS Measure - identified and defined under "Liquidity & Capital Resources"
FINANCIAL AND OPERATIONAL REVIEW
REVENUE
The Corporation’s revenue during Q4-2020 was $0.5 million compared to $1.1 million in Q4-2019. The decrease in revenue
of $0.6 million was due to the impact of COVID-19, particularly on the Aggregates division which had $nil revenue in the
fourth quarter due to the regional slowdown around the Coffey Lake public pit.
The Corporation’s revenue for 2020 decreased by 25% to $1.9 million from $2.6 million in the prior year. The $0.7 million
decrease in revenue was due to:
• Aggregate sales revenue declined by $0.4 million in 2020 as a result of a $1.0 million decline in AMI corporate pit
revenue, and an increase of $0.6 million of networked third-party sales revenue through AMI RockChain.
• Management services revenue decreased by $0.3 million due to a $0.5 million decrease in sales from Coffey Lake
in 2020 compared to 2019 sales from Susan Lake, partially offset by a $0.2 million increase from the addition of
TerraShift’s revenue stream.
For the quarter and year ended December 31, 2020 Management’s Discussion and Analysis 5GROSS LOSS
The Corporation took the necessary actions to adjust cost structures where possible, and as a result, both gross losses
and adjusted gross losses were significantly reduced in 2020. It is anticipated that these adjustments to costs will benefit
the Corporation on an ongoing basis.
The Corporation incurred a gross loss of $0.1 million in Q4-2020 compared to $0.2 million in Q4-2019. The improvement in
gross loss of $0.1 million was due to a cost of sales decrease of $0.7 million compared to a decrease in revenue of $0.6
million.
Gross loss improved by $0.7 million to a gross loss of $0.4 million for the year ended December 31, 2020 from a gross loss
of $1.1 million for the year ended December 31, 2019. The improvement in gross loss of $0.7 million was due to a cost of
sales decrease of $1.4 million compared to a decrease in revenue of $0.7 million. Included in the gross loss of $0.4 million
was an inventory write-down of $0.3 million, based on an updated estimate of net realizable value.
Prior to the impact of the inventory write-down, adjusted gross loss for the year ended December 31, 2020 was a loss of
$0.1 million, compared to a loss of $1.1 million for the same period in 2019. Adjusted gross loss is a non-IFRS measure, and
does not have a directly comparable IFRS measure. Management uses adjusted gross loss to measure business
performance independent of gains and losses arising from material changes in estimated values of non-financial assets
and liabilities.
Three months ended December 31, Year ended December 31,
2020 2019 % Change 2020 2019 % Change
Revenue 514,147 1,108,640 -54% 1,945,180 2,600,826 -25%
Gross loss (87,812) (211,259) 58% (399,328) (1,064,552) 62%
Gross loss percent -17% -19% -21% -41%
Inventory write-down included in gross loss - - 0% (265,876) - 0%
Adjusted gross loss¹ (87,812) (211,259) 58% (133,452) (1,064,552) 87%
Adjusted gross loss percent¹ -17% -19% -7% -41%
General and Administrative Expenses
Three months ended December 31, Years ended December 31,
2020 2019 % Change 2020 2019 % Change
Wages and benefits $ 402,651 $ 484,488 -17% $ 1,599,411 $ 1,767,060 -9%
Consulting 63,085 93,734 -33% 345,118 263,786 31%
Legal and professional fees 64,718 128,634 -50% 242,690 477,146 -49%
Insurance 40,613 32,122 26% 152,595 114,171 34%
Directors fees and expenses 38,800 44,220 -12% 149,501 164,905 -9%
General office 24,860 24,628 1% 90,693 92,693 -2%
Investor relations 27,817 17,758 57% 79,956 110,493 -28%
Rent and office expenses 16,918 20,836 -19% 64,509 168,155 -62%
Travel 5,023 16,861 -70% 33,688 64,198 -48%
Severance - - 0% 6,780 8,608 -21%
Exploration - 1,274 -100% - 25,436 -100%
Total general and administrative expenses $ 684,485 $ 864,555 -21% $ 2,764,941 $ 3,256,651 -15%
General and administrative expenses for the three months and year ended December 31, 2020 were $0.7 million and $2.8
million, respectively, compared to $0.9 million and $3.3 million for the same periods in 2019.
For the quarter and year ended December 31, 2020 Management’s Discussion and Analysis 6During Q1-2020, initial payroll reductions were implemented. In Q2-2020, a second round of payroll reductions and
optimizations at all levels of the Corporation were implemented, up to and including the Board of Directors. In order to
preserve the Corporation’s cash position and employees, AMI implemented a 90/10 compensation plan, whereby 90% of
the base salary was paid in cash and 10% of base salary was paid in treasury issued-shares. The treasury-issued shares were
issued under the ESP Plan, which was approved at the Corporation’s Annual and Special Meeting in September 2020. In
addition, the Corporation applied for and received monthly CEWS subsidies beginning in Q1-2020 and continues to apply
for these subsidies. The subsidies serve to reduce the salaries and benefits expensed incurred during fiscal 2020. To date,
the Corporation has recorded $0.4 million in CEWS subsidies. The reductions and subsidies have contributed to a decrease
in wages and benefits.
The decrease in year-end 2020 general and administrative expenses as compared to 2019 was partially due to the decrease
in legal and professional fees, which was mainly due to legal costs that were incurred in 2019 for advice concerning
aggregates and reclamation obligations with Syncrude Canada Ltd. This issue was resolved in 2019, and as such, the costs
were not repeated in 2020. Wages and benefits also decreased significantly as discussed above, which was partially offset
by increases in consulting costs relative to the previous year. Rent and office expenses declined as a result of a change in
accounting for the rent of premises to a right of use asset in 2020 when a rental agreement was signed, whereas for 2019
the month-to-month rent was expensed as a general and administrative cost. Insurance increased due to additional
Directors & Officers liability coverage in 2020 as compared to 2019.
OPERATING LOSS
The Corporation’s operating loss for Q4-2020, which is calculated as gross profit less general and administrative costs,
share of loss from associates, share-based compensation, and other operating income (expenses) was $0.9 million
compared to Q4-2019’s operating loss 0f $1.2 million.
For the years ended December 31, 2020 and 2019, the operating loss was $3.8 million and $2.8 million, respectively. Three
material events impacted the year over year operating loss as follows:
• Write-down of inventory of $0.3 million in Q3-2020;
• Write-down of Steepbank exploration costs of $0.1 million in Q3-2020, and;
• Change in estimate in environmental rehabilitation obligations (“ERO”) at Susan Lake as a result of the approval
of the Susan Lake Public Pit Closure Plan in 2019, which resulted in a gain of $2.2 million in Q3-2019.
Excluding the above three events, the adjusted operating loss for the years ended December 31, 2020 and 2019 were $3.5
million and $4.9 million, respectively. Adjusted operating loss is a non-IFRS measure, and does not have a directly
comparable IFRS measure. Management uses adjusted operating loss to measure business performance independent of
gains and losses arising from material changes in estimated values of non-financial assets and liabilities.
Three months ended December 31, Year ended December 31,
2020 2019 % Change 2020 2019 % Change
Operating loss (907,011) (1,187,674) 24% (3,828,470) (2,845,697) -35%
Inventory write-down included in operating loss - - (265,876) -
Write-down of Steepbank exploration costs included in operating loss - - (105,826) -
Change in estimate related to EROs included in operating loss 30,860 1,881 30,860 2,079,249
Adjusted operating loss¹ $ (937,871) $ (1,189,555) 21% $ (3,487,628) $ (4,924,946) 29%
¹Non-IFRS Measure
The decrease in adjusted operating loss of $1.4 million was due to the following:
• As noted above, adjusted gross loss decreased by $1.0 million from $1.1 million in 2019 to $0.1 million in 2020, and;
• As noted above, general and administrative expenses decreased by $0.5 million from $3.3 million in 2019 to
$2.8 million in 2020.
For the quarter and year ended December 31, 2020 Management’s Discussion and Analysis 7TOTAL LOSS AND COMPREHENSIVE LOSS
In Q4-2020, the Corporation incurred a total loss and comprehensive loss of $0.9 million, $0.017 per share basic and diluted,
as compared to a total comprehensive loss of $1.1 million, $0.024 per share basic and diluted, for Q4-2019.
For the years ended December 31, 2020 and 2019, the Corporation incurred a total loss and comprehensive loss of $3.5
million, $0.071 per share basic and diluted, and $2.7 million, $0.063 per share basic and diluted, respectively. The year-to-
date increase in the total loss and comprehensive loss of $0.8 million was due to the following:
• As noted above, unadjusted operating loss increased by $1.0 million from $2.8 million in 2019 to $3.8 million in
2020, offset by:
o A $0.2 million loss resulting from the change in fair value of share purchase options in 2019, which was
not repeated in 2020, and;
o A $0.1 million gain on the acquisition of TerraShift in 2020 compared to $nil in 2019.
SUMMARY OF QUARTERLY RESULTS
The following selected information is derived from the Consolidated Financial Statements of the Corporation. The
information has been prepared by Management in accordance with IFRS. Revenue refers to aggregate management fees,
gross aggregate sales from Corporate pits, fees for engineering services, and fees from integrated supply/delivery
solutions of industrial minerals.
Q4 2020 Q3 2020 Q2 2020 Q1 2020
Aggregate Sales Revenue $ 397,476 $ 326,194 $ 59,071 $ 489,018
Management Services Revenue 116,671 99,537 186,641 270,572
Total Revenue 514,147 425,731 245,712 759,590
Gross Profit (Loss) (87,812) (321,952) (30,993) 41,429
Total Loss and Comprehensive Loss (934,533) (1,106,354) (673,958) (815,680)
Loss per share, basic (0.017) (0.023) (0.014) (0.018)
Loss per share, diluted (0.017) (0.023) (0.014) (0.018)
Total Assets 18,543,202 18,097,757 19,070,097 20,482,851
Total Resource Properties 6,250,770 6,685,322 6,750,782 6,711,351
Current portion of lease obligations and debt 1,446,564 690,205 638,255 507,918
Total Debt (non-current) 218,521 1,126,158 1,296,828 1,340,881
Q4 2019 Q3 2019 Q2 2019 Q1 2019
Aggregate Sales Revenue $ 631,241 $ 78,146 $ 980,405 $ -
Management Services Revenue 477,399 - - 433,635
Total Revenue 1,108,640 78,146 980,405 433,635
Gross Loss (213,830) (444,778) (295,417) (110,527)
Total Income (Loss) and Comprehensive Income (Loss) (1,101,728) 748,666 (1,310,647) (1,056,959)
Income (loss) per share, basic (0.024) 0.017 (0.030) (0.026)
Income (loss) per share, diluted (0.024) 0.016 (0.030) (0.026)
Total Assets 18,272,460 18,315,146 19,753,963 19,546,329
Total Resource Properties 6,288,436 6,272,040 6,261,111 6,260,921
Current portion of lease obligations 93,685 94,493 30,979 49,245
Total Debt (non-current) 86,205 103,923 - -
For the quarter and year ended December 31, 2020 Management’s Discussion and Analysis 8Seasonality of Operations
The Corporation derives revenues from managing the supply of, and from the production of, various types of aggregates
in Northern Alberta. Aggregate sales and the associated delivery can be affected by, among other things:
• weather conditions;
• seasonal variances in oil and natural gas exploration and development activities;
• timing of projects;
• market demand; and
• timing of capital investments in the region.
Most construction, infrastructure and industry projects, to which the Corporation supplies aggregate, typically ramp up
later in the summer and the fall seasons when ground conditions firm up. These seasonal trends typically lead to quarterly
fluctuations in operating results and, consequently, the financial results from one quarter are not necessarily comparable
or indicative of financial results in other quarters of the year. These seasonal trends can be observed in fluctuations in
Total Revenue and Total Income (Loss) and Comprehensive Income (Loss) in the Summary of Quarterly Results above.
Mergers, Acquisitions & Strategic Joint Ventures
AMI continues to be active with screening, assessing, and reviewing acquisition and joint venture investment
opportunities that are synergistic to the Corporation’s portfolio, accretive, and able to expand revenues in the use and
application of industrial minerals.
COVID-19
COVID-19 is having an adverse impact on global economic conditions, which has had an adverse effect on the Corporation’s
business and financial position. No inventory has been sold from the Corporate-owned pits in fiscal 2020. The
Corporation’s revenue for 2020 has been primarily due to networked sales with third parties via AMI RockChain,
management services revenue at the Coffey Lake public pit in 2020, and from the new TerraShift operations; however,
both aggregate sales revenue and management services revenue have been significantly lower than expected in 2020.
The Corporation is continuing to monitor the actual and potential financial impact of COVID-19, such as changes to
discount rates and indicators of impairment of inventory and exploration assets, and is updating any accounting estimates
that are impacted by the effects of COVID-19.
AMI is navigating the situation on an ongoing basis with respect to making appropriate and prudent business decisions,
including right-sizing the organization accordingly. The Corporation’s divisions and associated operations have been
deemed an essential business supporting construction, infrastructure, and the energy sector. AMI will continue to monitor
and adhere to the required protocols to ensure compliance and to mitigate the risks to staff, and to key stakeholders in
its supply chain.
For the quarter and year ended December 31, 2020 Management’s Discussion and Analysis 9OPERATIONS
With respect to the Corporation’s operations, a conversion ratio of 2.471 acres to 1 hectare has been used throughout.
PIT MANAGEMENT CONTRACTS
Coffey Lake Public Pit
• Effective March 21, 2020, Coffey Lake Public Pit commenced commercial operations. Operations were
subsequently halted in Q2-2020 due to the impact of COVID-19, and operations resumed in January 2021;
• Effective January 13, 2020, the Government of Alberta issued the Corporation a disposition for the Coffey Lake
Public Pit and a Surface Mineral Lease that allows for the extraction of sand and gravel. This authorization
enabled the Corporation, as pit management contractor on behalf of the Government of Alberta, to commence
activities to open aggregate operations at Coffey Lake to the public.
Susan Lake Public Pit
• As of the end of Q2-2019, the Susan Lake pit was closed to the public;
• On August 15, 2019, the Corporation received formal approval of its Susan Lake Closure Plan from the
Government of Alberta. Of the four zones comprising Susan Lake, three zones have been successfully turned
over to the overlapping oilsands operators. Zone-4 (non-overlapping land) is subject to reclamation monitoring
for approximately the next two years and is concluded upon receipt of a reclamation certificate.
Corporate-Owned Pits
• The Corporation holds Surface Material Leases (“SMLs”) for several aggregate pits in northern Alberta. An SML
grants the leaseholder the right to extract sand and gravel from Crown land;
• The Corporation is exploring options to reactivate inactive pits, including assigning to a third-party under a royalty
agreement, or divest depending on market conditions.
For the quarter and year ended December 31, 2020 Management’s Discussion and Analysis 10For the quarter and year ended December 31, 2020 Management’s Discussion and Analysis 11
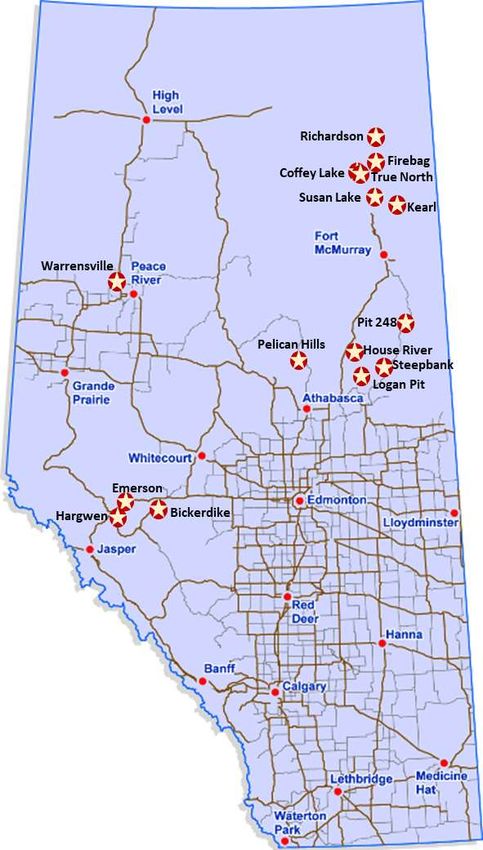
Richardson Quarry Project – Exploration Project
    •    The Corporation holds leases for a potential large-scale quarry located approximately 40 km north of the Coffey
         Lake and 130 km north of Fort McMurray, Alberta for the Richardson Project. It contains high-quality dolomite
         and granite deposits;
    •    Athabasca is continuing front-end development for the Richardson Quarry Project, including a preliminary
         budget for regulatory approvals. Regulatory sensitivities associated with woodland caribou remain a factor
         affecting permit timing and the start of construction. An assessment of a draft Caribou Range Plan published by
         the Government of Alberta in 2018 did not identify immediate negative impacts. The Corporation will align the
         Richardson Project with goals for restoring the caribou habitat pending a final decision for the proposed caribou
         plan; and
    •    Athabasca intends to pursue a joint-venture approach for the development of the Corporation’s Richardson
         Quarry Project north of Fort McMurray over the next two years and is engaged in ongoing discussions with
         potentially interested parties.
Other Aggregates Deposits (Hargwen, Bickerdike, and Steepbank)
    •    The Corporation controls three other deposits for potential development: the Hargwen aggregates deposit, the
         Bickerdike sand deposit, and the Steepbank aggregates deposit.
    •    Hargwen aggregates deposit: is located on approximately 32 hectares (80 acres) of crown land about 21 km east
         of the community of Hinton, Alberta on an all-season road:
              o AMI has an SML- approved in principle;
              o A Conservation Operation & Reclamation Plan was submitted in January 2019 and has been approved
                  by Alberta Environment & Parks; and
              o AMI is continuing to address the opening of the pit, with timing based on upcoming infrastructure
                  projects in the area.
    •    Bickerdike sand deposit: is located on approximately 32 hectares (80 acres) of crown land about 20 km south of
         the community of Edson, Alberta on an all-season road:
              o The Bickerdike sand was tested and considered marginal as proppant for well-drilling and completion
                  applications. Therefore, the Corporation allowed the SML to expire in 2020.
    •    Steepbank aggregates deposit is located on approximately 32 hectares (80 acres) of crown land about 50 km
         south-west of Conklin, Alberta, accessible by approximately 30 km winter access road:
             o In Q3-2020, the Steepbank project was canceled, and management wrote down the carrying value of
                 the associated cumulative exploration costs to $nil, resulting in the recognition of an impairment loss of
                 $105,826 included in other operating expenses.
Strategic Partnerships
    •    Montana First Nation (MFN): In 2019, AMI and MFN entered into a 10-year Aggregates Management Agreement
         to explore and develop potential aggregate resources on 3,885 hectares (9,600 acres) of MFN lands, as well as
         develop commercial opportunities with AMI RockChain. To date, AMI made progress on the following:
              o    AMI RockChain, in conjunction with MFN, has secured an aggregate supply and delivery contract on
                   ‘Spread-1’ of the TMX Pipeline Project;
              o    AMI RockChain and MFN are bidding on additional industrial developments within MFN’s traditional
                   territory;
              o    AMI successfully executed an Emergency Road Repair Program on MFN lands in Q4-2019; and
              o    Initial exploration for aggregates was conducted at select locations on MFN lands in Q3- Q4 2019 with
                   limited results. Due to current market conditions, the Corporation does not expect any exploration
                   in 2021.
    •    In 2020, AMI RockChain participated in the base development of the solar project on Montana First Nations by
         delivering aggregates for the construction company Akamihk Kanataskiy Ventures.

For the quarter and year ended December 31, 2020 Management’s Discussion and Analysis                                   12
Emerson Pit – Development Project
• The Emerson corporate pit is located on 30 hectares (75 acres) of crown land approximately 27 km south-east of
the community of Hinton, Alberta on an all-season road;
• Prairie Mines acquired the SML in March 2013 for 10 years to develop and operate an aggregate operation;
• The Corporation had the SML transferred into its possession on April 17, 2019 in accordance with the asset
purchase and sale agreement dated June 1, 2016 with Prairie Mines; and
• The pit was active in 2019, and 2021 sales will be based on demand from projects in the area.
Firebag – Development Project
• The Firebag silica sand deposit is located north of Fort McMurray, Alberta with an active SML covering 32 hectares
(80 acres).
• In December-2019, the Corporation announced it had updated the previous report for the Firebag Project filed in
2014 (the “Firebag Report”). The updated Firebag Report contains an indicated resource of 38.2 million tonnes
of various fractions. The updated Firebag Report was prepared by Stantec Consulting Ltd. (“Stantec”);
o 4.5 million tonnes in the 20/40 fraction, 19.3 million tonnes in the 40/70 fraction, 13.4 million tonnes in
the 70/140 fraction and 1.0 million tonnes in the 140/170 fraction.
• The asset is fully permitted for mining operations;
• The Corporation has applied for permits to develop a rail transload terminal in the Fort McMurray region to
facilitate transportation to market; and
• The Corporation is exploring options to either develop the pit, assign it to a third party under a royalty agreement,
or divest depending on market prospects.
House River Pit – Development Project
• The House River corporate pit is located on 65 hectares (160 acres) across two leases of Crown land south of Fort
McMurray, Alberta, approximately 11 km east of Highway 63 on the House River.
• During August 2011, the Corporation received SML approval from the Government of Alberta to develop an open-
pit aggregate operation on 32 hectares (80 acres) of the leased land for a term of 10 years.
• A second SML approval was obtained in October 2016 for 10 years for an additional 32 hectares (80 acres) of
Crown land; and
• The House River corporate pit was in production for one winter season with approximately 250,000 tonnes of
aggregates removed in 2016.
Kearl Pit – Development Project
• The Kearl corporate pit is located on 32 hectares (80 acres) of crown land north of Fort McMurray, Alberta on an
all-season road in close proximity to Imperial Oil /Exxon Kearl Oilsands Operations;
• Athabasca received SML approval in March 2011 for 10 years to develop and operate an aggregate operation. This
SML has been extended until October 2030; and
• The Kearl corporate pit was in production for approximately four years with approximately one million tonnes of
aggregates removed. Kearl has not been operational since 2016 in response to a slowdown in the regional market
demand. As would be expected, the pit will have incremental production costs when the time comes to access
the remaining aggregates reserves. Athabasca is currently bidding on multiple projects, as well as considering
strategic partnerships or divestiture options depending on market prospects.
For the quarter and year ended December 31, 2020 Management’s Discussion and Analysis 13Logan Pit – Development Project
• The Logan corporate pit is located on 81 hectares (200 acres) across 3 leases of crown land, approximately 110
km north of Lac La Biche, Alberta, and is accessible by an all-season road to the south and a seasonal winter road
from the east;
• Athabasca received SML approvals for each of the three adjacent leases on February 2010, May 2012, Nov-2012
respectively, in each case for 10 years, to develop and operate an aggregate operation. This SML has been
extended until October 2030; and
• The Logan corporate pit (first lease) was in production from 2013 to 2017 with approximately 400,000 tonnes of
aggregates removed. It has not been operational since 2017 due to changes in the regional demand market and
seasonal access limitations which require advanced orders versus crushing on-demand.
Pelican Hill Pit – Development Project
• The Pelican corporate pit is located on 32 hectares (80 acres) of crown land approximately 70 km south-east of
the hamlet of Wabasca, Alberta, and historically was only accessible by a 2 km winter road;
• Athabasca received SML approval in June-2011 for 10 years to develop and operate an aggregate operation. The
Corporation is actively seeking an extension to the disposition for this lease;
• The Pelican corporate pit has not yet gone into production due to changes in the regional demand market and
seasonal access limitations which require advanced orders versus crushing on demand; and
• In Q2-2019, the Corporation entered into a royalty agreement with a 3rd party. The Corporation is addressing the
opening of the pit for operation in 2021, based on demand associated with potential projects in the area. In early
2021, conversion of a winter-access road by a third party into an all-season road was completed.
Inventory Staging and Distribution Hubs (Conklin, Sunday Creek, KM208, and True North Staging Hub)
The Corporation has strategic inventory staging hubs on accessible, year-round roads to support product supply and
deliveries on demand to local projects and industry customers. These staging hubs are also accessible in relation to nearby
Corporate pits. AMI’s key staging hubs include:
• Conklin - The Conklin staging hub, located 13km East of the Town of Conklin, Alberta. The Conklin staging hub is
accessible by Corporation’s Logan Pit and has inventory on location.
• Sunday Creek - The Sunday Creek staging hub is located 26km North of the Town of Conklin, Alberta on roads
accessible to nearby industry SAGD operations. The Sunday Creek hub has historically staged and delivered
product from various aggregate sources in the area to service annual orders.
• KM248 - Located at kilometer 248 of Highway 881, KM248 hub was historically an aggregate source (now
depleted) and has been re-purposed as a staging hub for industrial customers near the town of Anzac, Alberta,
south of Fort McMurray.
• True North Staging Hub - Strategically located 7 km from the Coffey Lake Public Pit at the Highway-63 junction,
near Fort McMurray, Alberta. AMI received its disposition from Alberta Environment & Parks in Q1-2020. The
Corporation will manage the True North Staging Hub to provide stockpiling and crushing access for aggregate
producers in the area. The Corporation completed vegetation clearing activities in Q1-2020. The vegetation
clearing activities gave rise to an ERO which was included in the Corporation’s liabilities as at December 31, 2020.
AMI RockChain
AMI RockChain is ‘a midstreamer of aggregates, enabled by technology’. The subsidiary is uniquely focused on enhanced
price/delivery solutions in mapping customer orders to aggregates suppliers and transportation companies using
technology for greater speed and efficiency. AMI RockChain purchases and takes custody of aggregates using its ‘Solution
Finder’ algorithm in conjunction with its RockChainTM digital platform. This gives AMI RockChain distinctive advantages in
the scope of its outreach, its ability to handle a large volume of bids, and in the response time for networking optimal
solutions for customers requiring aggregates. AMI RockChain is additionally reinforced by an in-house Quality Control /
Quality Assurance program to ensure customer requirements are met upon delivery.
For the quarter and year ended December 31, 2020 Management’s Discussion and Analysis 14Through the acquisition of TerraShift, AMI RockChain acquired proprietary technology that focuses on resource data,
search intelligence, and geospatial software that will further strengthen the functionality and capabilities of AMI’s
RockChainTM digital platform. TerraShift also brings technical services with highly efficient methods and streamlined
approaches for resource exploration and development, environmental and regulatory planning, resource management,
compliance reporting, and reclamation that benefit a growing customer base across Western Canada and Ontario.
INVESTMENTS IN ASSOCIATES
Duvernay Project
• As of December 31, 2020, the Corporation had a 49.6% ownership interest in Privco2 that owns the Duvernay
Project. On February 5, 2021, the Corporation acquired 100% ownership interest for additional consideration of 8
million shares at $0.25 per share, for total consideration of $2.0 million.
• The Corporation’s cash investments in Privco2 have been allocated towards funding the delineation program, a
NI 43-101 compliant technical report (including validation of reserve or resource), securing land options,
conducting facility design, and for the preparation of regulatory applications;
• In Q3-2019, Privco2 completed a NI 43-101 technical report (the “Duvernay Report”) to validate the reserves and
resources. The Duvernay Report was prepared by Stantec;
• The Privco2 resource encompasses 356 hectares (878 acres) of largely contiguous, and privately-owned,
properties. The underlying sand deposit was delineated based on 49 drill holes, and the retrieval of over 200
stratum samples which were subject to a comprehensive lab testing program;
• The Duvernay Report establishes that the Duvernay Project contains a sand resource of:
o fine-to-coarse grain sands with pay thickness from 0.4 meters to 21.6 meters; and
o 24.7 million metric tonnes (MT) measured resource, with an additional 5.6 million MT indicated resource,
and a further 4.9 million MT inferred resource;
• On February 3, 2020, AMI Silica Inc and Shell ratified a Master Purchase Contract to purchase Premium Domestic
sand from AMI’s Duvernay Basin Silica Project beginning on the later of mid-2021 or 30 days after the Duvernay
facility has been commissioned. Under terms of the contract, there is a minimum sales volume at predetermined
prices, with an optional maximum annual volume that books a significant portion of the Duvernay Project
production capacity. The contract has a five-year term from the effective delivery date, and gives Shell the right
to extend for an additional two 12-month terms thereafter, with the option to procure sand from AMI’s future
Montney In-Basin Project;
• The Corporation invested $1,000,735 in contract costs during 2020 (2019: $nil) in order to secure an offtake
agreement with Shell for silica sand from the Duvernay site;
• In September 2020, the Corporation announced the advancement of a strategic JV initiative with an international
industrial partner to pursue the Duvernay Project. The JV initiative aims to co-develop and operate one of the
greenest sand facilities in North America. The JV initiative offers many unique synergies including industrial land
for construction of the facility, as well as access to industrial utilities and transportation infrastructure, and;
• The development program is presently focused on revising the FEED in collaboration with the international
industrial partner, obtaining permits, and thereafter, confirming FID to proceed to Execution.
For the quarter and year ended December 31, 2020 Management’s Discussion and Analysis 15Montney In-Basin Project
• On December 14, 2018, the Corporation purchased a 49.2% ownership interest in Privco1 that owns the Montney
In-Basin Project located in the vicinity of Dawson Creek and Fort St. John, British Columbia. On February 5, 2021,
the Corporation acquired 100% ownership interest for additional consideration of $1.00. The Corporation is also
using AMI shares to make one final Annual Minimum Royalty ("AMR") payment relating to the Montney deposit,
valued at $200,000, with three corresponding milestone installments.
• The Corporation’s cash investment in the Montney In-Basin Project is being deployed for its resource delineation
program and the subsequent funding of a National Instrument 43-101 technical report for the validation of
reserve or resource status once a preferred development location is confirmed.
• The Corporation is taking a measured approach concerning expenditures in order to confirm the most suitable
and cost-effective location for development within the 150,000 hectare (370,000 acre) mineral lease.
SEGMENTED REPORTING
The reportable segments discussed below represent segments that Management considers when reviewing the
performance of the Corporation and deciding how to allocate resources. A summary of key financial information by
reportable segment for the year ended December 31, 2020 (along with comparative information for 2019) is as follows:
AMI Aggregates AMI RockChain AMI Silica Corporate Consolidation eliminations Consolidated
For the years ended December 31, 2020 2019 2020 2019 2020 2019 2020 2019 2020 2019 2020 2019
Revenue:
Aggregate sales revenue $ - $ 1,014,506 $ 1,271,759 $ 675,286 $ - $ - $ - $ - $ - $ - $ 1,271,759 $ 1,689,792
Management services revenue 457,213 911,034 267,302 - - - - - (51,094) - 673,421 911,034
Revenue 457,213 1,925,540 1,539,061 675,286 - - - - (51,094) - 1,945,180 2,600,826
Total income (loss) and comprehensive
income (loss) (766,364) 1,354,820 (988,881) (321,400) (558,412) (261,313) (1,301,401) (3,492,775) 84,533 - (3,530,525) (2,720,668)
Amortization, depreciation, and depletion (382,313) (271,542) (5,935) (3,485) - - - (66,052) (58,523) - (446,771) (341,079)
Finance costs (86,858) (3,292) - - (16) - - - - - (86,874) (3,292)
Interest income - - - - - - 22,190 90,319 - - 22,190 90,319
Income tax recovery (expense) - - (30,648) - - - - (1,825) - - (30,648) (1,825)
December 31, December 31, December 31, December 31, December 31, December 31, December 31, December 31, December 31, December 31, December 31, December 31,
As at 2020 2019 2020 2019 2020 2019 2020 2019 2020 2019 2020 2019
Segment assets $ 9,869,939 $ 12,448,558 $ 910,367 $ 689,520 $ 5,666,381 $ 4,911,880 $ 7,974,580 $ 2,365,482 $ (5,878,065) $ (2,142,980) $ 18,543,202 $ 18,272,460
Segment liabilities 4,237,133 3,720,962 534,685 470,849 188,833 1,516,780 397,717 435,035 - (2,142,980) 5,358,368 4,000,646
The Corporation has three reportable Operations segments, and a Corporate costs segment:
AMI Aggregates
The Corporation produces and sells aggregate out of its Corporate Owned Pits (see the Operations section of this MD&A);
manages the Coffey Lake aggregate pit on behalf of the Government of Alberta for which aggregate management services
revenue are earned, and manages other contract work for customers. The Corporation previously managed the Susan
Lake aggregate pit which was closed to the public in the second quarter of 2019.
For the quarter and year ended December 31, 2020 Management’s Discussion and Analysis 16Total revenues of $0.5 million from AMI Aggregates for 2020 declined from the 2019 level of $1.9 million due to:
• the closing of Susan Lake in Q2-2019 which directly impacted management services revenues; and
• aggregate sales revenues and management services revenues both being negatively impacted in 2020 due to the
economic effects of the COVID-19 pandemic. Coffey Lake was active for less than 90 days in 2020, but resumed
operations in January 2021.
The total loss and comprehensive loss for the year ended December 31, 2020 was $0.8 million, which is consistent with the
low operating levels during 2020 as compared to total income and comprehensive income of $1.4 million for the
comparable 2019 period. As noted in the discussion earlier under Gross Loss and Operating Loss in the Financial and
Operational Review section, there were several material revaluations of non-financial assets and liabilities in 2019 and
2020, which had the effect of increasing income in 2019 and increasing losses in 2020. Amortization, depreciation, and
depletion of $0.4 million was essentially unchanged from the comparable prior-year period.
This segment’s assets as of December 31, 2020 were $9.9 million (2019: $12.4 million) consisted of resource properties and
ERO assets carried at $5.1 million, contract costs of $1.5 million, restricted cash of $1.1 million, and inventory at $0.8 million.
Other assets such as deposits and property and equipment amounted to $1.4 million.
Segment liabilities as of December 31, 2020 were $4.2 million (2019: $3.7 million) are comprised of environmental
rehabilitation obligations of $2.6 million, outstanding principal on the Coffey Lake loan of $1.3 million, and accounts payable
of $0.3 million.
AMI RockChain
AMI RockChain purchases and takes custody of aggregates using its ‘Solution Finder’ algorithm in conjunction with its
RockChainTM digital platform. Through the acquisition of TerraShift, AMI RockChain acquired proprietary technology that
focuses on resource data, search intelligence and geospatial software that will further strengthen the functionality and
capabilities of AMI’s RockChainTM digital platform (see the Operations section of this MD&A).
Segmented revenues from aggregate sales for the year ended December 31, 2020 were $1.3 million as compared to $0.7
million for the comparable period in 2019 when the division was still being established. AMI RockChain also earned $0.3
million in management services revenue via its TerraShift operations, as opposed to $nil for the comparable period in 2019
prior to the TerraShift acquisition.
AMI RockChain’s total loss and comprehensive loss increased for the year ended December 31, 2020 to $1.0 million
compared to $0.3 million for the equivalent period in 2019. The loss in both years was the result of low activity, due to
operations being new in 2019 and 2020 being impacted by the effects of COVID-19. There were staffing reductions in the
AMI RockChain division as part of the company-wide optimization initiative, which were offset by the addition of TerraShift
employees. Segment assets increased from $0.7 in 2019 to $0.9 million in 2020. This was due to AMI RockChain starting
business activities in March 2019 when its first employee was hired and the business model developed, with organic
growth in 2020 as well as the acquisition of TerraShift. Liabilities at $0.5 million were unchanged year over year.
For the quarter and year ended December 31, 2020 Management’s Discussion and Analysis 17You can also read