Mapletree Commercial Trust - 1Q FY21/22 Business Updates 23 July 2021 - Mapletree ...
←
→
Page content transcription
If your browser does not render page correctly, please read the page content below
Mapletree Commercial Trust
     1Q FY21/22 Business Updates

                    23 July 2021

                                   0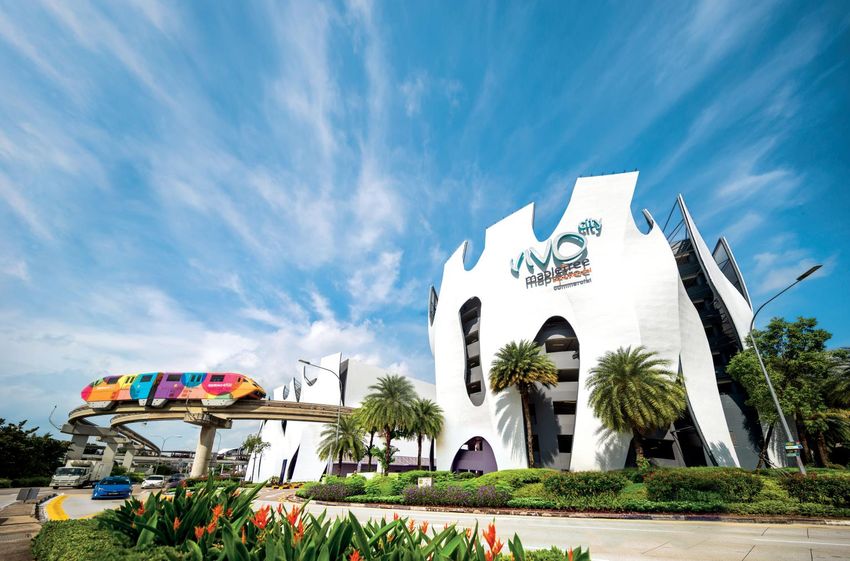
Important Notice
This presentation is for information only and does not constitute an offer or solicitation of an offer to sell or
invitation to subscribe for or acquire any units in Mapletree Commercial Trust (“MCT” and units in MCT
(“Units”)).

The past performance of the Units and MCT is not indicative of the future performance of MCT or Mapletree
Commercial Trust Management Ltd. (“Manager”). The value of Units and the income from them may rise or
fall. Units are not obligations of, deposits in or guaranteed by the Manager or any of its affiliates. An
investment in Units is subject to investment risks, including the possible loss of the principal amount
invested. Investors have no right to request the Manager to redeem their Units while the Units are listed. It is
intended that unitholders may only deal in their Units through trading on the SGX-ST. Listing of the Units on
the SGX-ST does not guarantee a liquid market for the Units.

This presentation may also contain forward-looking statements that involve risks and uncertainties. Actual
future performance, outcomes and results may differ materially from those expressed in forward-looking
statements as a result of risks, uncertainties and assumptions. Representative examples of these factors
include general industry and economic conditions, interest rate trends, cost of capital, occupancy rate,
construction and development risks, changes in operating expenses (including employee wages, benefits
and training costs), governmental and public policy changes and the continued availability of financing. You
are cautioned not to place undue reliance on these forward-looking statements, which are based on current
view of management on future events.

Nothing in this presentation should be construed as financial, investment, business, legal or tax advice and
you should consult your own independent professional advisors.

                                                                                                                    1
Content Key Highlights Page 3 Financial Performance Page 6 Portfolio Updates Page 10 Outlook Page 17

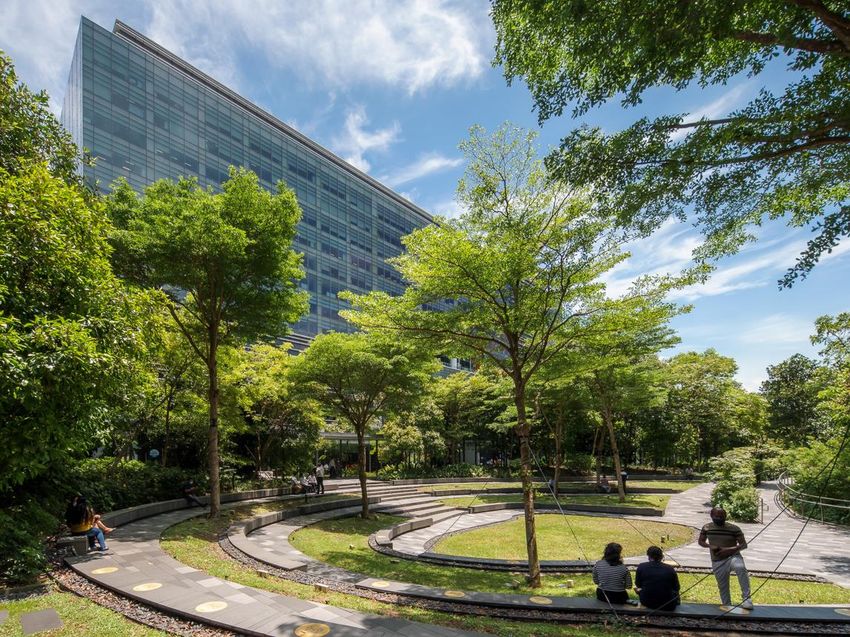
Key Highlights

                 VivoCity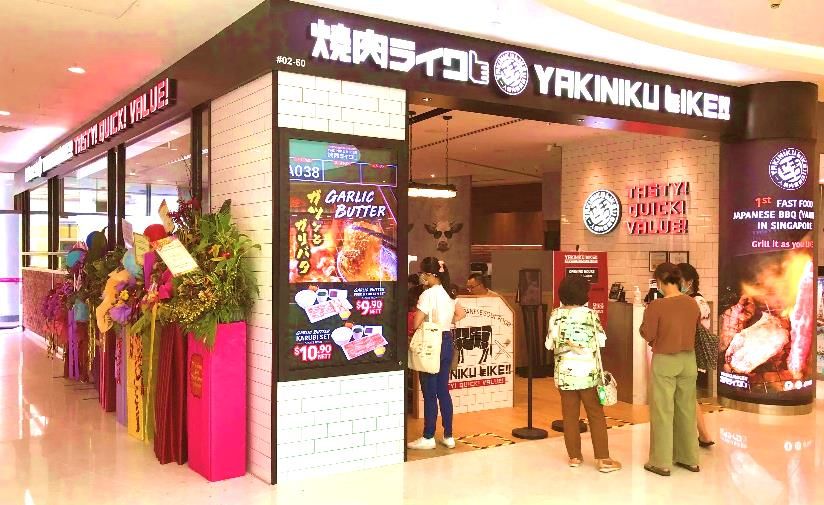
Key Highlights
Financial Performance
1Q FY21/22 performance impacted by retightened COVID-19 measures1 but less
severe than a year ago
1Q FY21/22 gross revenue and net property income (“NPI”) higher mainly due to
lower rental rebates and compensation from a lease pre-termination at mTower
Swiftly provided rental assistance to eligible retail tenants amounting to ~0.6 month
of fixed rents during the quarter
Portfolio Performance
VivoCity’s 1Q FY21/22 tenant sales and shopper traffic mainly impacted by five-
week cessation of dining-in at all F&B establishments
Portfolio achieved 95.4% committed occupancy
1. Singapore entered Phase 2 (Heightened Alert) from 16 May to 13 June 2021 during which the government halted dining-in at all F&B
establishments, capped the limit for social gatherings at two, and imposed work-from-home as the default work arrangement. The limit on
social gatherings was raised to five from 14 June but dining-in could only resume (subject to group size limit of two) from 21 June 2021.
Work-from-home directives continue to be in place to-date.
4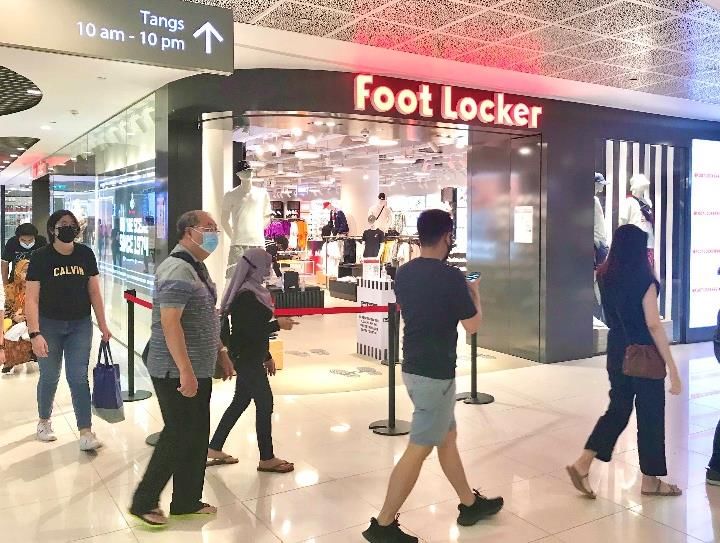
Key Highlights
Capital Management
Capital management strategy continues to prioritise financial flexibility and liquidity
Well-distributed debt maturity profile with no more than 24% of debt due for
refinancing in any financial year
5
Financial
Performance

         VivoCity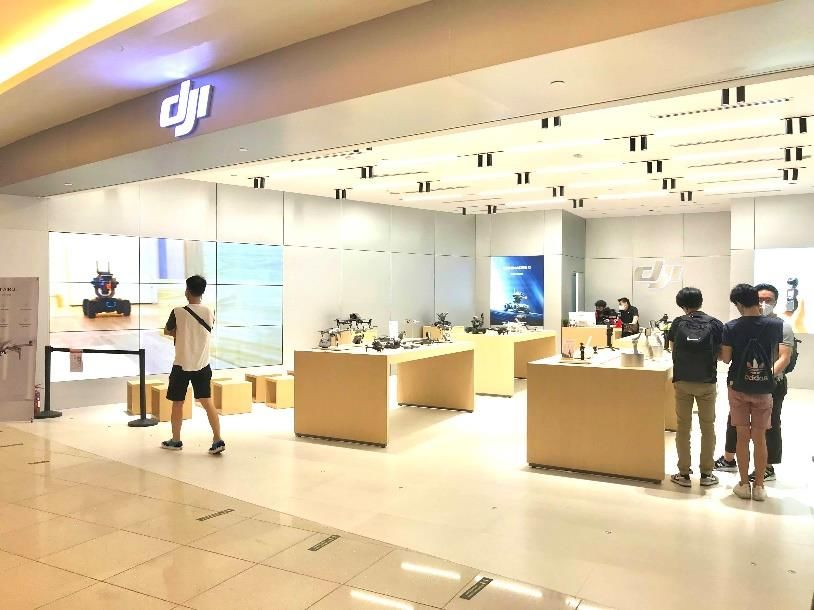
1Q FY21/22 Segmental Results
                1Q FY21/22 gross revenue and NPI up 23.7% and 22.9% respectively
    Mostly due to lower rental rebates and compensation from a lease pre-termination at mTower

               Gross Revenue                                 Property Expenses                                Net Property Income
                      23.7%                                             26.8%1                                            22.9%
 140.0                                                                                                120.0
                              124.1
 120.0                          5.0                                                                                               96.9
                                8.8                                                                   100.0
                                                                                                                                  4.1
             100.3                                                                                                                7.1
 100.0                         16.5
               4.9                                                                                                78.92
                                                                                                       80.0                       13.4
               8.6                                   30.0                                                          4.0
                                                                                    27.22                          7.0
  80.0        10.8                                                                   1.0
                                                     25.0                            1.7                           8.1
                               52.8                            21.5                  3.1               60.0
  60.0                                               20.0         1.0                                                             42.7
                                                                  1.6
              52.9                                                2.7
(S$ mil)                                        (S$ mil)                            10.1             (S$ mil)
                                                                                                       40.0
                                                     15.0                                                          43.5
  40.0
                                                                  9.4
                                                     10.0
                                                                                                       20.0
  20.0                         41.0
                                                      5.0                           11.5                                          29.6
              23.1                                                6.8                                              16.4
    0.0                                               0.0                                               0.0
           1Q FY20/21      1Q FY21/22                       1Q FY20/21       1Q FY21/22                         1Q FY20/21   1Q FY21/22

                                          VivoCity          MBC            mTower           Mapletree Anson        MLHF

1. Mainly due to property tax rebates received from the government in 1Q FY20/21.
2. Total does not add up due to rounding differences.
                                                                                                                                          7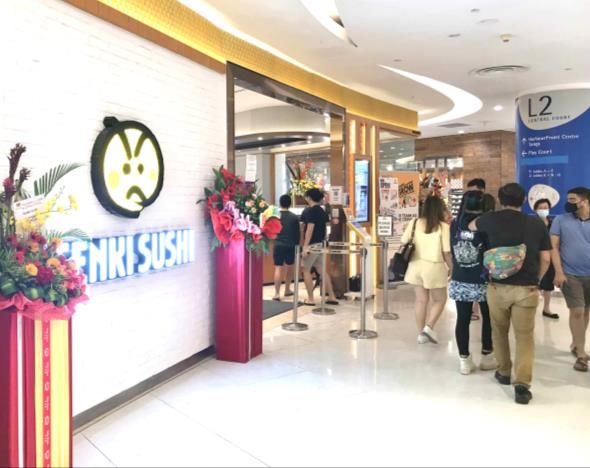
Key Financial Indicators
                                     Maintained robust balance sheet
             Every 25 bps change in Swap Offer Rate estimated to impact DPU by 0.06 cents p.a.

                                                                  As at                               As at                                 As at
                                                              30 June 2021                        31 March 2021                         30 June 2020
Total Debt Outstanding                                        S$3,007.0 mil                        S$3,032.9 mil                        S$3,068.2 mil

Gearing Ratio                                                      34.2%1                                33.9%                                33.7%
Interest Coverage Ratio
                                                                 4.8 times                            4.4 times                             4.1 times
(12-month trailing basis)
% Fixed Rate Debt                                                   75.7%                                70.7%                                73.5%
Weighted Average All-In Cost
                                                                   2.44%3                                2.48%                               2.61%4
of Debt (p.a.)2

Average Term to Maturity of Debt                                 4.0 years                            4.2 years                             3.9 years

Unencumbered Assets as %
                                                                    100%                                 100%                                  100%
of Total Assets
MCT Corporate Rating
                                                              Baa1(stable)                       Baa1(negative)                        Baa1(negative)
(by Moody’s)

1.   Based on total gross borrowings divided by total assets. Correspondingly, the ratio of total gross borrowings to total net assets is 53.6%.
2.   Including amortised transaction costs.
3.   Annualised based on the quarter ended 30 June 2021.
4.   Annualised based on the quarter ended 30 June 2020.
                                                                                                                                                        8
Debt Maturity Profile (as at 30 June 2021)
                             Financial flexibility from more than S$400 mil of cash and undrawn committed facilities
                           Well-distributed debt maturity profile with no more than 24% of debt due in any financial year
   Total gross debt: S$3,007.0 mil

                          800                                                                            Bank Debt
                                                               725.0                725.0                Medium Term Note
                          700

                          600
    Gross Debt (S$ mil)

                                           489.9
                          500
                                                                                    550.0
                                                                605.0
                          400
                                           289.9
                          300                        255.0
                                                                          462.1
                          200
                                                     170.0
                                                                                                                     250.0
                          100              200.0                                    175.0
                                                      85.0      120.0                         100.0
                           0
                                FY21/22   FY22/23   FY23/24    FY24/25   FY25/26   FY26/27   FY27/28    FY28/29      FY29/30

       % of
                                   -        16%        9%        24%       15%       24%        3%         -           8%
Total Debt1

     1. Total does not add up to 100% due to rounding.

                                                                                                                               9
Portfolio Updates Mapletree Business City 10
Portfolio Occupancy
                         Compensation from pre-terminated lease at mTower
                         provides more than 1 year of lead time for backfilling

                                                                                  June 2021
                                June 2020           March 2021
                                                                         Actual         Committed1

VivoCity                          98.3%                97.1%              97.7%           99.4%

MBC                               97.6%                94.2%              93.1%           96.6%

mTower                            88.7%                75.5%              72.3%           76.7%

Mapletree Anson                    100%                100%               99.2%           99.2%

MLHF                               100%                100%               100%            100%

MCT Portfolio                     97.1%                93.5%              92.6%           95.4%

1. As at 30 June 2021.

                                                                                                     11
Lease Expiry Profile (as at 30 June 2021)
Portfolio resilience supported by manageable lease expiries
WALE Committed Basis
Portfolio 2.4 years1
Retail 2.2 years
Office/Business Park 2.6 years
16.1%
As % of Gross Rental Income
13.5%
12.4%
10.3% 9.7% 9.2%
8.1% 8.5%
6.7%
5.4%
FY21/22 FY22/23 FY23/24 FY24/25 FY25/26…
FY25/26
& beyond
Retail Office/Business Park
1. Portfolio WALE was 2.2 years based on the date of commencement of leases.
12VivoCity – Shopper Traffic and Tenant Sales
1Q FY21/22 shopper traffic and tenant sales dampened by five-week cessation of dining-in
Year-on-year growth mostly due to ten-week closure of non-essential businesses in 1Q FY20/211
Shopper Traffic (mil) Tenant Sales (S$ mil)2
114.1% 111.7%
7.0 200.0
6.0
6.0 162.1
150.0
5.0
4.0
100.0
3.0 2.8 76.5
2.0
50.0
1.0
0.0 0.0
1Q FY20/21 1Q FY21/22 1Q FY20/21 1Q FY21/22
1. Refers to circuit breaker from 7 April to 1 June 2020 and Phase One easing of circuit breaker from 2 to 18 June 2020 during which the majority of businesses
were closed, as well as prolonged work-from-home directives, restrictions on atrium events and border closures.
2. Includes estimates of tenant sales for a small portion of tenants.
13VivoCity – Recovery Momentum Disrupted by Retightened Measures
For the period from 21 to 30 June 2021, when dining-in was allowed to resume,
the average daily shopper traffic reached about half of pre-COVID levels
Monthly Tenant Sales and Shopper Traffic
(year-on-year comparison)
Phase 2
350% Heightened (Heightened Alert)
safe distancing measures
Stage 1 of
300% Phase 3 of Circuit Phase 3
Closure of Breaker re- (Heightened
borders opening Alert)
250%
Phase 2 of Stage 2 of
Circuit Breaker Phase 3
re-opening (Heightened
200% Alert)
Start of
Circuit Breaker
150%
100%
50%
0%
Jan-20 Feb-20 Mar-20 Apr-20 May-20 Jun-20 Jul-20 Aug-20 Sep-20 Oct-20 Nov-20 Dec-20 Jan-21 Feb-21 Mar-21 Apr-21 May-21 Jun-21
Shopper Traffic Shopper Traffic (rebased against 2019)
Tenant Sales Tenant Sales (rebased against 2019)
14Swiftly Rendered Assistance When COVID-19 Measures Were Reimposed
Provided rental rebates to eligible retail tenants totalling 0.6 month1 of fixed rents in 1Q FY21/22
Commits to render additional assistance where warranted
COVID-19 Timeline
Average quantum of rental
7 Feb 2020 Government raised DORSCON2 level from yellow to orange Period
rebate/waiver for eligible tenants
23 Mar 2020 No entry or transit through Singapore for all short-term visitors
Circuit breaker period March 2020 –
7 Apr – 1 Jun 2020
• All non-essential industries and retail shall be closed ~4.4 months3
• The public is required to stay at home unless for essential March 2021
services
2 Jun 2020
Easing of circuit breaker. 1Q FY21/22 ~0.6 month
Phase One: Safe Re-opening – majority of business remained closed
Further easing of circuit breaker Total to date ~5.0 months
From 19 Jun 2020 Phase Two: Safe Transition – most businesses allowed to resume
operations; social gatherings allowed in groups of five
From 28 Sep 2020 Up to 50% of workforce allowed to return to their workplaces
Further easing of circuit breaker
From 28 Dec 2020 Phase Three: Safe Nation – increased capacity limits for events and
activities; social gathering sizes raised from five to eight
From 5 Apr 2021 More employees (up to 75% of workforce) allowed to return to their
workplaces
From 8 May 2021 Tightened circuit breaker measures. Workplace capacity reverted to
50% and social gathering limits reduced to from eight to five
Phase Two (Heightened Alert) – Cessation of dining-in at all F&B
From 16 May 2021
establishments, reduced social gathering limit from five to two and
resumption of work-from-home as default arrangement
From 14 Jun 2021 Phase Three (Heightened Alert) Stage 1 – Gradual lifting of
1. Assistance for each tenant is calibrated based on their respective actual sales
restrictions. Increased limits on social groups from two to five
performance and subject to tenant’s acceptance.
Phase Three (Heightened Alert) Stage 2 – Dining-in allowed to 2. The DORSCON is a colour-coded framework administered by the government that
From 21 Jun 2021
resume for groups of two shows the current disease situation and provides general guidelines on what needs to
be done to prevent and reduce the impact of infections. DORSCON orange signifies an
Further increase in social gathering limits and dine-in capacity limit outbreak with moderate to high public health impact and the public has to comply with
From 12 Jul 2021
raised to five. Borders remain closed
control measures.
Dining-in halted, social group sizes reduced to two as Singapore 3. Includes the passing on of property tax rebates, cash grants from the government and
From 22 Jul 2021 other mandated grants to qualifying tenants.
returns to Phase Two (Heightened Alert)
15VivoCity – Continuous Effort in Injecting Novelty
Introduced new and refreshing retail concepts in spite of COVID-19 disruptions
Foot Locker – Retails popular sneaker brands under DJI – Renowned maker of camera drones opened its retail Love & Co – Specialises in couple
one roof, catering to the growing athleisure demand and service centre bands and engagement rings
Genki Sushi – Japanese restaurant serving Yakiniku Like – Japanese restaurant that offers a solo-dining
sushi on conveyor belts barbeque concept with top-quality meats at value prices
Note: The above only represents a portion of tenants that were introduced in 1Q FY21/22.
16Outlook
Mapletree Business City
17Outlook
Singapore Economy
Based on the Ministry of Trade and Industry’s (“MTI”) advance estimates, the Singapore economy
grew by 14.3% on a year-on-year basis in the second quarter of 2021, extending the 1.3% growth in
the previous quarter. The strong growth was largely due to the low base in the second quarter of 2020
when GDP fell by 13.3% due to the circuit breaker implemented from 7 April to 1 June 2020. On a
quarter-on-quarter seasonally-adjusted annualised basis, the economy contracted by 2.0% in the
second quarter, a reversal from the 3.1% growth in the preceding quarter.
Retail
According to CBRE, the retail sector encountered another setback with stricter measures during
Phase 2 (Heightened Alert) from 16 May till 13 June 2021. With work-from-home remaining as the
default and borders still closed, the retail market continues to face pressures albeit with a smaller
magnitude of rental decline.
Even though the sector is poised to benefit from an improvement in economic activity and consumer
sentiment on the back of vaccination rollout, secondary outbreaks could pose disruptions and border
controls will continue to impede full market recovery for the rest of 2021.
Sources: The Singapore Ministry of Trade and Industry Press Release, 14 July 2021 and CBRE MarketView Singapore Q2 2021
18Outlook
Office
The initial positive leasing momentum in the first half of Q2 2021 was halted with the tightening of
measures in May 2021 under Phase 2 (Heightened Alert). Work-from-home became the default again
and these restrictions impacted leasing enquiry levels.
With limited new and expansionary demand, most leasing transactions comprised renewals and
relocations. With the tight vacancy in the Grade A market, some landlords of better performing
buildings have begun to push for higher rents. Conversely, it was more challenging for the Grade B
market to backfill existing vacancies.
Going forward, there are still potential risks on the demand side, but the tapering supply pipeline
bodes well for the market. The market remains two-tiered in the medium term – the outlook for Grade
A market looks positive, but recovery for Grade B market is likely to lag behind.
Business Park
The overall leasing interest in the business park market was relatively subdued with renewals being
the key driver of leasing activities in Q2 2021.
The City Fringe submarket continued to be underpinned by tight availability of space. The Rest of
Island submarket saw some positive take-up but given the high vacancy rates, landlords maintained
some flexibility in rental negotiations to shore up occupancy levels.
19Outlook
Business Park (cont’d)
Going forward, any rental growth is likely to stem from the City Fringe submarket given limited
upcoming supply and strong demand. However, upcoming supply within the Rest of Island submarket
is likely to put further downward pressure on rents. Nonetheless, overall demand for the business
park market remains resilient.
Overall
Although Singapore is once again retightening measures to contain the community spread of COVID-
19, positive momentum is expected to resume once measures are eased again. Although downside
risks remain in this fluid environment, we also expect recovery to be nearer than before as the
country continues to make progress in vaccinating the majority of the population.
MCT’s focus remains to maintain a healthy portfolio occupancy and sustainable rental income by
proactively managing our assets. MCT will also continue to be proactive and nimble in implementing
appropriate measures such as assisting tenants, managing costs and mitigating the impact from
further disruptions, while supporting the authorities’ effort in containing the outbreak.
Anchored by a well-diversified portfolio with key best-in-class assets, MCT is expected to derive
stable cashflows from high quality tenants. MCT’s overall resilience will keep the vehicle well-placed
to ride through the pandemic.
20Thank You
For enquiries, please contact:
Teng Li Yeng
Investor Relations
Tel: +65 6377 6836
Email: teng.liyeng@mapletree.com.sg
21You can also read


