MARKET OUTLOOK 15/03/2022 - V6 - Bollore Logistics
←
→
Page content transcription
If your browser does not render page correctly, please read the page content below

B I M O N T H LY
MARKET OUTLOOK
15/03/2022 – V6

KEY POINTS
The Russia-Ukraine conflict has sent ripples through financial markets world over, but the impact on
container shipping stocks thus far has been negligible. On the other hand the escalation of the conflict has
had significant implications on the aviation industry.
As of the 15th of March 2022, 92 776 commercial flights were flown per day in the last seven days, compared to 73
161 and 99 517 in 2021 and 2020, respectively.
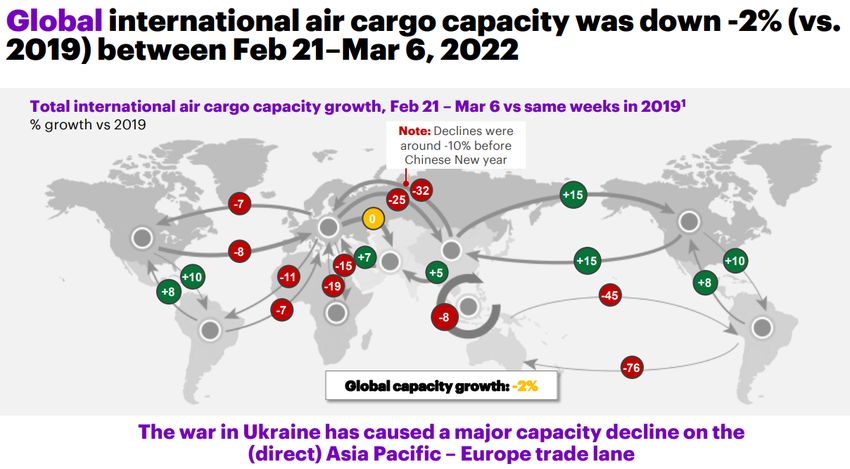
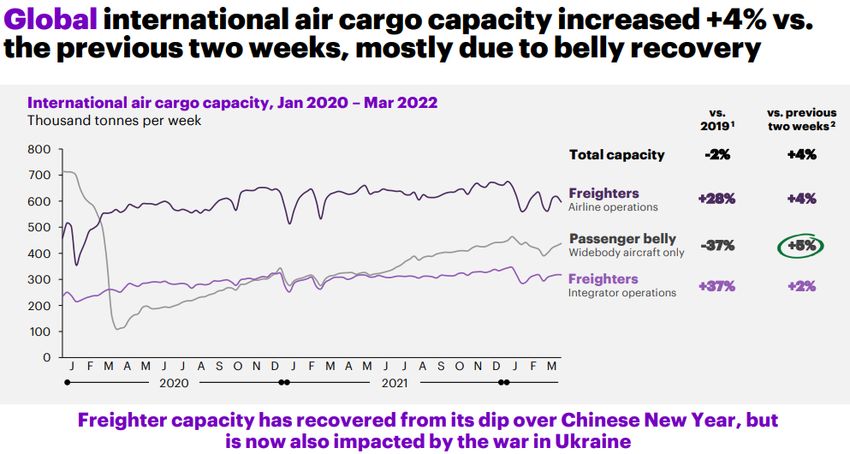
Global international air cargo capacity decreased by 2% (vs 2019) between February the 21st and March
the 6th.
63 cancelled sailings have been announced between weeks 11 and 14, out of a total of 558 scheduled sailings,
representing 11% cancellation rate.
Schedule reliability dropped from 78.0% in 2019 to 63.9% in 2020, and then to 35.8% in 2021, which is not only
the lowest recorded FY schedule reliability but is also quite a staggering drop from the pre-2020 levels.
According to the latest data on the Alphaliner Weekly Newsletter, Asia to North America average weekly capacity is
up 27.6% ciompared to January 2021. The Asia – Europe offering is up 9.3%.
Source: Seabury, Flightradar24, Drewry, Sea Intelligence BIMONTHLY MARKET OUTLOOK 2
UKRAINE –                    IMPACT ON SHIPPING WORLD

Impact on container shipping stocks
The Russia-Ukraine conflict has sent ripples through financial markets world over, but the
impact on container shipping stocks thus far has been negligible. While it is still early to
assess the overall impact in the long run, two things are certain – increasing risks and
uncertainty in the medium-to-long term, and strong cash flows for liner operators in
2022.

Russia-Ukraine conflict – (little) impact on container shipping
MSCI world index had plunged by more than 13% YTD as of 8 March 2022. In comparison,
the Drewry Container shipping equity index had lost a little less than 6%.

Medium-to-long term impact on the sector
The longer the conflict between the two countries, the larger would be the impact felt by
the global economy. Even in an event of an early resolution, the sanctions placed would
drive inflation, and diminish consumer demand and discretionary spending. In such a
scenario, overall imports will take a pounding, which could give the port operators the
breathing space to ease port congestion, and thereby contribute towards the easing of
bottlenecks that are currently plaguing the supply chain industry. All in all, a lot remains
uncertain – the duration of the war, the expanse of the sanctions, the impact on global
economy and inflation, and the subsequent toll on consumer demand.

The only certainty is that the ongoing conflict has substantially increased the uncertainty
in the global container shipping market in the medium-to-long term. As a result, we
maintain our Neutral outlook on most of the stocks, as there is a limited upside and a
limited downside, at least for 2022.

 Source: IATA, Drewry                    Last updated: 15/03                                   BIMONTHLY MARKET OUTLOOK   3

UKRAINE –                    IMPACT ON AIR FREIGHT

Impact on air freight
The escalation of the conflict between Ukraine and Russia has significant implications on the
aviation industry. Governments have adopted economic sanctions that specifically target the
industry and closed large areas of air space, fuel is trading at a historical high and fear of
continued warfare is affecting the already fragile air passenger demand.

The week starting 24 February saw bookings decline by 8% compared to the week prior. This
decline could be observed in both domestic and international bookings - 8% and 9%
respectively. Domestic travel was clearly affected in Russia and Ukraine, however some of
the fall in domestic demand can be attributed to the seasonal reduction in Chinese domestic
travel after the New Year holidays.

The decline was sharper in the wider Europe region where there were 14% fewer bookings
made the week starting 24 Feb than the week before. The largest drops in demand could be
observed for travel to and from Eastern European countries. Ukraine and Moldova both
closed their air space completely, and saw negative net bookings, i.e. more refunds than
new ticket sales that week. Russia also closed its air space to certain countries’ carriers,
and their bookings declined by 52%.

While the countries neighbouring Ukraine have seen a drop in demand from incoming
travellers, they have also seen a surge in bookings for outbound flights by refugees from
Ukraine. Some low-cost airlines have reported increasing capacity out of these countries to
Western European destinations. Booking data available to IATA also suggests a surge in
demand for travel to countries with sizeable expatriate population in Ukraine. For example,
bookings have increased to India, Nigeria, Georgia and Morocco departing from Poland,
Hungary and Romania.

 Source: IATA, Drewry                   Last updated: 15/03                                      BIMONTHLY MARKET OUTLOOK   4
AIR FREIGHT – MARKET TRENDS (28/02– 06/03)
           •   In week 9, worldwide volume decreased by -5% compared with previous week. Worldwide capacity decreased by -2% week-over-week.
           •   On a regional level, volumes from Middle East & South Asia went up +4%, while other regions showed a decrease, being largest from Central &
               South America at -16%.
           •   The average worldwide yield/rate in week 9 remained stable compared with previous week, but with clear differences between the regions. While on
               the Transatlantic the average yield/rate was flat week-over-week, on the Transpacific it went down, and for markets between Europe and Asia
               Pacific it went up.

                                             Trends based on appr 250 000 transactions per week WorldACD publishes weekly data for
                                          hundreds of markets the largest market based on data for 170 forwarders, the smallest on data for
                                                                                   20 forwarders.

WorldACD         Last updated: 15/03                                                                                         BIMONTHLY MARKET OUTLOOK   5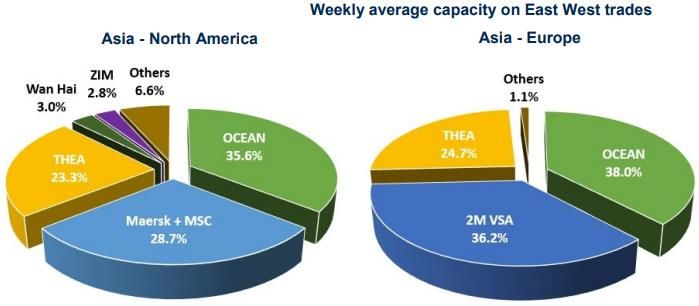
AIR FREIGHT – MARKET TRENDS (21/02 – 06/03)
          •   Airspace closures as a result of the war in Ukraine have by now resulted in a -25% drop in direct air cargo capacity between Europe and North East
              Asia. Last week saw additional air cargo capacity being taken out of the market after Japanese airlines cancelled and rerouted flights.
          •   Freighters between Europe and North East Asia are now (only partially) routed via the Middle East & Caucasus region. Freighter air cargo capacity
              on other trade lanes has seen only minor changes.
          •   Specific air trade industries and trade lanes could potentially see a major impact of the war in Ukraine. As an example, Russia is a major air
              destination for fresh cut flowers, particularly from Ecuador and The Netherlands.

Seabury          Last updated: 15/03                                                                       BIMONTHLY MARKET OUTLOOK          6
AIR FREIGHT – AIR CARGO CAPACITY

Seabury     Last updated: 15/03              BIMONTHLY MARKET OUTLOOK   7
AIR FREIGHT – COMMERCIAL FLIGHTS TRACKER

                  As of the 15th of March 2022, 92 776 commercial flights were flown per day in the last seven days, compared to 73
                  161 and 99 517 in 2021 and 2020, respectively.
                  On a year-to-date basis, 6 493 181 commercial flights have been flown this year, 36% more than 2021 and 16%
                  less than 2020.
                                         Commercial flights = Commercial passenger flights + cargo flights + charter flights + some business jet flights.

Flightradar24      Last updated: 15/03                                                                                      BIMONTHLY MARKET OUTLOOK        8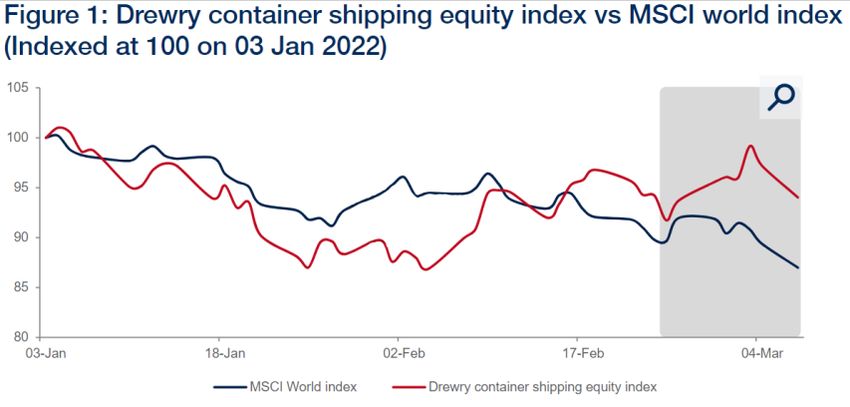
SEA FREIGHT – CANCELLED SAILINGS – 15/03
         Across the major trades: Transpacific, Transatlantic and Asia-
         North Europe & Med, 63 cancelled sailings have been
         announced between weeks 11 and 14, out of a total of 558
         scheduled sailings, representing 11% cancellation rate. During
         this period, 48% of the blank sailings will be occurring in the
         Transpacific Eastbound trade, and mostly to the West Coast.

         Over the next 4 weeks, The Alliance has announced 24.5
         cancellations, followed by 2M and Ocean Alliance with 13 and 8.5
         cancellations, respectively.

         The conflict in Ukraine continues to escalate, heaping further
         pressure on supply chains as carriers re-route cargoes to ports
         already suffering congestion. The global economy will undoubtedly
         be impacted by the United States announcement of a ban on
         Russian oil and gas imports.

Drewry           Last updated: 15/03                                         BIMONTHLY MARKET OUTLOOK   9
SEA FREIGHT – WORLD CONTAINER INDEX (WCI)
         The composite index decreased by 1.1% this week,
         but, remains 83% higher than a year ago.
         The average composite index of the WCI,
         assessed by Drewry for year-to-date, is $9,412 per
         40ft container, which is $6,312 higher than the five-
         year average of $3,101 per 40ft container.
         Freight rates on Shanghai – Rotterdam fell 2% per
         40ft box. Spot rates on Shanghai – Genoa dropped
         1% per feu. Similarly, FAK rates on New York –
         Rotterdam sank 2%. However, rates on Rotterdam
         – Shanghai grew 2%.
         Rates on Shanghai – Los Angeles, Shanghai –
         New York, Los Angeles – Shanghai and Rotterdam
         – New York hovered around previous weeks level.
         Drewry expects spot rates to decrease next week
         and the composite index may fall below $9,000 per
         40ft container for the first time since 29th July
         2021.

                 The World Container Index is a composite of container freight rates on 8 major routes to/from the US, Europe and Asia, assessed by Drewry.

Drewry           Last updated: 15/03                                                                                 BIMONTHLY MARKET OUTLOOK 10
SEA FREIGHT - GLOBAL SCHEDULE RELIABILITY
Schedule reliability dropped from 78.0% in 2019 to 63.9% in 2020, and then to 35.8% in 2021, which is not only
the lowest recorded FY schedule reliability but is also quite a staggering drop from the pre-2020 levels. The
average delay for LATE vessel arrivals has been on an upwards trend since the lowest recorded delay of 3.19
days in 2016.
In 2021, the figure nearly touched the 7-day mark, reaching 6.86 days. The average delay for ALL vessel arrivals
recorded a sharp increase in 2020, and an even sharper increase in 2021, with the 2021 figure crossing the
4-day mark for the first time.
Sea Intelligence Last updated: 15/03 BIMONTHLY MARKET OUTLOOK 11SEA FREIGHT – FLEET CAPACITY Alphaliner Last updated: 15/03 BIMONTHLY MARKET OUTLOOK 12
SEA FREIGHT - CAPACITY OUTLOOK (WEEK 10 - 21)
                                                                                                                                              Upcoming 12
                                                                    Highlights
                                                                                                                                               weeks (Y/Y)

            Asia                        In the Asia-North Europe trade lane the weekly capacity decreases drastically in week 12, and
              -                         increases significantly in week 15. On the backhaul, the weekly capacity increases significantly in      20.3%
        North Europe                    week 16, and decreases drastically in week 19.

           Asia                         In the Asia-Mediterranean trade lane the weekly capacity decreases drastically in week 12, and
             -                          increases significantly in week 19. On the backhaul, the weekly capacity increases drastically in        8.7%
       Mediterranean                    week 12, and decreases significantly in week 19.

         Asia
                                        In the Asia-NAEC trade lane the weekly capacity decreases significantly in week 12, and increases
           -                                                                                                                                     45.2%
                                        drastically in week 16.
North America East Coast
         Asia            In the Asia-NAWC trade lane the weekly capacity decreases significantly in week 14, and increases
            -            drastically in week 16. On the backhaul, the weekly capacity decreases drastically in week 11, and                      26.7%
North America West Coast increases significantly in week 19.

          Asia           In the Asia-ECSA trade lane the weekly capacity increases drastically in week 16 and 21, and
            -            decreases significantly in week 17. On the backhaul, the weekly capacity increases drastically in                       21.5%
East Coast South America week 10, and decreases significantly in week 11.

   Sea Intelligence      Last updated: 15/03                                                           BIMONTHLY MARKET OUTLOOK 13
SEA FREIGHT - CAPACITY OUTLOOK (WEEK 10 - 21)
Upcoming 12
Highlights
weeks (Y/Y)
North America East Coast In the NAEC-ECSA trade lane the weekly capacity increases significantly in week 10 and 21, and
- decreases drastically in week 11, 16 and 20. In the ECSA-NAEC trade lane the weekly capacity 0.4%
East Coast South America decreases drastically in week 11, and increases significantly in week 17.
North Europe In the North Europe-ECSA trade lane the weekly capacity increases significantly in week 12, and
- decreases drastically in week 15 and 17. In the ECSA-North Europe trade lane the weekly capacity 18.7%
East Coast South America decreases drastically in week 12, 13 and 21, and increases significantly in week 16.
North Europe In the North Europe-NAEC trade lane the weekly capacity increases significantly in week 10, and
- decreases drastically in week 16. In the NAEC-North Europe trade lane the weekly capacity 12.1%
North America East Coast decreases significantly in week 10 and 11, and increases drastically in week 12.
Mediterranean In the MED-NAEC trade lane the weekly capacity decreases significantly in week 13, and increases
- drastically in week 17. In the NAEC-MED trade lane the weekly capacity decreases drastically in -6.4%
North America East Coast week 18 and 20, and increases significantly in week 19.
In the Europe-NAWC trade lane the weekly capacity decreases significantly in week 10, 12, 13 and
Europe-
18, and increases drastically in week 19. In the NAWC-Europe trade lane the weekly capacity 41.0%
North America West Coast
increases significantly in week 16, and decreases drastically in week 17.
Sea Intelligence Last updated: 15/03 BIMONTHLY MARKET OUTLOOK 14THANK YOU
15You can also read