Weekly statistics for NHS Test and Trace (England) - 18 to 24 November 2021 Published 2 December 2021 - GOV.UK
←
→
Page content transcription
If your browser does not render page correctly, please read the page content below
Weekly statistics for NHS Test and
Trace (England)
18 to 24 November 2021
Published 2 December 2021

Weekly statistics for NHS Test and Trace (England): 18 to 24 November 2021

Contents
Main points................................................................................................................................... 3
Introduction .................................................................................................................................. 5
Revisions to figures previously published .................................................................................... 6
Publication update ....................................................................................................................... 6
1. NHS Test and Trace ................................................................................................................ 8
   1.1 Testing in England .............................................................................................................. 8
   1.2 Contact tracing in England ............................................................................................... 22
   1.3 Managed quarantine service (MQS) ................................................................................. 40
   1.4 Test and Trace Support Payments ................................................................................... 45
2. Terminology ........................................................................................................................... 47
   2.1 Testing.............................................................................................................................. 47
   2.2 Tracing ............................................................................................................................. 49
3. Measuring the data ................................................................................................................ 51
   3.1 How the data was collected .............................................................................................. 51
   3.2 Future development.......................................................................................................... 51
   3.3 Strengths and limitations .................................................................................................. 52
   3.4 Quality .............................................................................................................................. 52
   3.5 Feedback.......................................................................................................................... 53

                                                                       2
Weekly statistics for NHS Test and Trace (England): 18 to 24 November 2021

Main points
People tested, England:

•   268,245 people tested positive for coronavirus (COVID-19) at least once 1 between
    18 November and 24 November 2021 – an increase of 5.8% compared to the
    previous reporting week (11 November to 17 November)
•   4,780,848 people were tested at least once between 18 November and 24 November
    2021 for COVID-19 – an increase of 1.8% compared to the previous week

Pillar 2 testing turnaround times, England:

•   in the most recent week, 74.6% of in-person tests were received within 24 hours, an
    increase from 68.0% in the previous week
•   since the previous reporting week, the median turnaround time for home tests has
    decreased from 50 hours to 47 hours – the median turnaround time for satellite tests
    has also decreased from 40 hours to 38 hours

Distance to in-person testing sites for booked PCR tests, pillar 2, England:

•   in the latest week, the median distance to in-person testing sites (pillar 2) for booked
    PCR tests has remained unchanged at 2.3 miles.

Positive cases transferred to NHS Test and Trace:

•   255,953 cases were transferred to the contact tracing system between 18 November
    and 24 November 2021, an increase of 14.0% on the previous week
•   of the cases transferred to the contact tracing system between 18 November and 24
    November 2021, 88.4% were reached and asked to provide information about their
    recent close contacts – this is a decrease from the 89.1% observed in the previous
    week

Close contacts identified by NHS Test and Trace:

•   between 18 November and 24 November, 685,136 2 people were identified as coming into
    close contact with someone who had tested positive – the number of close contacts
    identified has increased by 12.8% from the previous week

1 Deduplicated for the reporting week. For information on how the number of people are tested and tested positive
in a reporting week is measured see the NHS Test and Trace statistics methodology.
2 The number of people identified includes duplicates as an individual may be named as a close contact for more

than 1 case. See NHS Test and Trace statistics methodology for more information.

                                                        3
Weekly statistics for NHS Test and Trace (England): 18 to 24 November 2021
• for those where communication details were available, 91.4% of close contacts were
reached and told to self-isolate in the most recent week – considering all contacts
identified, 86.1% were reached in the most recent week
Managed Quarantine Service (MQS):
MQS figures from Tables 19 and 20 are not updated past the week ending 29 September 2021
(see the Publication update section for details):
• in the week 23 September to 29 September 2021, 409,077 people started
quarantining at home and 3,133 people started quarantining in a managed
quarantine hotel
• between 11 February 2021 and 29 September 2021, 5,228,471 people started
quarantining at home or in a managed quarantine hotel
Test and Trace Support Payment Scheme (TTSP):
• as of 24 November 2021, local authorities have paid £184.8 million to 369,664
applicants since the start of the scheme
• over the previous week, local authorities reported payments of £3.4 million to 6,889
applicants
• in the last week, discretionary payments made up 44.6% of all TTSP
4Weekly statistics for NHS Test and Trace (England): 18 to 24 November 2021
Introduction
The UK Health Security Agency (UKHSA) publishes weekly statistics on NHS Test and Trace
(England) across all 4 testing pillars. The purpose of this publication is to provide a weekly
update on the implementation and performance of NHS Test and Trace in England.
For NHS Test and Trace (England), this includes:
• Testing:
- people tested for COVID-19
- people testing positive for COVID-19
- time taken for test results to become available
- distance to in-person test sites for booked PCR tests
• Contact Tracing:
- people transferred to the contact tracing system, and the time taken for them to
be reached
- close contacts identified, and the time taken for them to be reached
• Managed Quarantine Service (MQS):
- people quarantining at home or in a managed quarantine hotel
- number of PCR tests processed by international arrivals quarantining at home or
in a managed quarantine hotel and how many of these were positive
• Test and Trace Support Payments:
- number of payments and amount paid for successful TTSP claims, by week and
local authority
Data collected for NHS Test and Trace is primarily for operational purposes and was not
designed to track the spread of the virus. Studies into the spread of the virus in the UK are
carried out by the Office for National Statistics (ONS). Further guidance can be found in
comparing methods used in the COVID-19 Infection Survey and NHS Test and Trace, England.
A list of data sources relating to the COVID-19 pandemic in the UK can be found at COVID-19
statistics and analysis. A breakdown of all available testing and contact tracing data in the UK
can be found at Testing and contact tracing in the UK: summary of data. All data used in the
report can be found on the Weekly statistics for NHS Test and Trace page. A full explanation of
the data sources and methods used to produce these statistics can be found in the additional
methodology document for NHS Test and Trace statistics.
Data and methodology for the NHS COVID-19 app are available on the NHS COVID-19 app
support website.
5Weekly statistics for NHS Test and Trace (England): 18 to 24 November 2021
Revisions to figures previously published
Figures given in previous releases are routinely revised each week going back to the start of
Test and Trace for people tested for COVID-19, people testing positive for COVID-19, pillar 2
testing turnaround times, distance to in-person PCR test sites and contact tracing, to the start of
the managed quarantine service for people quarantining at home or in a managed quarantine
hotel, and to 15 February 2021 for number of PCR tests taken by international arrivals
quarantining at home or in a managed quarantine hotel. The figures presented are based on a
data cut several days after the end of the reporting period. This is to give time for data relating
to the end of the 7-day period to be collected. Some data may continue to be collected after this
period, and therefore may need to be revised over time.
Figures for pillar 1 testing turnaround times are not routinely revised as only minor changes
occur to past weeks post-publication. Figures are only revised when substantial changes occur.
More detail on routine revisions is given in the quality section.
Note that these routine revisions to data include the local authority level contact tracing data
that is made available on the weekly collection page. As past data is revised, subtracting figures
given in the previous week from figures given in the current week will not give the total number
of cases for that week.
For the release on 19 August 2021, the number of people starting their quarantine at home has
been revised. This is due to the introduction of private provider provision of amber fully
vaccinated services on 19 July 2021. This data can be found in Table 19 of the accompanying
data tables.
Publication update
This publication does not include information on the Omicron Variant of Concern. This data will
first appear in Table 21 of this report due to be published on 23 December 2021.
As noted in the report published on 25 November 2021, this report will not be published on 30
December 2021 (for the period covering 16 December to 22 December 2021) and 6 January
2022 (for the period covering 23 December to 29 December 2021). This is due to data delivery
and quality concerns anticipated over the Christmas and New Year reporting period. Normal
publication routine will resume on 13 January with the report including the previously unreported
3-week period to 5 January 2022.
From 4 October 2021, England’s new travel system came into effect with changes to the
Managed Quarantine Service (MQS), countries and territories are now categorised as either red
6Weekly statistics for NHS Test and Trace (England): 18 to 24 November 2021
list or the rest of the world. Eligible fully vaccinated passengers returning from countries and
territories not on the red list, can now do so without having to quarantine.
Figures from Tables 19 and 20 in the MQS section have not been updated past the week
ending 29 September 2021 as new statistics and tables are being developed to reflect change
in MQS policy that became effective on 4 October 2021.
We expect the number of individuals tested in Table 21 for the latest reporting period (4
November to 24 November) to be revised upwards when the table is updated on 23 December
2021 as more data on LFD tests by international arrivals become available.
7Weekly statistics for NHS Test and Trace (England): 18 to 24 November 2021
1. NHS Test and Trace
NHS Test and Trace was launched in England on 28 May 2020 and ensures that anyone who
develops symptoms of COVID-19 can quickly be tested to find out if they have the virus. It then
helps trace recent close contacts of anyone who tests positive for COVID-19 and, if necessary,
notifies them that they must self-isolate at home to help stop the spread of the virus. The flow of
how people move through the NHS Test and Trace service is shown in Figure 1. More
information about NHS Test and Trace can be found at NHS Test and Trace: how it works.
1.1 Testing in England
NHS Test and Trace starts with an individual taking a swab test for the virus, either in pillar 1
(testing in hospitals and outbreak locations), pillar 2 (national swab testing) or pillar 4
(prevalence studies). Those who go on to test positive will have their case transferred to NHS
Test and Trace for contact tracing.
From 30 March, individuals who test positive from an LFD test are asked to take a confirmatory
PCR test. A positive LFD result will continue to trigger contact tracing; however, NHS Test and
Trace has introduced improvements to automatically inform anyone self-isolating from a positive
LFD to stop isolating if the confirmatory PCR is taken promptly and is negative. These
individuals will then be removed from the contact tracing process.
Statistics in this section are given for England only. Weekly figures for UK testing are available
to download from the weekly collection page and are also available daily on the coronavirus in
the UK dashboard. Information on contact tracing in Scotland, Wales and Northern Ireland can
be found directly from Public Health Scotland, the Welsh government, and the Northern Ireland
Public Health Agency.
8Weekly statistics for NHS Test and Trace (England): 18 to 24 November 2021
Figure 1. Number of LFD tests conducted in education, by phase of education, England
9Weekly statistics for NHS Test and Trace (England): 18 to 24 November 2021
Figure 1 shows the journey a person can take through NHS Test and Trace. This can start with
either an LFD COVID-19 test, or a PCR COVID-19 test.
For those taking LFD tests, they can collect their test from their workplace, place of education,
pharmacy or local or mobile test site. They can also order an LFD test to be delivered to their
home. All people who test positive from an LFD are transferred to contact tracing, however if
their confirmatory PCR test result is negative, they and their contacts are removed from contact
tracing.
All those testing positive from an LFD test are instructed to take a confirmatory PCR test. In
addition, symptomatic individuals and some other use cases can directly book a PCR test
without taking an LFD test first. PCR tests may also be taken in hospital or outbreak locations or
as part of a prevalence study. Booked PCR tests can either be conducted at a regional test site,
local test site or mobile test unit; or a satellite or home test can be conducted. After tests have
been taken, they are sent to a laboratory for processing. Once processed, a person will be
emailed or texted their result.
If a person has a positive COVID-19 test result, then their case is transferred to NHS Test and
Trace and can be managed in 1 of 2 ways. First, cases that are not managed by local health
protection teams (HPTs) are reached either online or by a call centre. They are then asked to
provide details of recent close contacts. These recent close contacts are then reached by NHS
Test and Trace and advised to self-isolate. Second, cases that are linked to certain exposure
settings are escalated to local HPTs who work to identify and reach recent close contacts and
advise them to self-isolate.
Additionally, if the person has the app and used the app to book their test, their positive result is
updated automatically. If they have the app but booked their test via a different route, then they
can use a link to add their positive result to the app. Once their positive result is entered into the
app, the person is asked if they are willing to share their data and if they say yes, the app
identifies other app users who have been in close contact with the person who has tested
positive. Close contacts then receive an app notification to self-isolate.
People tested and people testing positive, England
The headline figures reported in this publication for people tested and people testing positive
include both lateral flow device (LFD) tests and polymerase chain reaction (PCR) tests,
deduplicated for each reporting week. 3 Information on the differences between these types of
tests can be found in the methodology document for NHS Test and Trace statistics.
3 Figures also include a small number of people tested using LAMP tests. See NHS Test and Trace statistics
methodology for more information.
10Weekly statistics for NHS Test and Trace (England): 18 to 24 November 2021
From 7 January 2021, positivity rate is not calculated as part of this publication but can instead
be found on the coronavirus in the UK dashboard for PCR only positive cases in England. This
is because the figures in this publication include both PCR and LFD tests and it is likely that
LFD tests have a different positivity rate to PCR tests due to the use of LFDs in rapid testing. As
the number of LFD tests conducted is increasing over time, a consistent positivity rate cannot
be calculated using these figures.
A statistical commentary on rapid testing in England along with data tables for the number of
tests conducted, broken down for LFD and PCR tests, is available on the weekly collection
page.
The number of people tested and number of people testing positive via PCR tests in each
reporting week, by age, gender and local authority is also available on the weekly collection
page.
Between 18 November and 24 November 2021, 4,780,848 people were tested for COVID-19 4 at
least once, a 1.8% increase since the previous week.
Figure 2 represents the trend in number of people tested for COVID-19 each reporting week by
pillar since Test and Trace began. The number of people tested increased week on week since
the start of reporting on 28 May 2020 until it reached its first peak in the week ending 17 March
2021 (6.2 million people tested). A further peak is seen in the week ending 8 September 2021
(6.4 million people tested).
The large increases and decreases in people tested since 8 March 2021 are due to the regular
testing of students at schools using rapid tests. These increases and decreases align with the
school calendar, with drops during holiday periods and subsequent increases when students
return to school.
For more information on rapid testing in schools, see the rapid testing commentary available on
the weekly collection page.
Since the launch of Test and Trace (28 May 2020 to 24 November 2021), 46,306,862 people
have been tested at least once. 5
4 Deduplicated for the reporting week, methodology was revised from 15 October 2020. See NHS Test and Trace
statistics methodology for more information.
5 Deduplicated since testing began and the end of the most recent reporting week. People tested multiple times in
this time period will only be counted once. See NHS Test and Trace statistics methodology for more information.
11Weekly statistics for NHS Test and Trace (England): 18 to 24 November 2021
Figure 2. Number of people tested for COVID-19 in each reporting week by pillar, England
This data can be found in the ‘table_1’ tab of the ‘NHS Test and Trace Statistics 28 May 2020 to 24 November 2021: data tables’ on
the Weekly Statistics for NHS Test and Trace page.
12Weekly statistics for NHS Test and Trace (England): 18 to 24 November 2021
Between 18 November and 24 November 2021, 268,245 people tested positive, a 5.8%
increase from the previous week.
Figure 3 represents the trend in number of people testing positive for COVID-19 each reporting
week by pillar since Test and Trace began. The number of positive cases increased from
August 2020 until it reached its highest peak week ending 6 January 2021 (390,286 people
tested positive). It then declined week by week, reaching a trough in the week ending 5 May
2021 (13,455 people tested positive), before increasing again to the next peak in the week
ending 21 July 2021 (309,503 people tested positive). The number of positive cases had been
on the rise since week ending 15 September 2021, reaching a recent peak in the week ending
20 October 2021 (299,292). The number of positive cases has since declined to 216,575
positive cases in the week ending 10 November 2021 followed by an increase week on week to
up to the current reporting week ending 24 November 2021 (268,245 people tested positive).
13Weekly statistics for NHS Test and Trace (England): 18 to 24 November 2021
Figure 3. Number of people testing positive for COVID-19 in each reporting week by pillar, England
This data can be found in the ‘table_1’ tab of the ‘NHS Test and Trace Statistics 28 May 2020 to 24 November 2021: data tables’ on
the Weekly Statistics for NHS Test and Trace page.
14Weekly statistics for NHS Test and Trace (England): 18 to 24 November 2021
Pillar 1 testing turnaround times, England
Pillar 1 testing refers to swab testing for the virus in UK Health Security Agency (UKHSA) labs
and NHS hospitals for those with a clinical need, and health and care workers.
Since some pillar 1 tests are conducted in a hospital setting, it is not practical for those
administering the tests to record the exact time that a test was taken. Therefore, the time taken
to receive a COVID-19 test result is measured from the time that a test is received by a
laboratory for processing to the time when the results are published to the Laboratory
Information Management System (LIMS).
This data is only available from 9 July 2020 due to differences in the reporting methodologies
between UKHSA labs. More details can be found in the NHS Test and Trace statistics
methodology.
In the latest week, over 19 out of 20 pillar 1 test results were made available within 24 hours
of the laboratory receiving the test.
Between 18 November and 24 November 2021, 97.3% of pillar 1 test results were made
available within 24 hours. Turnaround times for pillar 1 have been above 95% since the week
ending 27 January. Since reporting began, 94.5% of test results have been made available
within 24 hours.
Pillar 2 testing turnaround times, England
There are various routes for getting tested within pillar 2 (national swab testing) which has an
impact on turnaround times. 6 Data on the time taken to receive a COVID-19 test result for pillar
2 is split up to reflect this. These routes include:
1. In-person tests
These involve a person being tested in-person at a COVID-19 test site and include:
• regional test sites, which includes drive-through testing centres
• local test sites7, which are similar to regional test sites but specifically for walk ups
• mobile testing units, which travel around the UK to increase access to COVID-19 testing;
they respond to need, travelling to test people at specific sites including care homes, police
stations and prisons
6 For all measures of time taken to receive a COVID-19 test result, there are a number of tests that were not
completed. This covers any test where the results were not communicated, which may be because
communication details (for example, phone number or email address) were not provided or were incorrect, or
because the test was cancelled or abandoned, or no result was available. It also includes some tests which are
still being processed.
15Weekly statistics for NHS Test and Trace (England): 18 to 24 November 2021
2. Satellite test centres
These include test kits provided directly to ‘satellite’ centres at places such as care homes that
have a particularly urgent or significant need
3. Home test kits
These are delivered to someone’s door so they can test themselves and their family without
leaving the house.
A lower proportion of home and satellite test results will be available within 24 hours of the test
being taken compared to in-person tests due to differences in testing schedules and delivery of
tests. Therefore, the percentage of test results received within 24 hours for in-person tests and
the percentage of test results received within 48 hours for home and satellite tests are
presented in this bulletin. The accompanying data tables contain all turnaround time windows
for all testing routes.
There are normal fluctuations in this operational process which can sometimes cause the time
taken to receive a test result to go over 24 hours, but still be turned around the next day.
Therefore, we also provide the percentage of tests turned around the day after a test was taken
where appropriate. The median turnaround times are also given as an indication of the average
time taken.
Turnaround times are measured and reported in 2 ways:
• time from booking a test to receive a test result
• time from taking a test to receive a test result
All figures presented in this bulletin relate to time from taking a test. Both measures are
available in full in the accompanying data tables. More information on these definitions is in the
terminology section and the NHS Test and Trace statistics methodology.
Lateral flow device (LFD) tests are not included in this section on turnaround times as they do
not require processing in a lab.
For the current reporting week, the median time taken to receive a test result from taking a test
has remained the same for regional and local routes compared to the previous week, and has
decreased for mobile, satellite and home test kit routes.
Table 1. Median time taken (hours) to receive test result, by route, England
Median time taken Previous Current Since Test and Trace
(hours) to receive reporting reporting launched: 28 May 2020 to
test result week week 24 November 2021
Regional test sites 20 20 21
16Weekly statistics for NHS Test and Trace (England): 18 to 24 November 2021
Median time taken Previous Current Since Test and Trace
(hours) to receive reporting reporting launched: 28 May 2020 to
test result week week 24 November 2021
Local test sites 21 21 22
Mobile testing units 20 19 20
Satellite test centres 40 38 39
Home testing kits 50 47 44
Figure 4 below represents the median time to receive test results from taking a test. The graph
includes a comparison between different testing routes, which include Home Test Kits, Satellite
Test Centre, Mobile Testing Units, Local Test Sites and Regional Test Sites. For more
information, please see Table 1 above, containing median times for recent test results.
17Weekly statistics for NHS Test and Trace (England): 18 to 24 November 2021
Figure 4. Median time (hours) from taking a test to receiving test results by route, England
This data can be found in the ‘table_8’ tab of the ‘NHS Test and Trace statistics 28 May 2020 to 24 November 2021: data tables’ on the
Weekly Statistics for NHS Test and Trace page.
18Weekly statistics for NHS Test and Trace (England): 18 to 24 November 2021
In the latest week, the percentage of test results received within 24 hours for in-person tests
has increased. The percentage within 48 hours for home testing kits and satellite test centres
has also increased.
In the most recent week, 74.6% of in-person test results were received within 24 hours, an
increase from 68.0% in the previous week (96.0% of in-person tests were received the next day
after the test was taken).
In the most recent week, 58.8% of test results were received within 48 hours for home test kits
and satellite test centres, compared to 54.2% in the previous week. For satellite test centres,
88.8% were received within 72 hours, an increase from 81.6% in the previous week.
For all routes combined, 42.6% of tests from all test sites were received within 24 hours of a test
being taken compared to 38.8% in the previous week.
Table 2. Percentage of results received within 24 hours (in-person tests) or within 48
hours (home and satellite tests), by route, England
Percentage of results received within Previous Current Since Test and Trace
24 hours (in-person tests) or within 48 reporting reporting launched: 28 May 2020
hours (home and satellite tests) week week to 24 November 2021
Regional test sites within 24 hours 68.2 77.2 61.8
Local test sites within 24 hours 65.5 68.9 61.0
Mobile testing units within 24 hours 71.6 80.3 66.9
Satellite test centres within 48 hours 58.4 64.3 64.2
Home testing kits within 48 hours 46.4 49.3 55.3
Distance to in-person testing sites for booked PCR tests, pillar 2,
England
The distance to testing sites for booked PCR tests is calculated as the direct distance between
the approximate centre of a person’s postal district and their chosen test location in straight line.
This is reported as the median and associated percentiles for those who successfully booked a
test at regional test sites, local test sites and mobile testing units in the latest week. More
information is available in the NHS Test and Trace statistics methodology.
The median distance to in-person PCR testing sites for booked tests has remained the same as
the previous week.
19Weekly statistics for NHS Test and Trace (England): 18 to 24 November 2021
Between 18 November and 24 November 2021, the median distance to an in-person PCR test
site has remained unchanged at 2.3 miles. This has been broadly consistent since the week
ending 14 July 2021.
In the latest week 90% of people who booked a test at a test centre lived 9.8 miles or less away.
Figure 5 below represents the median distance to testing sites for tests booked at in-person
PCR test sites. The graph includes a comparison between in-person different testing routes,
which include Mobile Testing Units, Local Test Sites and Regional Test Sites. Median distance
for all in-person routes peaked between August 2020 to September 2020 and have since
reduced overall.
20Weekly statistics for NHS Test and Trace (England): 18 to 24 November 2021
Figure 5. Median distance (miles) to testing sites for tests booked at an in-person PCR test site by route, England
This data can be found in the ‘table_9’ tab of the ‘NHS Test and Trace statistics 28 May 2020 to 24 November 2021: data tables’ on the
Weekly Statistics for NHS Test and Trace page.
21Weekly statistics for NHS Test and Trace (England): 18 to 24 November 2021
1.2 Contact tracing in England
Once a person has a positive test result for COVID-19 8, this person is transferred to NHS Test
and Trace and a case is opened for them. The number of positive cases transferred to the
contact tracing system may not always align with the number of people testing positive for
COVID-19. There are several reasons for this which are outlined in the information for users
document.
Positive cases and their contacts which are linked to potential outbreaks in specific settings are
handled by UKHSA local health protection teams (HPTs). These cases and contacts, previously
known as complex, have been referred to as ‘cases and contacts managed by local HPTs’ since
29 October 2020. Furthermore, cases and contacts managed nationally either online or by call
centres, previously known as non-complex, are referred to as ‘cases and contacts not managed
by local HPTs’.
From 18 March 2021, only outbreaks in care homes are handled by HPTs. Further information
is available in the NHS Test and Trace statistics methodology.
Positive cases transferred to NHS Test and Trace
The number of positive cases transferred to NHS Test and Trace has increased to 255,953 in
the latest week.
In the most recent week, 255,953 cases were transferred to the contact tracing system, a 14.0%
increase on the previous week.
In the most recent week, over 8 in every 10 cases transferred to the contact tracing system
were reached and asked to provide information about their contacts.
Out of the cases transferred to the contact tracing system in the latest week, 226,146 (88.4%)
were reached, 29,266 (11.4%) were not reached and 541 (0.2%) had no communication details
provided. Since Test and Trace launched, 87.5% of all cases have been reached.
In the latest week, 576 cases reached and asked to provide details of close contacts were
managed by local health protection teams (HPTs), whereas 225,570 cases were community-
wide cases and, therefore, not managed by local HPTs.
8 All confirmed positive test results under pillar 1 and pillar 2 should be transferred. In addition, all positive virus
test results as part of prevalence studies (pillar 4) are also transferred to Test and Trace. People tested under
pillar 3 (serology testing to show if people have antibodies from having had COVID-19) do not have their cases
transferred to NHS Test and Trace.
22Weekly statistics for NHS Test and Trace (England): 18 to 24 November 2021
For cases managed by local HPTs, their contacts are often managed at a situation rather than
individual level, with advice being issued to the contact institution. Therefore, cases who were
managed by local HPTs may not have been individually reached and asked to provide details of
their recent close contacts. However, the cases and contacts will have been successfully dealt
with as a whole.
For more information on the different ways of managing cases and the outcomes of contact
tracing see the terminology section.
Figure 6 below represents the number of cases transferred to contact tracing and the number
that were reached and asked to provide details of recent contacts in England. Both cases
transferred and those reached peaked in week ending 6 January 2021 (388,150 cases
transferred and 341,704 reached), and then declined week by week until May 2021. They
peaked again in week ending 21 July 2021 (295,313 cases transferred and 252,475 cases
reached). More recently, cases transferred peaked in week ending 20 October 2021 (274,496
cases transferred and 248,021 cases reached).
23Weekly statistics for NHS Test and Trace (England): 18 to 24 November 2021
Figure 6. Number of cases transferred to the contact tracing system and number of cases transferred who were reached and
asked to provide details of recent close contacts (includes cases managed and not managed by local HPTs), England
This data can be found in the ‘table_10’ tab of the ‘NHS Test and Trace statistics 28 May 2020 to 24 November 2021: data tables’ On the
Weekly Statistics for NHS Test and Trace page.
24Weekly statistics for NHS Test and Trace (England): 18 to 24 November 2021
Table 3. Cases transferred to the contact tracing system (includes cases managed and
not managed by local HPTs) by whether they were reached and asked to provide
contact details, England 9
Cases transferred to Previous Current Since Test and Trace
contract tracing reporting week reporting week launched: 28 May 2020
system to 24 November 2021
People who were 200,159 (89.1%) 226,146 (88.4%) 7,434,710 (87.5%)
reached and asked to
provide details of recent
close contacts
People who were not 23,397 (10.4%) 29,266 (11.4%) 989,611 (11.7%)
reached
People whose 982 (0.4%) 541 (0.2%) 67,677 (0.8%)
communication details
were not provided
Total 224,538 255,953 8,491,998
9If NHS Test and Trace is not able to reach an individual testing positive or if no communication details are
available, then it is not always possible to know if the case should be managed by a local HPT or not.
Therefore, these breakdowns are not available.
25Weekly statistics for NHS Test and Trace (England): 18 to 24 November 2021
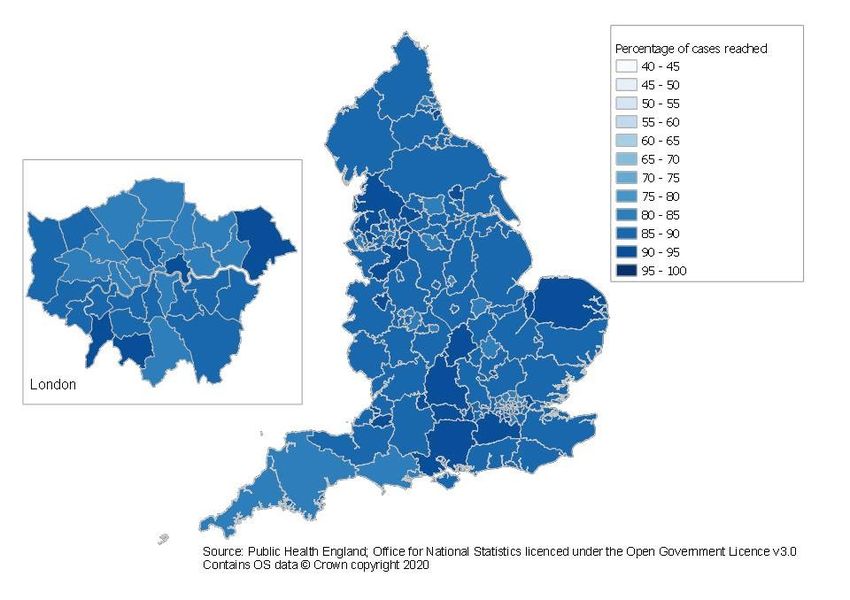
Figure 7. Proportion of cases reached and asked to provide details of recent close contacts by upper-tier local authority (UTLA)
since Test and Trace began
This data is available as an interactive map and to download as a csv on the Weekly Statistics for NHS Test and Trace page. The
regional data uses a different data cut to the main publication therefore cumulative totals will not exactly match. The data is available for
the cumulative figures since Test and Trace launched up to the most recent week of reporting. Due to revisions that occur each week on
week’s cumulative figures cannot be subtracted from a previous week to obtain weekly data by UTLA.
26Weekly statistics for NHS Test and Trace (England): 18 to 24 November 2021
In the latest week, over 8 in every 10 people who were reached and asked to provide
information about their contacts, provided 1 or more close contacts.
Out of the 226,146 people reached between 18 November and 24 November 2021, 182,035
(80.5%) provided details of one or more close contacts. This is an increase in the number of
people who provided details of one or more close contacts from the previous week, where
80.1% of people reached provided details of one or more contacts.
The number who were not able to give any recent close contacts refers to people who were
successfully reached by NHS Test and Trace, but either had no recent close contacts or could
not provide details of close recent contacts to pass on for further contact tracing (for example,
recent close contact with strangers on the bus).
Figure 8 represents the proportions of people transferred to contact tracing and asked to
provide details of recent closed contacts, by whether they provided details or not. The
proportion that provided details has fluctuated since Test and Trace launched and has
averaged 79.1%.
27Weekly statistics for NHS Test and Trace (England): 18 to 24 November 2021
Figure 8. Proportion of people transferred to the contact tracing system (includes cases managed and not managed by local
HPTs) who were reached and asked to provide details of recent close contacts by whether they provided details for contacts or
not, England
This data can be found in the ‘table_11’ tab of the ‘NHS Test and Trace statistics 28 May 2020 to 24 November 2021: data tables’ on the
Weekly Statistics for NHS Test and Trace page.
28Weekly statistics for NHS Test and Trace (England): 18 to 24 November 2021
Close contacts identified by NHS Test and Trace
In the most recent week, 685,136 close contacts were identified, an increase of 12.8% since
the previous week.
In the latest week, 685,136 people 10 were identified as recent close contacts, of which 683,333
(99.7%) were not managed by local HPTs and 1,803 (0.3%) were managed by local HPTs.
Considering only the contacts where communication details were provided, 91.4% were
reached and told to self-isolate in the most recent week. This is an increase from the 90.9%
observed in the previous week.
From 18 November 2020, there has been a change in how household contacts under 18 are
reached. These changes mean that under-18s in a household are no longer contact traced
individually, providing the parent or guardian in the household confirms they have completed
their legal duty to inform their child to self-isolate. From 27 November 2020, this change was
also extended to cover adults in the same household, so they have the option to be traced via
a single phone call.
Figure 9 represents the number of recent close contacts identified (transferred) in England and
includes the number that were reached. The numbers of close contacts identified and reached
peaked in week ending 6 January 2021 (737,044 identified and 683,366 reached) and then
declined week on week until the trough at week ending 19 May 2021 (40,029 identified and
34,453 reached). After this point numbers increased up until the week ending 20 October 2021
(776,801 transferred and 674,998 reached). Close contacts identified and reached decreased
from week ending 20 October 2021, however has increased week-on-week for the past 3
reporting weeks.
The number of people identified includes duplicates as an individual may be named as a close contact for
10
more than one case. See the NHS Test and Trace statistics methodology for more information.
29Weekly statistics for NHS Test and Trace (England): 18 to 24 November 2021
Figure 9. Number of recent close contacts identified, England
This data can be found in the ‘table_13’ tab in ‘NHS Test and Trace statistics 28 May 2020 to 24 November 2021: data tables’ On the
Weekly Statistics for NHS Test and Trace page.
30Weekly statistics for NHS Test and Trace (England): 18 to 24 November 2021
86.1% of contacts not managed by local HPTs were reached and told to self-isolate in the latest
week.
In the latest week, 683,333 recent close contacts not managed by local HPTs were identified, of
which 588,159 (86.1%) were reached and told to self-isolate. In the latest week, 55,799 (8.2%)
contacts not managed by local HPTs were not reached and 39,375 (5.8%) people had no
communication details. For more information on the different outcomes of contact tracing, see
the Terminology section.
100.0% of contacts managed by local HPTs were reached and told to self-isolate.
In the latest week, 1,803 close contacts were identified who were managed by local HPTs, of
which all were reached and told to self-isolate. Since Test and Trace launched, 98.0% of all
contacts managed by local HPTs have been reached.
For contacts managed by local HPTs, contacts are managed as a whole setting and are often
managed at a situation rather than individual level, with advice being issued to the contact
institution. Therefore, these contacts may not have been individually reached and told to self-
isolate but should have received this advice from their institution. For this reason, contacts
managed by local HPTs have a higher success rate compared with community wide contacts
not managed by local HPTs.
Contacts managed by local HPTs are reached when the situation has been dealt with and
advice has been issued to the institution, whereas contacts not managed by local HPTs must be
individually contact traced (unless they are a household contact) to be classified as reached.
Figure 10 represents the proportion of contacts reached and told to self-isolate, split by those
managed by local HPTs and those not managed by local HPTs. There is an increase in
proportion reached for those not managed by local HPTs aligning with an operational change on
18 November 2020 relating to how contacts under 18 are contacted.
31Weekly statistics for NHS Test and Trace (England): 18 to 24 November 2021
Figure 10. Proportion of contacts reached and told to self-isolate, England
This data can be found in the ‘table_13’ tab of the ‘NHS Test and Trace statistics 28 May 2020 to 24 November 2021: data tables’ on the
Weekly Statistics for NHS Test and Trace page.
32Weekly statistics for NHS Test and Trace (England): 18 to 24 November 2021
Figure 11. Proportion of close contacts identified not managed by local HPTs who were reached and told to self-isolate by
upper-tier local authority (UTLA)
This data is available as an interactive map or to download as a csv on the Weekly Statistics for NHS Test and Trace page. The regional
data uses a different data cut to the main publication therefore cumulative totals will not exactly match. The data is available
for the cumulative figures since Test and Trace launched up to the most recent week of reporting. Due to revisions that occur each week
on week’s cumulative figures cannot be subtracted from a previous week to obtain weekly data by UTLA.
33Weekly statistics for NHS Test and Trace (England): 18 to 24 November 2021
In the most recent week, over 6 in every 10 contacts not managed by local HPTs were from the
same household as the case they were identified from.
Contacts identified not managed by local HPTs that are household contacts have increased
from 62.2% to 64.8% in the latest week.
In the latest week, 96.5% of contacts identified and not managed by local HPTs who were
household contacts were successfully reached and told to self-isolate. This has increased from
96.4% in the previous week.
Meanwhile, 66.9% of contacts who were from a different household to the case from which they
were identified were successfully reached and told to self-isolate; a decrease from 67.1% in the
previous week.
Figure 12 represents the proportion of recent close contacts in England not managed by local
HPTs that were household contacts versus those that were not household contacts.
34Weekly statistics for NHS Test and Trace (England): 18 to 24 November 2021
Figure 12. Proportion of recent close contacts not managed by local HPTs by whether they were from the same household as
the case that they were identified from, England
This data can be found in the ‘table_14’ tab of the ‘NHS Test and Trace statistics 28 May 2020 to 24 November: data tables’ on the
Weekly Statistics for NHS Test and Trace page.
35Weekly statistics for NHS Test and Trace (England): 18 to 24 November 2021
NHS Test and Trace end to end timing metrics
For contacts not managed by local HPTs who were told to self-isolate, over 8 out of 10 were
reached within 3 days of the case that reported them taking their test.
In the latest week, 505,589 (86.4%) contacts that were reached and told to self-isolate were
reached within 3 days of the case that reported them taking a test which subsequently returned
a positive result. This is a decrease from 89.8% in the previous week.
Figure 13 represents the proportion of recent close contacts in England who were told to self-
isolate within 3 days of the case taking a test, excluding those managed by HPTs. There is an
increase in proportion told to self-isolate within 3 days between October 2020 and December
2020, which aligns with an operational change relating to how under 18s are contacted.
36Weekly statistics for NHS Test and Trace (England): 18 to 24 November 2021
Figure 13. Proportion of recent close contacts who were told to self-isolate within 3 days of the case taking a test (excludes
cases managed by local HPTs), England
This data can be found in the ‘table_17’ tab in the ‘NHS Test and Trace statistics 28 May 2020 to 24 November 2021: data tables’ on the
Weekly Statistics for NHS Test and Trace page.
37Weekly statistics for NHS Test and Trace (England): 18 to 24 November 2021
The number of contacts who were reached within 3 days of the cases that identified them taking a
test is an end-to-end measure, and therefore is comprised of several subsidiary measures. Table 4
provides the timing metrics from when a case is transferred into the contact tracing system.
Table 4. Contact tracing timing metrics, England
Contract tracing timing metrics Previous Current Since Test and Trace
reporting reporting launched: 28 May 2020
week week to 24 November 2021
Percentage of cases not managed by 84.1% 83.1% 77.7%
local HPTs reached and asked to provide
details about close contacts within 24
hours of their case being transferred to
contact tracing
Percentage of contacts not managed by 97.1% 97.4% 95.3%
local HPTs who were told to self-isolate
who were reached within 24 hours of
being identified
Percentage of contacts not managed by 70.9% 70.9% 69.0%
local HPTs who were told to self-isolate
who were reached within 24 hours of the
case that reported them being
transferred to the contact tracing system
Note that because the timing statistics given in Table 4 are from when a case was transferred to
the contact tracing system, delays in transferring cases to contact tracing will not be captured.
However, they will be captured in the full end to end measure from when the test was taken.
The median time taken for contacts to be reached from the case that identified them first
reporting symptoms has increased to 80 hours in the most recent week from 77 hours in the
previous week.
Please note this data only includes contacts reported by cases who reported to experience at
least one symptom. This data is collected by asking symptomatic people who tested positive
and were subsequently reached by NHS Test and Trace to recall which day they first observed
COVID-19 symptoms. More information is available in the NHS Test and Trace statistics
methodology.
Figure 14 represents the median time from symptom onset to contact reached in England,
excluding those managed by local HPTs. The median time peaked at 142 hours in week ending
7 October 2020 and was then on a declining trend until week ending February 2021. Since 3
February 2021, the median time has stayed broadly consistent other than a spike in the week
ending 10 November 2021.
38Weekly statistics for NHS Test and Trace (England): 18 to 24 November 2021
Figure 14. Median time from case first reporting symptoms to contact reached (excludes cases managed by local HPTs), England
This data can be found in the ‘table_18 tab in the ‘NHS Test and Trace statistics 28 May 2020 to 24 November 2021: data tables’ on the
Weekly Statistics for NHS Test and Trace page.
39Weekly statistics for NHS Test and Trace (England): 18 to 24 November 2021
1.3 Managed quarantine service (MQS)11
Background on the service
This publication does not include information on the Omicron Variant of Concern. This data will
first appear in Table 21 of this report due to be published on 23 December 2021.
Between 15 February 2021 and 3 October 2021, individuals allowed to enter England from an
amber or red listed country or territory were required to quarantine for 10 days and take a PCR
test on or before day 2 and on or after day 8 of quarantining as part of the Managed Quarantine
Service (MQS).
People arriving in England who had visited or passed through a country and territory where
travel to the UK is banned (red list countries and territories) were required to quarantine in a
managed quarantine hotels. Only British or Irish Nationals or people with residence rights in the
UK were allowed to do this. People arriving from amber list countries and territories were
required to quarantine at home.
Under the traffic light framework set out on 9 April 2021 (effective between 17 May 2021 and 3
October 2021), those returning to England from green list countries and territories were not
required to quarantine and only had to present a negative pre-departure test taken within 72
hours before departure, as well as a PCR test on or before day 2 of their arrival in England.
A country or territory was designated green, amber or red following a ministerial decision-
making process. Designations of countries and territories are published by the Department for
Transport and are reviewed on a regular basis. Therefore, they are subject to change and the
data released will reflect the lists as they were on the date of release. For more detail see
guidance on entering the UK.
A full explanation of the data sources and methods used to produce these statistics can be
found in the NHS Test and Trace statistics methodology.
From 4 October 2021, England’s new travel system came into effect with changes to MQS,
countries and territories are now categorised as either red list or the rest of the world. Eligible
fully vaccinated passengers returning from countries and territories not on the red list, can now
do so without having to quarantine.
Statistics based on the new arrival policy are being reviewed as part of on-going development to
this publication. Until the review has been completed no new MQS statistics will be provided.
11 Figures and tables in this section have not been updated past the week ending 29 September 2021 as new
statistics and tables are being developed to reflect change in MQS policy that became effective on 4 October
2021.
40Weekly statistics for NHS Test and Trace (England): 18 to 24 November 2021
People starting quarantine
Between 11 February 2021, when MQS launched, and 29 September 2021, 5,228,471 people
started quarantining at home or in a managed quarantine hotel. Between 23 September and 29
September 2021, 412,210 people started quarantining, compared to 414,799 in the previous
week (16 September 2021 to 22 September 2021).
Between 23 September and 29 September 2021, the number of people starting their quarantine
period at home decreased from 410,333 to 409,077. The number of people starting their
quarantine in a hotel decreased from 4,466 to 3,133 in that week.
Since 10 March 2021, international arrivals from amber list countries and territories have had
the option to book their quarantine package through a private provider. As of the publication on
8 July 2021, these figures are now included in the data. The proportion of quarantine packages
that are purchased through a private provider has been steadily rising since its introduction and
since week ending 26 May, private bookings now account for the vast majority of home
quarantine packages booked. For more information, see the NHS Test and Trace statistics
methodology.
From 4 October 2021, England’s new travel system came into effect with countries and
territories categorised as either red or the rest of the world. Eligible fully vaccinated passengers
returning from countries and territories not on the red list, can now do so without having to
quarantine.
Statistics based on the new policy are being reviewed as part of on-going development to this
publication.
Table 5. Number of people starting their quarantine at home or in a managed quarantine
hotel, England
People starting their 16 September 2021 23 September 2021 Since MQS launched.
quarantine to 22 September to 29 September: 15 February to 29
2021: number of number of people September 2021:
people starting starting quarantine number of people
quarantine starting quarantine
People starting 410,333 409,077 5,025,111
quarantine at home
People starting 4,466 3,133 203,360
quarantine in a
managed quarantine
hotel
Total 414,799 412,210 5,228,471
41Weekly statistics for NHS Test and Trace (England): 18 to 24 November 2021
People taking tests
Between 23 September and 29 September 2021, 450,388 registered and processed tests have
been taken by people quarantining at home and 7,094 registered and processed tests have
been taken by people quarantining in a managed quarantine hotel. International arrivals who
are quarantining at home have the option to book their PCR tests through a private provider.
From the publication on 8 July onward, these tests are now included in the totals, and account
for almost all of PCR tests taken by people quarantining at home.
The number of tests registered and processed each week will not be the same as the number of
people quarantining in that same week for several reasons:
• the cohort of people starting their quarantine will not be the same cohort of people
who take their day 2 test in a given week – for example, people starting their
quarantine towards the end of the week will have their day 2 tests fall into the
following week
• there may be differences in the population quarantining and those who are
required to take a test, for example children under 5 do not need to take a test
• passengers with a positive test on day 2 are not required to take a day 8 test
• correct completion and return of test data are required by the person taking the
test to ensure that tests are correctly registered
Table 6. Number of registered and processed PCR tests taken by people quarantining
at home, England
Registered and 16 September 2021 23 September 2021 Total 25 March to
processed PCR tests to 22 September to 29 September 29 September
taken by people 2021: number of 2021: number of 2021: number of
quarantining at home tests processed tests processed tests processed
and registered and registered and registered
Day 2 – Quarantining 391,676 379,787 4,534,773
at home (amber list
arrivals)
Day 8 – Quarantining 46,949 49,877 1,576,709
at home (amber list
arrivals)
Day 5 – Quarantining 21,017 20,724 519,266
at home (amber list
arrivals)
Test to Release
42Weekly statistics for NHS Test and Trace (England): 18 to 24 November 2021
Registered and 16 September 2021 23 September 2021 Total 25 March to
processed PCR tests to 22 September to 29 September 29 September
taken by people 2021: number of 2021: number of 2021: number of
quarantining at home tests processed tests processed tests processed
and registered and registered and registered
Total registered tests 459,642 450,388 6,630,748
processed (amber list
arrivals)
Table 7. Number of registered and processed PCR taken by people quarantining at a
managed quarantine hotel, England
Registered and 16 September 2021 23 September 2021 Total 25 March to
processed PCR taken to 22 September to 29 September 29 September
by people 2021: number of 2021: number of 2021: number of
quarantining at a tests processed tests processed tests processed
managed quarantine and registered and registered and registered
hotel
Day 2 – Quarantining 6,174 3,850 219,736
at managed quarantine
hotel (red list arrivals)
Day 8 – Quarantining 5,021 3,244 144,428
at managed quarantine
hotel (red list arrivals)
Total registered tests 11,195 7,094 364,164
processed (red list
arrivals)
The total number of PCR tests processed for passengers at home includes tests not registered
to an individual. The full breakdown of tests registered and not registered across day 2 and day
8 for people quarantining at home can be found in ‘Table 20’ of the accompanying data tables.
The total number of PCR tests processed for passengers in a hotel only includes the number of
tests that have been correctly registered. Evidence of negative tests or an extended stay
following a positive test must be presented by passengers in hotels before they are able to
leave.
When countries are moved on to the red list, an increase in passenger numbers in hotels may
be seen. This will be reflected in an increase in day 2 tests. These passengers may not have
had a day 8 test in the same reporting period.
43Weekly statistics for NHS Test and Trace (England): 18 to 24 November 2021
People quarantining in England at home can end their quarantine early through the test to
release scheme. This lets people choose to pay for a private COVID-19 test where it meets the
minimum testing standards after they have been in England for 5 full days. If the results of the
test are negative, quarantine can be ended. If positive, quarantine should be extended for 10
days after taking the test. The private tests booked through this scheme are in addition to the
day 2 and day 8 tests booked as part of the managed quarantine service. This data is now
available in Table 20 of the accompanying data tables.
Between 23 September and 29 September 2021, arrivals from Amber-listed countries, 2,213
(0.6%) Day 2 tests on Amber arrivals were positive, compared to 270 (0.5%) Day 8 tests and 83
(0.4%) Test to Release tests.
For arrivals from Red-listed countries, 18 (0.5%) Day 2 tests processed were positive compared
to 46 (0.7%) in the previous week, while 6 (0.2%) Day 8 tests were positive compared to 20
(0.4%) in the previous week.
Day 2 tests by people quarantining at home saw the highest proportion of positive tests in the
reporting week, with 0.6% of tests processed returning a positive result.
Risk assessment status, people tested, positivity and variants by
country and territory
Countries and territories are risk assessed based on data from a number of sources to
determine whether they should be added to the list of countries and territories requiring
quarantine at a managed quarantine hotel upon return (red list countries and territories), or at-
home quarantining (amber list countries and territories). For more information on these
decisions, please see the COVID-19 risk assessment methodology document.
Passengers are asked to report their recent travel history when returning to the UK so that the
number of positive test results taken while under managed quarantine, as well as the number of
VOCs and VUIs sequenced from these positive tests, can be considered when assessing the
risk of travel and whether countries and territories should be assigned to the red list.
Data for risk assessment status, testing, positivity and variants by country or territory can be
found in the ‘table 21’ tab of the accompanying data tables. While the other managed
quarantine service data tables will be updated weekly, Table 21 will be updated every 3 weeks
following this publication and will consider a 3-week reference period. This will align the data
with the UKHSA assessments of the latest data, which are also conducted every 3 weeks. All
weeks will be covered by the data.
44You can also read