True pandemic state and a lack of capacity of hospitals and mechanical ventilations in Slovakia during the SARS-COV-2 pandemic wave in August 2020 ...
←
→
Page content transcription
If your browser does not render page correctly, please read the page content below
True pandemic state and a lack of capacity of hospitals and mechanical
ventilations in Slovakia during the SARS-COV-2 pandemic wave in August 2020 -
                                     May 2021
                                                       Richard Kollár
                                       Department of Applied Mathematics and Statistics
                             Faculty of Mathematics, Physics and Informatics, Comenius University
                                          Mlynská dolina, 84248 Bratislava, Slovakia

                                                           Katarína Boďová
                                Department of Mathematical Analysis and Numerical Mathematics
                             Faculty of Mathematics, Physics and Informatics, Comenius University
                                             Mlynská dolina, 84248 Bratislava, Slovakia
Abstract. During the second SARS-COV-2 pandemic wave in
Slovakia (August 2020 - June 2021) reported data did not
capture real health care demand and the capacity of hospitals       1 Introduction
and mechanical ventilations for COVID-19 patients was
exceeded. Real time quantitative polymerase chain reaction          1.1 Uncertainty in epidemic data
(RT-qPCR) and lateral flow antigen (LFAg) test incidences
were strongly biased due to a variation of the total volume of        Reliable data are critical for monitoring of epidemic
tests administered and sample selection. Also, confirmation of      dynamics and for decision making on public health
COVID-19 related deaths was often significantly delayed.            policies. Despite a vast amount of data on SARS-CoV-2
Available data thus failed to characterize the true extent of the   pandemics there is a large degree of uncertainty in all types
pandemics. To fill this gap we perform a retrospective analysis     of epidemic data including infection incidence, number of
of the time series of epidemic indicators and estimate              hospitalized patients with COVID-19 and number of
dynamics of the true pandemic state in Slovakia during the          COVID-19 related deaths.
pandemic wave. We estimate that on average approximately
20.0% more hospital beds and 19.2% more mechanical                    The sources of uncertainty in the data are diverse:
ventilators were needed in hospitals than reported bed              observed incidence measured by testing programs is limited
occupancy in Slovakia during the period November 2020 -             by sample size, sample bias, and test parameters,
March 2021. Our estimates rely on a linear relationship             hospitalization data are subject to limited bed, equipment,
between total adjusted incidence in a form of weighted linear       and personnel capacities, particularly during epidemic
combination of RT-qPCR and LFAg incidences and                      peaks, and data on COVID-19 related deaths are limited by
hospitalizations data lagged by 8 days. The linear relationship     methodological issues including sample bias and staff
systematically emerges before and after the epidemic peak and       shortage during the epidemic peaks [1-4]. All data are
the real epidemic state is estimated by a projection of the         furthermore subject to (often significant) delays in
observed data on the corresponding linear manifold. The
                                                                    reporting [5]. See also [6] for a survey of biases in
methodology is applicable to epidemic data worldwide.
                                                                    seroprevalence data. These limitations need to be taken into
                                                                    account in an estimation of dynamics of the real extent of
                                                                    the pandemics, particularly during periods of a severe
                                                                    epidemic state.
Summary of Results
                                                                    The uncertainty in data has consequences. Public health
                                                                  policies depend on observed epidemiological data and
    ●    The demand exceeded the capacity of the hospital         under- or over- reporting may lead to wrong decisions. It
         beds for COVID patients in the Slovak Republic           also creates a significant hurdle in epidemic modelling as
         by approximately 20.0% during the peak of the            limitations in observed data impede model calibration. This
         pandemic wave in December 2020 – March 2021.             in turn makes the decision process on health policies and
    ●    The demand exceeded the capacity of the hospital         other epidemic mitigation measures even more difficult and
         beds with mechanical lung ventilation for COVID          partially blind.
         patients in the Slovak Republic by approximately
         19.2% during the pandemic wave in November               1.2 Our work
         2020 – February 2021.
    ●    The average clinical sensitivity of the lateral flow        We combine multiple publicly available data sources to
         antigen tests compared to RT-qPCR tests was              identify a robust linear relationship in data that emerges
         approximately 37% during the pandemic wave in            outside of the periods of severe epidemics. During these
         October 2020 - June 2021 in the Slovak Republic.         periods we assume that the true pandemic state is also
                                                                  governed by the same linear relationship, however, the
                                                                  limitations in the observed data violate it and the data
                                                                  points do not lie on the identified linear pandemic
                                                                  manifold. We estimate the true pandemic state by a
                                                                  projection of the observed data onto the linear manifold.
                                                                  The particular form of the projection (orthogonal projection
                                                                  in normalized data sets) reflects an equal distribution of
   _______________________
   Copyright ©2021 for this paper by its authors. Use permitted under Creative Commons License Attribution 4.0
International (CC BY 4.0).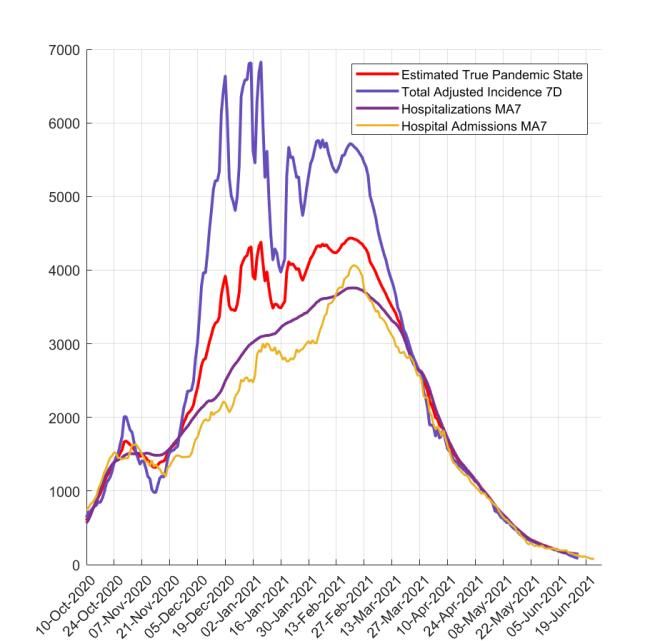
uncertainty between various sources of the data. The                  RT-qPCR and LFAg 7-day incidences in Slovakia.
estimate of true pandemic state allows us to measure the         Hospitalizations are lagged by 8 days behind the incidence ,
extent of a lack of capacity of hospitals and mechanical         MLV are lagged for additional 14 days (see Section 3.2 for
ventilations during the peak of the pandemic wave.                details) and scaled to fit hospitalizations (see Section 3.3
   We apply the methodology developed in this work to the                      for details) in March-June 2021.
epidemic data from the Slovak Republic during its second
SARS-CoV-2 pandemic wave (August 2020 - June 2021).                Throughout this work we use the following public data
For a period of more than a month during this wave               sets [11] from the Slovak Republic shown in Fig. 1:
Slovakia ranked within the top 3 countries with the largest
number of reported COVID-19 related deaths per capita in           ●    RT-qPCR daily incidence
the world [7]. Our particular choice to study data from the             The RT-qPCR test detects viral genetic material
Slovak Republic introduces an additional interesting and                through the reverse transcription quantitative
important feature that stems from complexity in infection               polymerase chain reaction. The sample is collected
incidence data. Slovakia conducted massive rapid antigen                using two nasopharyngeal and one throat swab.
testing by lateral flow antigen (LFAg) tests complementary              Various unidentified types of RT-qPCR tests were
to regular real time quantitative polymerase chain reaction             used during the second pandemic wave in Slovakia
(RT-qPCR) tests [8]. On average 0.53 RT-qPCR and 7.84                   (August 2020 – June 2021). The tests were available
LFAg tests per capita were performed in Slovakia before                 to the public for free in case the individuals were
July 1st, 2021 [9,10]. Due to significant differences in these          indicated by the Regional Public Health Authority or
two diagnostic technologies and a disproportion between                 self-indicated due to a presence of COVID-19
the number of tests administered using them, the observed               symptoms or a close contact with an infected
infection incidence needs to be viewed as a two-                        individual. RT-qPCR tests were also offered on a
dimensional vector with individual components - the                     commercial basis to the general public. The
volume of the positive RT-qPCR and LFAg tests. Similarly                incidence is reported daily by the National Health
the total number of tests is a vector. Our approach identifies          Information Center [12] and updated retrospectively
a linear combination of the two incidences into total                   by the Ministry of Health of the Slovak Republic
adjusted incidence that robustly agrees with the lagged                 [11].
hospital bed occupancy outside of the epidemic peaks.
                                                                   ●    LFAg daily incidence
                                                                        The LFAg test detects specific SARS-CoV-2
2    Data                                                               antigens in nasopharynx through a rapid lateral flow
                                                                        chromatographic immunoassay. Slovakia used
                                                                        almost 43 million rapid lateral flow antigen tests
While most countries report their RT-qPCR incidence as a                during the studied time period. The majority of the
diagnostic characteristic of their epidemic situation, during           tests used were STANDARD Q COVID-19 Ag (SD
the studied period Slovakia used two types of tests for                 Biosensor) complemented by Panbio COVID-19 Ag
monitoring. Individuals could choose between an RT-qPCR                 (Abbott). Biocredit COVID-19 Ag (RapiGen) was
and an LFAg test. While the scope of RT-qPCR test                       used to a limited extent. The tests were available for
program was limited, the LFAg testing was conducted on a                free to the general public on a mass scale. The LFAg
massive scale with mass antigen testing in October-                     incidence data have limitations as they were
November 2020 [8] and the mass antigen screening                        significantly updated a few months back in time
program in January-April 2021.                                          repeatedly during the second pandemic wave in
                                                                        Slovakia and they contained errors on a daily basis.
                                                                        None of the three types of the LFAg tests were
                                                                        validated on a large sample in Slovakia by RT-
                                                                        qPCR tests. The incidence is reported daily by the
                                                                        Ministry of Investments, Regional Development and
                                                                        Informatization of the Slovak Republic [9] and
                                                                        updated retrospectively by the Ministry of Health of
                                                                        the Slovak Republic [11]. We use solely the updated
                                                                        data set in our analysis. We do not include the data
                                                                        from the mass LFAg testing in October-November
                                                                        2020 in our data set as they create significant
                                                                        deviations from the long term testing trend.
                                                                        Inclusion of the data disturbs the linear relationship
                                                                        between incidence and hospitalizations to a much
                                                                        larger extent than the underestimation of the
                                                                        incidence by omission of the data used here.
                                                                    Both types of tests had their advantages and
                                                                 disadvantages: different accessibility of testing for the
      Fig. 1. Time series of 7-day moving averages of            public, duration of test evaluation, number of sample swabs
     hospitalizations and mechanical ventilations and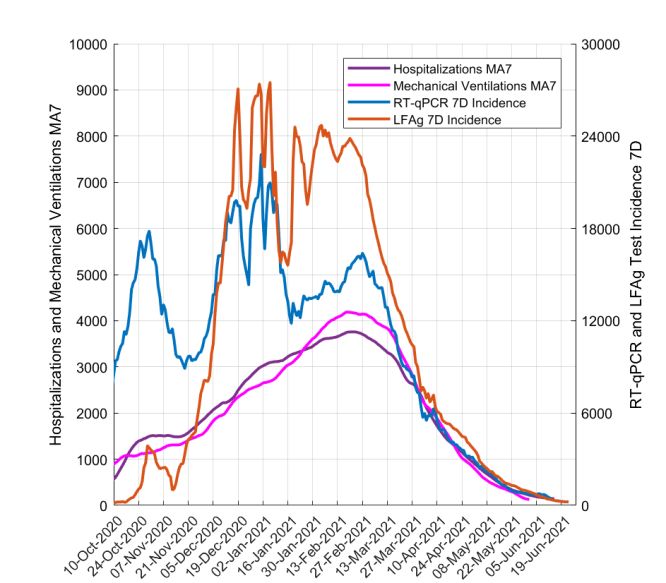
collected from a tested individual, and reliability of the test          to MLV with positive COVID-19 tests. The capacity
result. Individuals were often selecting their diagnostic test           of the beds equipped with MLV designated for the
type based on their current situation, time constraints,                 COVID-19 patients was adjusted when possible and
presence of disease symptoms, or contacts with positively                needed throughout the second wave by a
tested individuals. While RT-qPCR tests were typically                   reprofilization of the other types of hospital beds.
used in hospitals in all suspected cases (from January                   The data are reported by the regional hospitals to the
2021), in the general public many tested individuals opted               Ministry of Health of the Slovak Republic and
for a simpler, quicker and easily accessible LFAg test                   published [11].
instead, even if they were symptomatic. Negative test
results within the last 7 days (or 14 or 21 days) of any of          The numbers of occupied beds and MLV are reported
these two types of tests were required in certain regions or      daily. However, the publicly available data on hospital
in the whole country for a relief from a mandatory home           admissions and discharges also published by the Ministry
isolation for the most of the duration of the second              of Health of the Slovak Republic [11] disagree with the
pandemic wave in Slovakia. Fig. 2 shows the total volume          number of occupied beds. According to the analytic unit of
of the tests administered.                                        the Ministry, the published admissions and discharges data
                                                                  are subject to significant underreporting on both sides due
                                                                  to lack of reporting from certain hospitals [13].
                                                                  Nevertheless, the data on daily hospital admissions contain
                                                                  additional information that we use for a check.
                                                                     In addition to data from the Slovak Republic we also
                                                                  study the data from Spain as an example of a linear
                                                                  dependence of lagged hospitalizations behind incidence.
                                                                  We use two data sources: hospitalizations [14] and daily
                                                                  RT-qPCR positive tests incidence [15] which cover the
                                                                  studied time period Oct 12, 2020 - May 2, 2021. We
                                                                  selected Spain as a demonstrative example here as it shows
                                                                  an excellent consistent agreement with the linear trend
                                                                  between incidence and hospitalization data. We have
                                                                  surveyed all European countries for such a linear trend and
                                                                  identified it at least partially (in time) in all countries.
                                                                     Note that to eliminate natural weekly oscillations in all
                                                                  sources of data we systematically use moving 7-day
                                                                  averages or 7-day totals. Each 7-day average and total is
                                                                  identified with the day in the middle to eliminate the time
  Fig. 2. Total volume of administered RT-qPCR (red) and          shift introduced by the averaging and summation.
LFAg (black) tests. The mass antigen testing in October –
November 2020 is not included in the data and it is also not
           added to the corresponding incidence.                  3     Results
  Although in some countries each admitted SARS-COV-2             3.1 Total Adjusted Incidence
positive case diagnosed by an LFAg test is confirmed by a
RT-qPCR test, this was not the case in Slovakia where in          The RT-qPCR and LFAg incidences are typically added up
many cases only LFAg was performed instead of a RT-               to describe the total incidence. This is also the practice of
qPCR test, particularly in many hospitals during the period       the COVID automaton policy in Slovak Republic enforced
November - December 2020.                                         by the Ministry of Health that monitors the epidemic
                                                                  situation weekly in 79 individual counties and nationwide
  ●    Hospitalizations                                           [16]. However, to account for diagnostic differences in tests
       The daily hospitalization data represent the reported      we model the observed total adjusted incidence as a
       total number of occupied beds in hospitals in the          weighted linear combination of the RT-qPCR and the
       Slovak Republic by patients with confirmed positive        LFAg incidence:
       COVID-19 tests. The capacity of the beds
       designated for the COVID-19 patients was adjusted              Total Adjusted Incidence =
       when possible and needed throughout the second                                RT-qPCR Incidence        +    c   *LFAg
       wave by a reprofilization (repurposing) of the other                 Incidence
       types of hospital beds. The data are reported by the
       regional hospitals to the Ministry of Health of the           Here we set the coefficient of RT-qPCR incidence to be
       Slovak Republic and published [11].                        equal to one without loss of generality. The weight
                                                                  coefficient c of the LFAg incidence can be interpreted as a
  ●    Mechanical lung ventilations                               ratio of relative diagnostic performance of the tests, i.e. a
       The MLV data represent the reported total number           multiplicator characterizing how many samples tested by
       of occupied beds in hospitals by patients connected        LFAg would be positive on average per one LFAg positive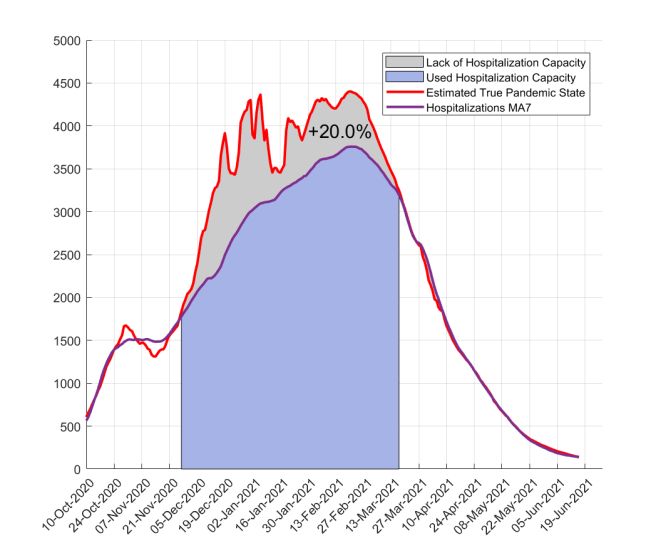
test if the samples were tested by RT-qPCR tests. There are of the red line is 0.66 (95% CI: 0.61-0.70). The intercept
numerous studies of sensitivity of various types of LFAg with the vertical axis is at 6759 (95% CI: 6013-7505).
tests compared to (various types) of RT-qPCR tests (see the
comprehensive summary in the SI of [10]). However, For Slovakia such a good approximation by a linear
caution is necessary in an interpretation of these parameters relationship cannot be identified for any reasonable lags (0-
as most of these studies were conducted on symptomatic 14 days) if incidence is measured solely by the RT-qPCR
patient samples that significantly differ from the sample tests or solely by the LFAg tests. Thus we search for a
tested in Slovakia. Note that here we neglect the difference linear relationship of the total adjusted incidence that
in clinical specificity of the two types of tests as we believe includes both RT-qPCR and LFAg tests and the reported
its effect on our analysis is negligible. hospitalization data lagged by D days. To keep the number
We select the value of the coefficient c based on the best of parameters of the model as small as possible, we do not
linear fit between the total adjusted incidence and the introduce a parameter for the mutual lag between RT-qPCR
lagged hospitalization data outside of the epidemic peaks LFAg incidence. Its inclusion influences our results only
(see the next section for details). We consider the values of very marginally (not shown).
c in the interval [0,5], where c = 1 and c = 2 represent,
respectively, estimated 100% and 50% average sensitivity Hospitalizations (t+D) = a+b*Total Adjusted Incidence (t)
of a LFAg test compared to a RT-qPCR test. On the other
hand c = 0.5 represents 50% average sensitivity of a RT- The linear pandemic manifold serves as a basis of an
qPCR test compared to a LFAg test. estimate of the true pandemic state. Outside of the epidemic
peaks and the periods of mass testing, the data lie on the
manifold. We calculate the parameters of the linear
3.2 Linear pandemic manifold manifold by a linear regression of the total adjusted
incidence and lagged hospitalizations (both with 7-day
Existing studies and datasets identify the proportion of moving averages) on the data outside of the epidemic peak
cases that required a hospitalization from reported positive - 60 days at the onset of the wave (Oct 10 – Dec 9, 2020)
COVID-19 cases [17,18] and the lag of reported and 60 days at the tail of the wave (Apr 16 - Jun 15, 2021).
hospitalizations behind the new case detection by a test The relative diagnostic sensitivity parameter c and the lag
[19]. Similar ratio estimates are for the proportion of cases D were optimized simultaneously by minimization of the
that required a mechanical lung ventilation and their residuals of the linear regression along with parameters a
reporting delay [19]. The proportion varies with the age of and b, see Fig.4. The cut-off dates (Dec 9 and Apr 16) were
infected individuals. However, all these studies rely on a selected to obtain a robust data fit that does not
single source of measured observed incidence - RT-qPCR significantly change when the interval is shortened or
tests. extended by a few days (eventually, these dates can be
A linear relationship is apparent in some countries selected simultaneously as a part of the optimization
between the observed incidence and the lagged process). The optimization was performed in MATLAB©.
hospitalizations, see an example of Spain in Fig. 3.
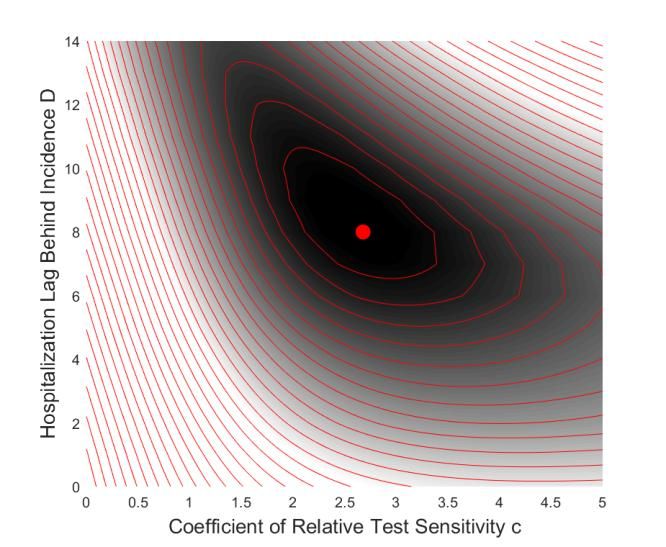
Fig. 4. Sum of squares of residuals of a linear regression of
total adjusted incidence and the lagged 7-day moving
average of hospitalizations over the time periods Oct 10 –
Fig. 3. Relation of the 7-day RT-qPCR incidence and the Dec 9, 2020 and Apr 16 - Jun 15, 2021. The optimized
moving 7-day average of hospitalizations lagged by 8 days parameters are the coefficient of relative test sensitivity c
in Spain (October 12, 2020 – May 2, 2021). An observed and the lag of hospitalization data D. The dark color
linear trend is displayed in red for an illustration. The slope corresponds to low values of the error.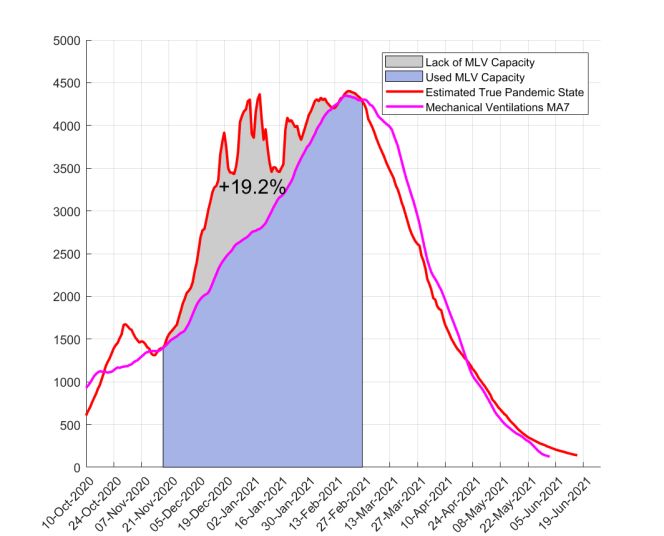
The optimal parameters c = 2.68 and D = 8 days
correspond to approximately 37% clinical sensitivity of
LFAg tests on a large predominantly asymptomatic sample
compared to the RT-qPCR tests and 8 days lag of reported
hospitalization behind the reported incidence. Note that the
value of c in the interval (2, 3) does not significantly alter
the total error. The value of the slope parameter b = 0.48
(95% CI: 0.46-0.50) of the pandemic manifold has a
practical implication: the bed occupancy in hospitals is
approximately a half of the 7-day total adjusted incidence
8-days ago. The vertical intercept is at a = 68.35 (95% CI:
25.85-110.86). If we take into account the large volume of
the total tests (RT-qPCR+LFAg) administered, the
calculated rate b is in agreement with the estimate for Spain
(Fig. 3).
   During the peak of the epidemic wave, we estimate the
true epidemic state by a perpendicular projection of the
observed data to the linear pandemic manifold. Note that
perpendicular projection is not invariant to scaling of the
axes. Therefore we first normalize the observed data
averages (Total Adjusted Incidence and Hospitalizations) to
the same mean over the studied period (Total Adjusted               Fig. 6. The inferred estimate of the true pandemic state
Incidence was scaled in this calculation by a factor F =               compared to observed data time series. Hospital
0.36, not shown in the figure). The perpendicular projection              admissions are lagged and rescaled to match
thus distributes uncertainty in both data series equally. Fig.               hospitalizations in March-June 2021.
5 shows the resulting linear manifold and also illustrates
the projection in the rescaled variables. Fig. 6 shows a          3.3 Lack of Hospital Capacity
comparison of the observed data time series and the
inferred estimate of the true pandemic state. The result of          The obtained estimates of the dynamics of the true
the projection method is not a simple linear interpolation of     pandemic state allow us to additionally estimate the lack of
the underlying data: in some phases, the true pandemic            capacity in the hospitals for both the total bed capacity for
state is closer to the hospitalizations, and in others to the     COVID-19 patients and for mechanical lung ventilations.
total adjusted incidence.                                         Fig. 7 shows a comparison of the estimated real demand for
                                                                  hospital beds by the projection method. During the period
                                                                  December 2020 – March 2021 we estimate that about
                                                                  20.0% of the demand exceeded the hospital's capacity.
                                                                  These patients would be hospitalized if they fell ill outside
                                                                  of the period of epidemic peak.
                                                                     We see that the capacity for hospital beds was saturated
                                                                  at the end of November. Even the increase of the bed
                                                                  capacity through reprofilization of beds in the next few
                                                                  months could not meet the steadily increasing demand for
                                                                  hospitalizations. The demand exceeded the capacity the
                                                                  most around the end of December. After a short
                                                                  improvement in the first half of January a worsening trend
                                                                  in the second half of January followed. After a two week
                                                                  stagnation the excess of demand started to shrink
                                                                  significantly and it disappeared completely in the middle of
                                                                  March.
                                                                     A partial check of our estimate can be performed using
                                                                  the hospital admission data. As discussed above, the
                                                                  reported hospital admission data do not agree with the
Fig. 5. Total adjusted 7-day incidence vs. the 7-day moving
                                                                  reported hospital bed occupancy by patients with COVID-
   average of hospitalizations lagged by 8 days. The linear
                                                                  19 due to reporting issues with the health system. However,
    pandemic manifold (shown in red) was calculated as a
                                                                  here we use them as an independent data set. Fig. 6 shows
linear regression line for the subset of the data (indicated by
                                                                  that our estimated true pandemic state agrees well with the
 blue and yellow, respectively, for the first and last 60 data
                                                                  hospital admissions from mid-October to mid-November (a
      points). A perpendicular projection is displayed for
                                                                  much better fit than hospitalization and incidence data that
     illustration (red dashed lines) at two data points. The
                                                                  were used in the projection method to obtain the estimate).
  projection was calculated for the incidence rescaled to fit
                                                                  Later the hospital admissions start to deviate from the true
                 the means of the two data sets.
                                                                  epidemic state similarly to hospitalization data due to the
                                                                  lack of hospital capacity. However, the hospital admissions
data have a local peak starting after Jan 1, 2021 that is not
present in the hospitalization data but it is reflected in the
estimate of the true pandemic state. Finally, the hospital
admissions have a peak in February followed by a
systematic long-term decrease in agreement with the true
pandemic state estimate.
Fig. 8. The estimate of the lack of mechanical lung
ventilations capacity (November 2020 – February 2021).
The area in blue corresponds to reported bed occupation,
the area in grey corresponds to the inferred number of extra
hospital beds with MLV over the capacity needed as
predicted by the model. The grey region has an area 19.2%
of the blue region.
Fig. 7. The estimate of the lack of hospital capacity
(December 2020 – March 2021). The area in blue 4 Discussion
corresponds to reported hospitalizations, the area in grey
corresponds to the inferred number of extra hospital beds
We have estimated the dynamics of the true pandemic
needed over the capacity as predicted by the model. The
state during the second pandemic wave in Slovak Republic.
grey region has an area 20.0% of the blue region.
The true pandemic state is a characterization of the true
demand for the hospital beds and the corresponding
A similar analysis provides an estimate of an excess of
expected epidemic incidence. It does not characterize the
demand for the mechanical lung ventilations over the
true number of infected individuals in the population as the
hospital capacity. Here we first need to transform the MLV
available data do not offer any direct characterization of
data by a proper rescaling and a time lag to agree with the
this quantity. Nevertheless, the hospitalizations are
scale of the total adjusted incidence data. To remove any
typically of the main interest during peaks of epidemic
potential bias, we fit the MLV data to the hospitalization
outbursts and thus the estimated true pandemic state
data outside of the epidemic peaks. The reciprocal value of
provides a useful characterization of the epidemic situation.
the resulting scaling factor 1/k = 0.14 captures the
We also provide estimates of the lack of capacity of
proportion of hospital beds with COVID-19 patients
hospital beds and mechanical lung ventilations. These
occupied by patients on MLV. It corresponds to an average
estimates may serve for an evaluation of the hospital
ratio of MLV and hospitalizations over a long time period.
capacity during the future waves, in a design of programs
A lag D2 = 14 days represents the average lag of the MLV
of patient reallocation and in a retrospective evaluation of
occupancy data behind the hospital bed occupancy. Fig. 8
the real pandemic costs.
shows the comparison of the estimated real demand for
One of the interesting features brought by the analysis is
MLV by the projection method to the linear pandemic
a comparison of the observed RT-qPCR and particularly
manifold with the reported MLV occupancy. During the
LFAg incidence with the estimated true pandemic state.
period November 2020 – February 2021 we estimate that
From mid November 2020 to March 2021 the total adjusted
about 19.2% of the demand exceeded the mechanical
incidence is above (and often significantly above) the true
ventilation bed capacity of the health system.
epidemic state. We suspect that it indicates that the
The dynamics of the excess demand for MLV agrees
information provided by the observed incidence at that time
with the excess demand for the total hospital bed
was overestimating the true pandemic state, particularly,
occupancy with a few differences: (i) our estimate captures
during the period mid-December 2020 to mid-January
one additional wave of excess demand for MLV in October
2021. The positive case detection was thus higher during
- November 2020, (ii) hospitalizations excess demand is
the period close to the peak of the pandemic wave. There
lagging approximately 2 weeks behind the MLV excess
are multiple reasons that may cause this effect: a larger
demand.
proportion of tested individuals in an early stage of
infection causing higher detection rate by the LFAg tests,
larger public awareness of the pandemic situation and
higher willingness of potentially infected individuals to gettested, a larger proportion of cases within hospitals with Our methodology has some limitations. The genomic
better testing surveillance, a larger overall testing capacity data from Slovakia reveal that during the period September
relative to the need. Additional factors can also be 2020 - June 2021 the dominant variant of the virus was
involved. Note that if the detection rate were not changing. These different variants of SARS-COV-2 may
overestimating the true pandemic state, the estimate of the eventually have different epidemiological parameters -
excess demand for hospital beds and mechanical lung relative sensitivity of detection by LFAg test compared to
ventilations would be even higher than presented here. RT-qPCR tests and ratio of hospitalized patients to the total
Also note that we do not evaluate any effects of testing number of cases. Thus the constant parameters derived
efforts to mitigate pandemics, just the information value of within our analysis are just a crude approximation of
the observed incidence for the estimation of the true eventual time dependencies. Also, our method relies on
pandemic state. available data with significant limitations and possible
We have also derived a coefficient of relative test inaccuracies.
sensitivity c between RT-qPCR and LFAg antigen tests. Although the analysis is limited to the second pandemic
The estimated value that corresponds to a sensitivity ratio wave in the Slovak Republic and involves particular data
approximately 37% is well below the values in validation limitations that may not be applicable elsewhere, the
studies (typically 50-70% see [10] for a summary). We overall methodology of using a linear pandemic manifold
suspect that the low sensitivity ratio is mainly due to a for an estimation of a true pandemic state during the
different sample composition in a mass testing setting in pandemic peaks is universal with potential application in
the Slovak Republic with a majority of tested individuals other geographical locations.
with no medical or epidemiological indication for the test.
Our result also offers an alternative methodology for total Acknowledgment
incidence calculation as a simple addition of RT-qPCR and
LFAg tests may not provide an accurate characteristic of The authors thank the reviewers for their useful
the situation that predicts the future hospitalizations. comments and suggestions that helped us to improve the
The true pandemic state estimates can be compared manuscript. We also thank the initiative of Slovak scientists
with reported deaths and excess deaths (excess mortality) and specialists Veda pomáha – COVID-19 for support and
[20-22]. The reported deaths data show a very high level of fruitful discussions during the preparation of the
temporal variation due to fluctuations in the sample manuscript. This work has been supported by the Slovak
selection and methodological changes and thus it is Research and Development Agency under the Contract
impossible to directly compare to theoretical linear trends Nos. APVV-18-0308 (RK), PP-COVID-20-0017 (RK, KB)
in data even with 7-day averaging. Separately reported and by the Scientific Grant Agency of the Slovak Republic
excess deaths data (the relative comparison of the volume under the Grants Nos. 1/0755/19 (RK) and 1/0521/20 (KB).
of all deaths with a 5-year average over the same week or
month of a year) are often used to characterize the extent of
the pandemics. However, there are multiple possible References
interpretations of the base level of excess deaths as during
the pandemics and periods of strong pandemic mitigation [1] M. Wolkewitz, & L. Puljak, Methodological
measures the deaths due to other reasons than COVID-19 challenges of analysing COVID-19 data during the
may have non-stationary character compared to previous pandemic, BMC Medical Research Methodology,
years. In the case of the Slovak Republic, an important 20:81, 2020. https://doi.org/10.1186/s12874-020-
00972-6
issue is also a systematic delay in reporting: excess deaths
[2] Y. Suhail, J. Afzal, & Kshitiz, Incorporating and
in Slovakia are often adjusted more than three months back addressing testing bias within estimates of epidemic
in time. A short comparison shows that the true pandemic dynamics for SARS-CoV-2. BMC Med Res Methodol
state agrees well with the excess deaths data until mid 21, 11, 2021. https://doi.org/10.1186/s12874-020-
January 2021. After that the excess deaths [22] show a 01196-4
systematic decline consistent with the decline of the [3] R. Schnell, & M. Smid, Methodological Problems and
estimated true pandemic state, however, the decline of Solutions in Sampling for Epidemiological COVID-19
excess deaths data starts about 5 weeks earlier. Research. Survey Research Methods, 14(2), 123-129,
Additional factors can improve the match of the 2020. https://doi.org/10.18148/srm/2020.v14i2.7749
[4] L. Villani, M. McKee, F. Cascini, W. Ricciardi, & S.
estimated true pandemic state to the fitted data. A natural
Boccia, Comparison of Deaths Rates for COVID-19
choice is an addition of lagged incidences exponentially across Europe During the First Wave of the COVID-19
discounted in time to total adjusted incidence to reflect the Pandemic. Frontiers in public health, 8, 620416, 2020.
distribution of the admission of the hospitalized patients at https://doi.org/10.3389/fpubh.2020.620416
a given time. The total quadratic residuals error of the [5] R. Badker, K. Miller, C. Pardee, et al., Challenges in
linear pandemic manifold from the fitted data points can be reported COVID-19 data: best practices and
decreased by adding two additional lagged incidences (by 4 recommendations for future epidemics. BMJ Global
and by 8 days) by approximately 20%. Although these Health, 6: e005542, 2021. doi:10.1136/bmjgh-2021-
factors change the dynamics of the estimated true pandemic 005542
[6] E.K. Accorsi, X. Qiu, E. Rumpler, et al. How to detect
state, the estimate for scope and time of the excess need for
and reduce potential sources of biases in studies of
hospitalizations and MLV change only very marginally. SARS-CoV-2 and COVID-19. Eur J Epidemiol 36,
Therefore we do not show these improved results here.179–196, 2021. https://doi.org/10.1007/s10654-021- [21] Excess mortality statistics. Dataset at
00727-7 https://ec.europa.eu/eurostat/statistics-
[7] Our world in Data, Weekly COVID-19 deaths per explained/index.php?title=Excess_mortality_-
million people worldwide. Available from: _statistics#Excess_mortality_in_the_European_Union
https://ourworldindata.org/grapher/weekly-covid- _between_January_2020_and_April_2021 (2021).
deaths-per-million-people (2021). (Last accessed: Aug (Last accessed: Aug 8, 2021)
8, 2021) [22] Excess mortality statistics. Dataset at
[8] E. Holt, Slovakia to test all adults for SARS-CoV-2, https://ourworldindata.org/grapher/excess-mortality-p-
The Lancet, 396(10260), pp. 1386-1387, 2020. scores?country=~SVK (2021). (Last accessed: Aug 8,
[9] The official COVID-19 website operated by the 2021)
Ministry of Investments, Regional Development and
Informatization of the Slovak Republic, Summary of
up-to-date performed RT-qPCR and LFAg tests in
Slovakia. Available from: https://korona.gov.sk/en/
(2021). (Last accessed: Aug 8, 2021)
[10] K. Boďová, R. Kollár, Spatial scales, patterns, and
positivity trends of SARS-CoV-2 pandemics in mass
rapid antigen testing in Slovakia. PLoS ONE 16(8):
e0256669, 2021.
https://doi.org/10.1371/journal.pone.0256669
[11] Institute of Healthcare Analyses, Ministry of Health of
the Slovak Republic. Dataset at:
https://github.com/Institut-Zdravotnych-
Analyz/covid19-data (2021). (Last accessed: Aug 8,
2021)
[12] National health information center, COVID-19 data
and statistics information panel. Available from: covid-
19.nczisk.sk/sk. (Last accessed: Aug 8, 2021)
[13] Institute of Healthcare Analyses, Ministry of Health of
the Slovak Republic, private communication.
[14] Data on hospital and ICU admission rates and current
occupancy for COVID-19. Available from:
https://www.ecdc.europa.eu/en/publications-
data/download-data-hospital-and-icu-admission-rates-
and-current-occupancy-covid-19 (2021). (Last
accessed: Aug 8, 2021)
[15] Data on COVID-19 cases: confirmed, recovered, and
deaths worldwide. Available from:
https://data.humdata.org/dataset/novel-coronavirus-
2019-ncov-cases (2021). (Last accessed: Aug 8, 2021)
[16] The official COVID-19 website operated by the
Ministry of Investments, Regional Development and
Informatization of the Slovak Republic, COVID-
automat. Available from: https://korona.gov.sk/covid-
automat-na-slovensku/ 2021. (Last accessed: Aug 8,
2021)
[17] Centers for Disease Control and Prevention. Risk for
COVID-19 Infection, Hospitalization, and Death By
Age Group. Available from:
https://www.cdc.gov/coronavirus/2019-ncov/covid-
data/investigations-discovery/hospitalization-death-by-
age.html 2021. (Last accessed: Aug 8, 2021)
[18] A.R. Tuite, D.N. Fisman, A. Odutayo, P. Bobos, V.
Allen, I.I. Bogoch, et al. “COVID-19 hospitalizations,
ICU admissions and deaths associated with the new
variants of concern,” Science Briefs of the Ontario
COVID-19 Science Advisory Table, 1(18), 2021.
[19] C. Faes, S. Abrams, D. Van Beckhoven, G. Meyfroidt,
E. Vlieghe, N. Hens, “Time between Symptom Onset,
Hospitalisation and Recovery or Death: Statistical
Analysis of Belgian COVID-19 Patients”, Int J
Environ Res Public Health 17(20), pp. 7560, 2020.
[20] Statistical Office of the Slovak Republic, Data on
deaths by month of death, age, sex and causes of death
- SR-Area-Reg. Dataset at
http://datacube.statistics.sk/#!/view/en/VBD_SK_WIN
2/om3801mr/v_om3801mr_00_00_00_en (2021).
(Last accessed: Aug 8, 2021)You can also read