Weekly Epidemiological Bulletin - Coronavirus (COVID-19) - Northern Ireland - Public Health Agency
←
→
Page content transcription
If your browser does not render page correctly, please read the page content below
Coronavirus (COVID-19)

Weekly Epidemiological
Bulletin

                Northern Ireland

     Week 52 (27 December - 02 January 2021)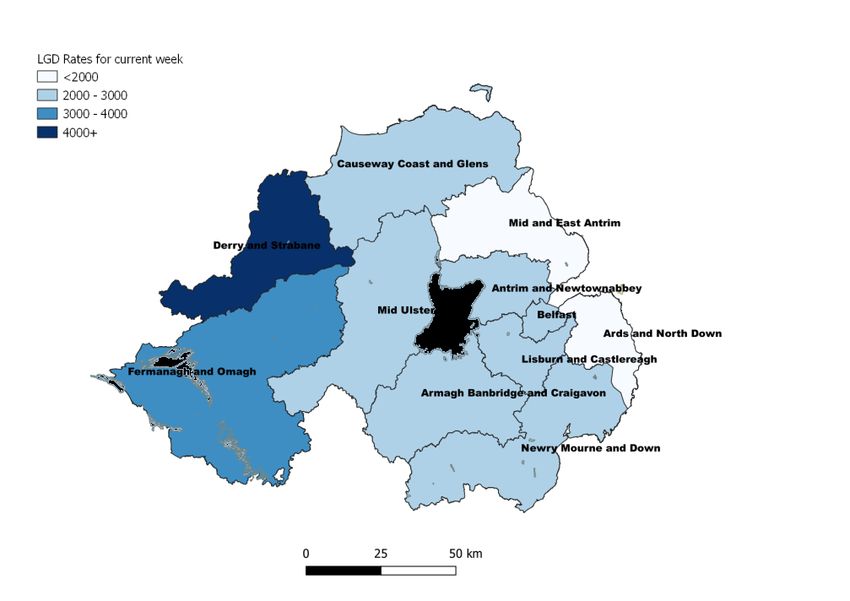
COVID-19 Weekly Epidemiological Bulletin Up to week 52 (02 January 2022)
Summary - Up to week 52 (02 January 2022)
From 01 January 2021 to 02 January 2022 (week 52), there have been a
total of 349,622 laboratory confirmed cases1 of COVID-19. From March
2020 to week 50 2021 there have been 3,969 registered COVID-19
deaths2 in Northern Ireland (NI).
COVID-19 case epidemiology
From 01 January 2021 to 02 January 2022 (week 52):
349,622 laboratory confirmed cases (4.7% from HSC
laboratories)
52.0% of total cases are female
In week 52, those aged 15-44 had the highest case rate
(4654.4 per 100,000; 56.9% positivity)
In week 52, Derry & Strabane had the highest case rate
(4510.6 per 100,000 population; 54.3% positivity)
Confirmed COVID-19 care home outbreaks
1097 confirmed COVID-19 outbreaks reported in total;
includes 93 reported in week 52
Involving 436 care homes (91.6% of all NI care homes)
The highest proportion of outbreaks (98.7%) were reported
from the Southern Trust area
Critical care surveillance
920 confirmed COVID-19 individuals
The majority of reported critical care cases were male
(65.9%)
1
Virological reports and the National Testing Programme.
2
NISRA; 2020-21 - up to 17 December 2021.
1
COVID-19 Weekly Epidemiological Bulletin Up to week 52 (02 January 2022)
Median age of cases was 59 years (range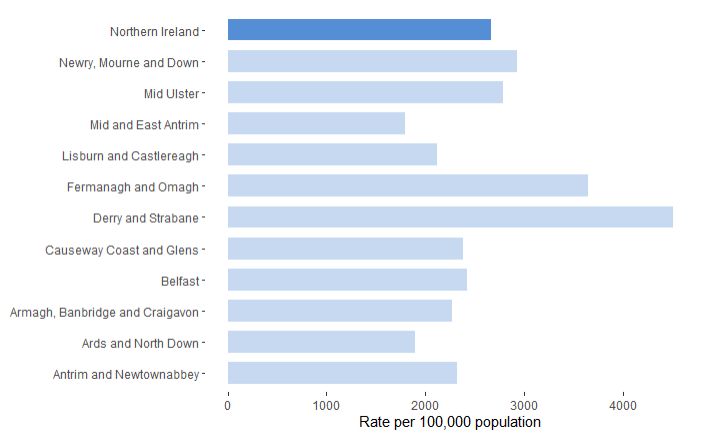
COVID-19 Weekly Epidemiological Bulletin Up to week 52 (02 January 2022)
What’s New
For Week 49 onwards there is currently no updated ICU/critical
care data available.
Excess death details have not been updated for the current week.
Due to the recent large increase in the number of positive COVID-
19 cases associated with the Omicron variant and the pressures
placed on the CT service, cases associated with higher risk
settings (e.g. healthcare, food processing/packaging ) and clusters
and outbreaks with higher numbers have been
prioritised. Therefore the number of clusters with smaller
numbers of associated cases is likely to be an underestimate.
3COVID-19 Weekly Epidemiological Bulletin Up to week 52 (02 January 2022)
Introduction
COVID-19 is an illness that can affect your lungs and airways. It's
caused by a virus called SARS-CoV2 (a member of the coronavirus
family).
The Public Health Agency (PHA) Health Protection team has developed
this report with the primary focus of looking at the demographic
characteristics (age, sex and geographical location) of people affected
by the virus. It also looks at some of the wider impacts of the virus on the
healthcare system, comparing recent trends in activity with historic
norms. There is a large amount of data being regularly published
regarding COVID-19 (for example, the Department of Health COVID-19
Daily Dashboard Updates and the NISRA Deaths Registered
Dashboard). This report presents data from existing and newly
developed PHA Health Protection surveillance systems that monitor
COVID-19 activity in NI and complements the range of existing data
currently available.
As this is an emerging pandemic the systems used will constantly evolve
and the complexity of the analysis will increase. Any updates will be
documented in a “what’s new” section.
Unless otherwise stated, data are presented using epidemiological
weeks (a standardised method of counting weeks [Monday-Sunday] to
allow for the comparison of data year after year). This is dependent on
the data available and annual comparisons are not yet possible as the
virus only emerged in 2020.
The data included in this report are the most up to date data available at
the time of the report; however this is subject to change as the data are
subject to ongoing quality assurance.
4COVID-19 Weekly Epidemiological Bulletin Up to week 52 (02 January 2022)
Contact tracing
Contact tracing is the process of identifying, assessing, and managing
people who have been exposed to a disease to prevent onward
transmission (WHO). Contact tracing can help break the chains of
transmission of COVID-19 and is an essential public health tool for
controlling the virus.
Contact tracing seeks to limit and prevent the spread of infections such
as COVID-19. It works by identifying a confirmed case and asking them
who they have been in contact with. Individual contacts are considered
high risk if they have spent more than 15 minutes in close contact with a
confirmed case without personal protection. This means that those who
have casually passed by someone on the street will not be considered
high risk. The person with a confirmed infection and their close contacts
will be given advice regarding symptom management and the need to
self-isolate to prevent wider spread of the virus. This advice is based on
information available on the PHA website and includes social distancing,
handwashing and cleaning in the home to help protect people who are at
risk. We can also advise people on how to best look after those in their
care.
The most up-to-date contact tracing management service update (issued
23 December 2021) can be found here*.
The StopCOVID NI contact tracing app is now available from the Google
or Apple App store.
*These are experimental performance and activity data and provide a snapshot of contact tracer
activity. Data reported relates to a live operational system which includes case and contact activity in
progress or in a queue. It is based on manually recorded information and data extracted from current
contact tracing systems and reporting methods and parameters may change over time.
Automatic reporting in future may create a discontinuity in figures. New IT systems and data outputs
often take some time to bed in. Data should therefore be treated with caution while the system and
understanding of the data develops. At this stage, there is a risk of data entry errors or delay, which
may require that data are revised and updated in future. The process of finding and removing
duplicate records may also need refining, which could result in revisions to the data.
5COVID-19 Weekly Epidemiological Bulletin Up to week 52 (02 January 2022)
Clusters
Definition:
A cluster is currently defined as two or more laboratory confirmed cases
of COVID-19 among individuals associated with a key setting, who have
illness onset dates within a 14 day period. Key settings in which clusters
have occurred include: workplaces, retail, hospitality and leisure
premises as well as educational settings3.
Comment:
Number of all clusters (open and closed) that have been recorded by the
contact tracing service up to 12pm Sunday 19 December 2021.
There have been 112 new clusters since Monday 27 December 20214,5.
In total, up to 26 December 2021, a total of 1251 clusters with greater
than five people have been identified in the following council areas;
Antrim and Newtownabbey (n=121), Ards and North Down (n=60),
Armagh, Banbridge and Craigavon (n=139), Belfast (n=346), Causeway
Coast and Glens (n=61), Derry and Strabane (n=94), Fermanagh and
Omagh (n=74), Lisburn and Castlereagh (n=76), Mid and East Antrim
(n=74), Mid Ulster (n=119) and Newry, Mourne and Down (n=87). In
addition, there have been 4,933 clusters across Northern Ireland with
fewer than five people.
Source: Contact Tracing Service / PHA Health Protection Service
3
COVID-19 transmission is most common in household settings. The number of affected households is not reported.
4
Some clusters may overlap (larger clusters may contain or overlap with several smaller clusters).
5
From week to week the number of clusters may change due to ongoing updates to the source information following detailed
risk assessments. For this reason, we would discourage making direct comparisons between the cumulative number of clusters
reported each week, with the number reported in the current week the most accurate at the time of the report.
6COVID-19 Weekly Epidemiological Bulletin Up to week 52 (02 January 2022)
Case epidemiology
Figure 1. Laboratory confirmed COVID-19 cases by epidemiological week and
source (HSC Laboratory testing and the National Testing Programme), 2021
Figure 1 represents the number of new weekly cases reported to the PHA
(bars) and the cumulative number of cases (dashed line). Reporting is
likely to be incomplete for the most recent week due to natural delays in
samples reaching the labs, being tested and the information being
reported.
At the beginning of 2021 there was a general downward trend in the
number of weekly cases, however from week 21 there was a general
increasing trend in cases, peaking in week 33. Although this was then
followed by a decrease in weekly cases, there have been increases in
recent weeks, reaching a large peak in week 52.
7COVID-19 Weekly Epidemiological Bulletin Up to week 52 (02 January 2022)
Figure 2. Laboratory confirmed cases, by age, sex and source (HSC Laboratory
testing and the National Testing Programme), 2021
Figure 3. Laboratory confirmed cases per 100,000 population, by age and sex, for
all testing data combined, 2021
8COVID-19 Weekly Epidemiological Bulletin Up to week 52 (02 January 2022)
Figure 4. Laboratory confirmed cases, by age, sex and source (HSC Laboratory
testing and the National Testing Programme), for weeks 51 and 52
Figure 5. Laboratory confirmed cases per 100,000 population, by age and sex, for
all testing data combined, for weeks 51 and 52
9COVID-19 Weekly Epidemiological Bulletin Up to week 52 (02 January 2022)
Figures 2 and 3 represents the cumulative number of cases reported by
HSC laboratories and the National Testing Programme, and overall case
rates per 100,000 respectively, for 2021. The increasing use of the
National Testing Programme as the main source of case data is
particularly evident in the 2021 data; this programme enables detection of
a greater spectrum of disease, in a greater number of settings additional to
hospitals, including amongst younger age groups. From this data, we can
see a higher number of cases overall in the 10-19 age group.
Figures 4 and 5 show similar findings to the cumulative numbers but
restricted to the previous two epidemiological weeks. These show how the
age groups of cases in the most recent weeks at times differ from the
overall cumulative cases presented in figures 2 and 3; in particular, the
consistently lower case numbers in older age groups, and rising figures in
20-29 age group in recent weeks.
*Unknown sex for 577; these are not included in the total figures
10COVID-19 Weekly Epidemiological Bulletin Up to week 52 (02 January 2022)
*Other cases includes those from the National Testing Programme, NIAS, private nursing home residents, pathology services, GPs
and hospices
11COVID-19 Weekly Epidemiological Bulletin Up to week 52 (02 January 2022)
Figure 6. Weekly laboratory confirmed case rates per 100,000 population, by age
group, for all testing data combined, 2021
12COVID-19 Weekly Epidemiological Bulletin Up to week 52 (02 January 2022)
The case rates increased in week 52 in all age groups. The highest case
rates were seen in the 15-44 age group (4654.4 per 100,000). This is
significantly higher than the previous peak of 1408.1 per 100,000 in the 5-
14 age group in week 48 (29 Nov – 05 Dec 2021).
In week 52, positivity was highest in the 15-44 age group (56.9%). The
lowest positivity was observed in the 85+ age group (10.8%).
Figure 7. Positivity (%) of laboratory confirmed COVID-19 cases by
epidemiological week, overall and by sex (HSC Laboratory testing), 2021
13COVID-19 Weekly Epidemiological Bulletin Up to week 52 (02 January 2022)
Figure 8. Positivity (%) of laboratory confirmed COVID-19 cases by
epidemiological week, overall and by sex (National Testing programme), 2021
14COVID-19 Weekly Epidemiological Bulletin Up to week 52 (02 January 2022)
Figure 9. Total laboratory confirmed cases, by Local Government District (LGD)
and source (HSC Laboratory testing and the National Testing Programme), 2021
Figure 10. Density map of confirmed COVID-19 cases, for all testing combined,
2021
15COVID-19 Weekly Epidemiological Bulletin Up to week 52 (02 January 2022)
Figure 10 shows a density map based on the number of confirmed
COVID-19 cases in week 52, in which data is aggregated at Ward level.
The coloured shading on the map indicates density of cases, with the
darkest shade of blue indicating where there is the greatest density of
cases. However, information should be interpreted with caution as
identified rates are based on testing which is not evenly spread across
the region.
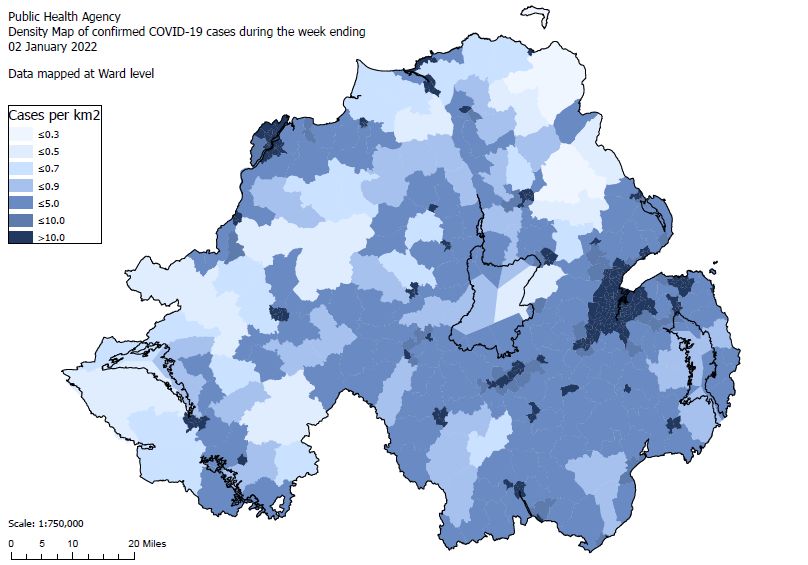
Figure 11. Total laboratory confirmed cases per 100,000 population, by Local
Government District (LGD), for all testing data combined, week 52 (29 December
2021 – 02 January 2022)
16COVID-19 Weekly Epidemiological Bulletin Up to week 52 (02 January 2022)
Antrim and Newtownabbey Ards and North Down
4000 60 4000 60
Rate per 100,000 population
Rate per 100,000 population
Proportion positive
3500
Proportion positive
3500 50 50
3000 3000
40 2500 40
2500
2000 30 2000 30
1500 20 1500 20
1000 1000
500 10 10
500
0 0 0 0
53 3 6 9 12 15 18 21 24 27 30 33 36 39 42 45 48 51 53 3 6 9 12 15 18 21 24 27 30 33 36 39 42 45 48 51
Epidemiological Week Epidemiological Week
Rate per 100,000 population Proportion Positive Rate per 100,000 population Proportion Positive
Armagh, Banbridge and Belfast
Craigavon 4000 60
Rate per 100,000 population
Rate per 100,000 population
4000 60 3500
Proportion positive
50
3500
Proportion positive
50 3000
3000 2500 40
2500 40
2000 30
2000 30
1500 20
1500 20 1000
1000 10
10 500
500
0 0
0 0
53 3 6 9 12 15 18 21 24 27 30 33 36 39 42 45 48 51
53 3 6 9 12 15 18 21 24 27 30 33 36 39 42 45 48 51
Epidemiological Week
Epidemiological Week
Rate per 100,000 population Proportion Positive
Rate per 100,000 population Proportion Positive
17COVID-19 Weekly Epidemiological Bulletin Up to week 52 (02 January 2022)
Causeway Coast and Glens Derry and Strabane
4000 60 4500 60
Rate per 100,000 population
Rate per 100,000 population
Proportion positive
3500 4000
Proportion positive
50 50
3000 3500
2500 40 3000 40
2000 30 2500
30
2000
1500 20 1500 20
1000
10 1000
500 10
500
0 0 0 0
53 3 6 9 12 15 18 21 24 27 30 33 36 39 42 45 48 51 53 3 6 9 12 15 18 21 24 27 30 33 36 39 42 45 48 51
Epidemiological Week Epidemiological Week
Rate per 100,000 population Proportion Positive Rate per 100,000 population Proportion Positive
Fermanagh and Omagh Lisburn and Castlereagh
4000 60 4000 60
Rate per 100,000 population
Rate per 100,000 population
3500
Proportion positive
Proportion positive
50 3500 50
3000 3000
40 40
2500 2500
2000 30 2000 30
1500 1500
20 20
1000 1000
10 500 10
500
0 0 0 0
53 3 6 9 12 15 18 21 24 27 30 33 36 39 42 45 48 51 53 3 6 9 12 15 18 21 24 27 30 33 36 39 42 45 48 51
Epidemiological Week Epidemiological Week
Rate per 100,000 population Proportion Positive Rate per 100,000 population Proportion Positive
18COVID-19 Weekly Epidemiological Bulletin Up to week 52 (02 January 2022)
Mid and East Antrim 4000
Mid Ulster 60
4000 60
Rate per 100,000 population
Rate per 100,000 population
3500
Proportion positive
3500
Proportion positive
50 50
3000 3000
2500 40 2500 40
2000 30 2000 30
1500 20 1500 20
1000 1000
500 10 500 10
0 0 0 0
53 3 6 9 12 15 18 21 24 27 30 33 36 39 42 45 48 51 53 3 6 9 12 15 18 21 24 27 30 33 36 39 42 45 48 51
Epidemiological Week Epidemiological Week
Rate per 100,000 population Proportion Positive Rate per 100,000 population Proportion Positive
Newry, Mourne and Down Northern Ireland
4000 60 4000 60
Rate per 100,000 population
Rate per 100,000 population
Proportion positive
Proportion positive
3500 50 3500 50
3000 3000
2500 40 2500 40
2000 30 2000 30
1500 20 1500 20
1000 1000
500 10 500 10
0 0 0 0
53 3 6 9 12 15 18 21 24 27 30 33 36 39 42 45 48 51 53 3 6 9 12 15 18 21 24 27 30 33 36 39 42 45 48 51
Epidemiological Week Epidemiological Week
Rate per 100,000 population Proportion Positive Rate per 100,000 population Proportion Positive
Figure 12. Weekly laboratory confirmed cases per 100,000 population and proportion positive, by Local Government District (LGD) and
Northern Ireland, for all testing data combined, 2021
19COVID-19 Weekly Epidemiological Bulletin Up to week 52 (02 January 2022)
The case rates increased in all LGDs in week 52 compared to week 50-51.
Derry & Strabane had the highest rate in week 52 compared to other Local
Government Districts (4510.6 per 100,000 population). The overall NI rate
increased from 1319.7 to 2668.4 per 100,000 population between weeks
51 and 52.
The highest positivity occurred in Derry & Strabane (54.3%). NI’s
proportion positive in week 52 was 47.8%, an increase from 29.2% in
week 51. This is higher than the previous peak positivity of 27.1% reported
across NI in week 53 of 2020 (27 December 2020 – 03 January 2021).
Source: HSC Trust laboratory reports and the National Testing Programme
Deprivation
An analysis of COVID-19 related health inequalities relating positive test
cases and COVID-19 related admissions between the most and least
deprived areas of NI, including variations across age, sex and urban and
rural areas was published by Department of Health on 16 December
2020.
20COVID-19 Weekly Epidemiological Bulletin Up to week 52 (02 January 2022)
Care home outbreaks
100 1200
Cumulative number of confirmed care home outbreaks
90
Number of confirmed care home outbreaks
1000
80
70
800
60
50 600
40
400
30
20
200
10
0 0
101316192225283134374043464952 2 5 8 1114172023262932353841444750
Epidemiological Week
No of confirmed care home outbreaks
Cumulative confirmed care home outbreaks
Figure 13. Confirmed COVID-19 care home outbreaks in Northern Ireland, 2020-
21
21COVID-19 Weekly Epidemiological Bulletin Up to week 52 (02 January 2022)
120%
100%
Proportion of care homes with confirmed outbreak
80%
60%
40%
20%
0%
9 12 15 18 21 24 27 30 33 36 39 42 45 48 51 1 4 7 10 13 16 19 22 25 28 31 34 37 40 43 46 49 52
Epidemiological Week
BHSCT NHSCT SEHSCT SHSCT WHSCT NI
Figure 14. Proportion of care homes with confirmed COVID-19 in Northern
Ireland by Trust area, 2020-21
Table 3. Proportion of care homes with confirmed COVID-19 outbreaks in
Northern Ireland, by Trust Area
Cumulative total
of care homes % of care homes Total number of
Trust Area
with outbreaks with outbreaks care homes
in 2020-21
Belfast 83 90.2% 92
Northern 115 89.8% 128
South Eastern 98 89.1% 110
Southern 77 98.7% 78
Western 63 92.6% 68
Northern Ireland 436 91.6% 476
*Please note the total number of registered care homes are regularly updated and may differ when compared to
previous weeks
To week 52, a total of 975 confirmed COVID-19 care home outbreaks
were reported, involving 436 care homes (91.6% of all NI care homes).
The highest proportion of care homes with confirmed COVID-19
outbreaks (98.7%) were reported from the Southern Trust area.
22COVID-19 Weekly Epidemiological Bulletin Up to week 52 (02 January 2022)
160
Number of care homes with active outbreak
140
120
100
80
60
40
20
0
Care homes with a laboratory confirmed symptomatic outbreak
Care homes with a laboratory confirmed asymptomatic outbreak
160
Number of care homes with active outbreak
140
120
100
80
60
40
20
0
08/12/2020 08/03/2021 08/06/2021 08/09/2021 08/12/2021
Care homes with a laboratory confirmed asymptomatic outbreak
Care homes with a laboratory confirmed symptomatic outbreak
Figure 15. Number of care homes with confirmed active symptomatic or
asymptomatic COVID-19 outbreak6 in Northern Ireland, 2020-21
6
PHA began recording confirmed Covid-19 outbreaks as either symptomatic or asymptomatic on 1 August 2020.
Confirmed COVID-19 outbreaks reported prior to 1 August 2020 and are still ongoing are not included in this
graph. Additionally, other respiratory outbreaks are not included.
23COVID-19 Weekly Epidemiological Bulletin Up to week 52 (02 January 2022)
Critical care surveillance
60
50
Number of confirmed ICU/HDU cases
40
30
20
10
0
11 14 17 20 23 26 29 32 35 38 41 44 47 50 53 3 6 9 12 15 18 21 24 27 30 33 36 39 42 45 48
Epidemiological Week
Change in surveillance procedure
*Since start of week 40 (28 September 2020), data collection for critical care surveillance has been streamlined to coincide
with the well-established surveillance of influenza patients in critical care in conjunction with the Critical Care Network
Northern Ireland (CaNNI). For weeks 11-40 in 2020, Epidemiological week refers to the week the positive specimen was
obtained. Post week 40 it refers to the week in which the individual was admitted to ICU.
Figure 16. ICU/HDU COVID-19 cases by sample result week, 2020-21
24COVID-19 Weekly Epidemiological Bulletin Up to week 52 (02 January 2022)
80+
70-79
60-69
50-59
Age groups
40-49
30-39
20-29
10-19
0-9
Unknown
170 120 70 20 30 80 130
Number of cases
Female Male
Figure 17. ICU/HDU COVID-19 cases, by age and sex, 2020-21
To week 48, there have been 920 individuals admitted to critical care
with confirmed SARS-CoV2 reported to the PHA. Week 2 had the
highest number of ICU reports with a positive result (n=47). Of the 920
individuals 65.9% (n=607) were male. The ages ranged fromCOVID-19 Weekly Epidemiological Bulletin Up to week 52 (02 January 2022)
Schools’ Surveillance
From 10th September 2021 there was a change to contact tracing of
children within schools settings1, 2. The change in contact tracing
arrangements, data systems and recording mean data presented from
that date will differ from that previously presented on schools in the PHA
COVID-19 bulletin. These data is therefore not directly comparable with
the schools data included in previous COVID-19 bulletins.
Reported association of cases with a school or educational
institution does not necessarily mean that transmission occurred in
school. COVID-19 transmission to pupils and staff can occur in a
variety of settings, including their households where the risk of
transmission is known to be high. Inferences should not be made
from these data about where COVID-19 transmission took place.
Summary points
In the 28 days up to 2nd January 2022:
1. There were 9,569 confirmed cases notified to the Contact Tracing
Service (CTS) where the case advised they attended or worked in
a school (5,823 primary, 3,528 post-primary and 218 special
school cases) (Table 4).
2. 60.9% of cases were associated with primary schools, 36.9% with
post-primary schools and 2.3% with special schools (Table 4).
3. The proportion of confirmed cases which were pupils was 2.3% of
the total enrolled school population (Table 5).
4. 84.2% of cases were pupils (Table 6).
5. 88% of primary, 99.5% of post primary and 92.5% of special
schools have had at least one case. Of schools with at least one
case in the last 28 days, 65.4% had 10 cases or fewer (Tables 7
and 8).
26COVID-19 Weekly Epidemiological Bulletin Up to week 52 (02 January 2022)
6. In 84.6% of schools the number of cases in pupils was less than
5% of their enrolled school population (Table 9).
In 0% of post primary schools the number of cases in pupils was
greater than 10% of their enrolled school population, compared to
4.8% in primary schools (Table 9).
1. Joint memo from the Offices of the Ministers of Education and Health regarding revised arrangements
for contact tracing of children in schools -
https://www.educationni.gov.uk/sites/default/files/publications/education/Joint%20Memo%20from%20D
E%20and%20DoH%20Ministers.pdf
2. Updated CMO guidance regarding schoolchildren - https://www.health-
ni.gov.uk/sites/default/files/publications/health/CMO-letter-to-school-community.pdf
27COVID-19 Weekly Epidemiological Bulletin Up to week 52 (02 January 2022)
Methodology and caveats
This report contains data related to confirmed COVID-19 cases (PCR
positive) entered onto the CTC database between 6th December and
2nd January 2022 (Epi weeks 49 to 52 based on date of sample)
where the case is reported to be associated with a school. Data was
extracted at 10am on Wednesday 5th January 2022.
Weeks 49, 50 etc. refer to Epidemiological weeks (Epidemiological
Weeks), running Monday to Sunday.
It is important to note that the definitive source for the number of
COVID-19 confirmed cases in school aged children is from PCR
testing via the National Testing Programme and HSC laboratories.
Direct comparisons should not be made between laboratory data and
data in this report. This report is subject to change as data quality and
methods develop.
Cases associated with nurseries, pre-schools, further education
colleges and universities are not included in this report.
The association of cases with a primary, post primary or special
school is based on self-reported data collected as part of the contact
tracing process. These data presented were analysed using data from
the CTC database, which is designed for contact tracing purposes and
not for identifying where transmission took place. Reported
association of cases with a school or educational institution does not
mean that cases were in school during their infective period or at the
date of the test, nor that transmission occurred in school. Inferences
should not be made from these data about where COVID-19
transmission took place.
Cases aged 4 to 19 years are categorised as pupils and those over 19
years categorised as staff. Cases without a recorded date of birth
were excluded from pupil/staff totals, which may be slightly different
from other table totals.
School enrolment numbers are taken from https://www.education-
ni.gov.uk/publications/school-enrolment-school-level-date-202021.
Data on the number of school institutions has been updated
28COVID-19 Weekly Epidemiological Bulletin Up to week 52 (02 January 2022)
(http://apps.education-ni.gov.uk/appinstitutes/default.aspx ) and may
differ from previous reports.
Regular twice weekly Lateral Flow Device (LFD) testing in pupils in
post-primary schools and staff in all mainstream schools may increase
case ascertainment as asymptomatic individuals testing positive by
LFD test are encouraged to seek PCR test confirmation of the result.
29COVID-19 Weekly Epidemiological Bulletin Up to week 52 (02 January 2022)
Figure 18. Weekly COVID-19 laboratory confirmed case rates per 100,000
population, by age group, for all testing data combined, in those aged 21 and
under.
In week 52, case rates increased across all age groups compared to
week 51. The 19-21 age group had the highest case rates (6180.6 per
100,000), followed by the 17-18 age group (4236.1 per 100,000), which
is a change from previous weeks in which the highest case rates were
seen in the 11-14 age group.
Please note: This figure shows case rates derived from laboratory testing data and NOT from CTC data.
30COVID-19 Weekly Epidemiological Bulletin Up to week 52 (02 January 2022)
Table 4 shows the total number of cases (includes pupils and staff) by
school type in the 4 weeks up to Epidemiological Week 52 (2nd January
2022).
Table 4. Number of COVID-19 cases reported by school type
Epidemiological
Post
Week and Primary Special Total Cases
Primary
Week ending
Wk 49 (12th Dec) 2099 1256 60 3415
Wk 50 (19th Dec) 2099 1036 61 3196
Wk 51 (26th Dec) 974 607 47 1628
Wk 52 (2nd Jan) 651 629 50 1330
Total 5823 3528 218 9569
Primary: includes primary and preparatory schools. Post primary: includes secondary and grammar schools.
31COVID-19 Weekly Epidemiological Bulletin Up to week 52 (02 January 2022)
4000
3500
Number of cases
3000
2500
2000
1500
1000
500
0
12/12/2021 19/12/2021 26/12/2021 02/01/2022
Week ending
Primary Post Primary Special
Figure 19. Number of COVID-19 cases reported by school type in the 4 weeks
up to Epidemiological Week 52 (2nd January 2022).
Table 5 shows the number cases that are pupils by school type and as a
proportion of all enrolled pupils in NI, in the last 7 and 28 days, up to
Epidemiological Week 52 (2nd January 2022).
Table 5. Number of cases and as a proportion of all school age children, by
school type, in the previous 7 and 28 days to 2nd January 2022
7 days 28 days
Proportion of Proportion of
School Type Cases pupil enrolment Cases pupil enrolment
for sector for sector
Primary 443 0.2% 4887 2.7%
Post Primary 461 0.3% 2952 2%
Special 8 0.1% 98 1.5%
Total 912 0.3% 7937 2.3%
32COVID-19 Weekly Epidemiological Bulletin Up to week 52 (02 January 2022)
Table 6 shows the number of pupils and staff cases, by school type, in
the previous 28 days, up to Epidemiological Week 52 (2nd January
2022).
Table 6. Number of pupil and staff cases, by school type, in the previous 28
days to 2nd January 2022
School Proportion of
Pupils Staff Total
Type all cases that
are pupils
Primary 4887 822 5709 85.6%
Post
2952 546 3498 84.4%
Primary
Special 98 120 218 45.0%
Total 7937 1488 9425 84.2%
Table 7 shows number of schools with cases and the proportion, by
school type, in the previous 28 days, up to Epidemiological Week 52 (2nd
January 2022).
Table 7. Number and proportion of schools with COVID-19 cases by school
type
Number Proportion
schools with of schools Total number of
School Type
schools in NI
at least one with at least
case one case
Primary 707 88.0% 803
Post Primary 192 99.5% 193
Special 37 92.5% 40
Total 936 90.3% 1036
*Please note the total number of schools has been updated and may differ when compared to previous weeks
33COVID-19 Weekly Epidemiological Bulletin Up to week 52 (02 January 2022)
Table 8 shows the number and percentage of schools with cases in
pupils or staff, by type of school in the previous 28 days, up to
Epidemiological Week 52 (2nd January 2022).
Table 8. Number and percentage of schools with cases by school type
Schools with COVID-19 cases
School Type 1-5 6-10 11-15 >15 Total
362 159 72 114
Primary 707
(51.2%) (22.5%) (10.2%) 16.1%)
Post 22 38 30( 102
192
Primary (11.5%) (19.8%) 15.6%) (53.1%)
19 12 5
Special * 37
(51.4%) (32.4%) (13.5%)
403 209 107 217
Total 936
(43.1%) (22.3%) (11.4%) (23.2%)
* Data not disclosed due to small numbers.
Percentages may not add to 100% due to rounding.
34COVID-19 Weekly Epidemiological Bulletin Up to week 52 (02 January 2022)
Table 9 shows positive cases in the context of school pupil population by
considering the number of pupil cases in each school relative to the
number of pupils in that school. It shows the number and percentage of
schools categorised by the proportion of pupil cases relative to the
enrolled school population, by type of school in the previous 28 days, up
to Epidemiological Week 52 (2nd January 2022).
Table 9. Number and percentage of schools categorised by the proportion of
pupil cases relative to the enrolled school population by school type
Percentage of cases relative to school population
(Number of pupil cases / total pupils enrolled)
School 0.1 to 2.5 to 5.0 to 7.5 to
≥10% Total
Type 2.4% 4.9% 7.4% 9.9%
378 162 65 32 32
Primary 669
(56.5%) (24.2%) (9.7%) (4.8%) (4.8%)
Post 140 44 6 0
* 191
Primary (73.3%) (23%) (3.1%) (0%)
20 7 0 0
Special * 28
(71.4%) (25%) (0%) (0%)
538 213 72 33 32
Total 888
(60.6%) (24%) (8.1%) (3.7%) (3.6%)
* Data not disclosed due to small numbers.
Percentages may not add to 100% due to rounding. The total number of schools in Table 8 (which considers
pupil cases only) may differ from Table 7 (which includes pupil and staff cases). Percentage of cases relative to
school population = number of pupil cases/ total pupils enrolled. Table does not include schools with no cases.
35COVID-19 Weekly Epidemiological Bulletin Up to week 52 (02 January 2022)
School sizes vary a great deal, with some having fewer than 100 pupils
and others having more than 1,000. Having 10 cases in a school with
1,000 pupils is very different in its impact to having 10 cases in a school
with 50 pupils. Pupil cases divided by the enrolled pupil populations
have been calculated as percentages for all schools with at least one
case. These have then been grouped into five categories, ranging from
those with less than 2.5% of pupils testing positive in the 28 day period
to those with 10% or more. This is shown in Table 9.
No post primary schools had cases in pupils in the last 28 days greater
than 10% of their enrolled school population, compared to 4.8% in
primary schools.
Source: PHA Education Cell and Contact Tracing Cell
36COVID-19 Weekly Epidemiological Bulletin Up to week 52 (02 January 2022)
Mortality Surveillance
Medical Certificate of Cause of Death for confirmed /
suspected COVID-19
The Northern Ireland Statistics and Research Agency (NISRA) provide
the weekly number of registered respiratory and COVID-19 deaths
each Friday (here). In week ending 17 December 2021, the proportion
of COVID-19 deaths registered was 8.8%, and from 19 March 2020 to
week ending 17 December 2021 the proportion of COVID-19 deaths
registered was 12.9%.
Weekly published data are provisional and is based on registrations of
deaths, not occurrences. The majority of deaths are registered within
five days in NI. Respiratory deaths include any death where terms
directly relating to respiratory causes were mentioned anywhere on the
death certificate (this includes COVID-19 deaths). This is not directly
comparable to the ONS figures relating to ‘deaths where the underlying
cause was respiratory disease’. Figures relate to all deaths registered up
to 26 November with a mention of COVID-19 on the death certificate.
Please note: Where COVID-19 is mentioned in part 1 it may not be the
underlying cause of death. COVID-19 deaths include any death where
Coronavirus or COVID-19 (suspected or confirmed) was mentioned
anywhere on the death certificate. NISRA quarterly statistics provide
detail of underlying cause following coding to ICD-10 rules; figures are
available here. Figures may be impacted by General Registration Office
closures over public holidays.
37COVID-19 Weekly Epidemiological Bulletin Up to week 52 (02 January 2022)
Female (n=1855) Male (n=2114)
85+ 891 682
75-84 555 794
Age group
65-74 226 385
45-64 156 229
15-44 27 23
Under 15 0 1
1000 800 600 400 200 0 200 400 600 800 1000
Number of deaths
Figure 21. NISRA registered COVID-19 deaths by sex and age group, up to week
ending 17 December 2021
Non-COVID-19 deaths COVID-19 death certificate, Part 2
COVID-19 death certificate, Part 1 Average deaths (previous 5 years)
Total deaths (2020/21P) Difference between average and total deaths
600
500
Number of deaths
400
300
200
100
0
11 14 17 20 23 26 29 32 35 38 41 44 47 50 1 4 7 10 13 16 19 22 25 28 31 34 37 40 43 46 49
Registration week (ending Friday)
Up to 2020 week 52, the Average deaths (previous 5 years) period ranged from 2015-2019. From 2021 week 1
onwards, this period ranges from 2016-2020
Figure 22. Northern Ireland registered deaths, including COVID-19 associated deaths,
Week 11 (ending 20 March 2020) to Week 50 (ending 17 December 2021)
38COVID-19 Weekly Epidemiological Bulletin Up to week 52 (02 January 2022)
Table 10.1 Northern Ireland registered deaths, including COVID-19 associated deaths, Week 1 (ending 08 January 2021) to
Week 26 (ending 02 July 2021)
Registration week (ending Friday) 1 2 3 4 5 6 7 8 9 10 11* 12 13 14 15 16 17 18 19 20 21 22 23 24 25 26
COVID-19 death certificate, Part 1 122 136 152 108 110 84 66 44 26 28 11 16 9 6 9 4 5 2 4 3 2 1 1 1 0 1
COVID-19 death certificate, Part 2 23 17 30 29 16 15 12 11 7 4 4 3 3 3 7 3 3 1 3 1 1 1 1 0 2 0
Non-COVID-19 deaths 423 290 292 300 336 283 274 273 286 307 238 288 276 236 273 298 283 267 319 315 263 280 263 312 317 271
Average deaths (previous 5 years) 417 399 375 359 337 332 311 349 338 338 287 315 320 337 316 312 342 274 323 295 284 280 284 290 271 285
Total deaths (2021P) 568 443 474 437 462 382 352 351 319 339 253 307 288 245 289 305 291 270 326 319 265 282 265 313 319 272
Table 10.2 Northern Ireland registered deaths, including COVID-19 associated deaths, Week 27 (ending 09 July 2021) to
Week 50 (ending 17 December 2021)
Registration week (ending Friday) 2727 28 2928 30 2931 32 3033 3431 35 32
36 37 3338 39 3440 4135 42 36
43 44 3745 46 3847 4839 49 40
50 41 42 43
COVID-19 death certificate, Part 1 2 2 72
2 7
15 27 32 1539 3927 59 32
50 39
57 48 43 3922 3259 42 50
41 57
49 58 34 4857 2543 31 22
25 32 42 41
COVID-19 death certificate, Part 2 1 1 1 21 3 24 8 3 4 144 5 8
11 6 47 5 14 6 65 10 11
9 10 64 8 7 8 45 8 67 6 10 9
Non-COVID-19 deaths 295228 297
295 228 275 297
311 291275
300 311276
246 291
316 311 300
296 332246
302 276261
299 316
270 312 311
341 333296
348 332 329
349 302
331 299 261 270
Average deaths (previous 5 years) 250 262
250 262 285 285
282 273 282
271 279 273250
270 271
288 279
282 296 270
294 314 250304
290 288
302 282
315 320 296
339 322 294 346
344 314
345 290 304 302
Total deaths (2021P) 298231 306
298 231 293 306
342 331293
343 342340
299 331
377 374 343
351 380299
330 340313
337 377
320 371 374
403 375351
413 380 368
378 330
363 337 313 320
Source: Northern Ireland Statistical Research Agency (NISRA)
39COVID-19 Weekly Epidemiological Bulletin Up to week 52 (02 January 2022)
All-cause excess deaths
500
450
400
350
300
250
200
150 Number of deaths Number of deaths (corrected) Baseline Upper 2 z score limit
100
50
0
Figure 23. Weekly observed and expected number of all-cause deaths in all
ages, week 40 2017 - week 50 2021
In 2020, excess all-cause deaths were reported in epidemiological
weeks 13 to 20, week 22 and 45. During 2021, excess deaths were
reported in week 2 (11 – 17 January), in week 36 (06 – 12 September),
and in week 48 (29 Nov – 05 December), particularly in those aged 65+.
This increase in deaths happened outside the influenza season and at a
time when we know flu was not circulating (here).
While these more recent excesses have occurred within the flu season,
reports show flu was not widely circulating. This suggests the excess
mortality may in part be related to COVID-19 deaths and to a fall in
presentation to hospital with other conditions (data not shown). Excess
deaths were mainly in those over 65 years, which is in line with the age
profile of COVID-19 deaths. Despite delay correction, reported mortality
data are still provisional due to the time delay in registration and
observations which can vary from week to week; not all registrations for
the current week will have been included this bulletin.
40COVID-19 Weekly Epidemiological Bulletin Up to week 52 (02 January 2022)
Virology testing surveillance
Total individuals tested include those that were reported as indeterminate
Figure 24. Weekly number of individuals tested for COVID-19 and proportion
positive, by source (HSC Laboratory testing and the National Testing
Programme), 2021
41COVID-19 Weekly Epidemiological Bulletin Up to week 52 (02 January 2022)
Table 11. COVID-19 activity in Northern Ireland, for all testing data combined,
week 52, 2021
Individuals Proportion
Period Number positive
tested positive
Current week 105,750 50,581 47.8%
Total 2,047,024 349,622 17.1%
Table 12. COVID-19 activity in Northern Ireland (HSC laboratory), week 52,
2021
Proportion
Period Individuals tested Number positive
positive
Current week 10,199 1,372 13.5%
Total 412,900 16,605 4.0%
Table 13. COVID-19 activity in Northern Ireland (National Testing
Programme), week 52, 2021
Proportion
Period Individuals tested Number positive
positive
Current week 95,551 49,209 51.5%
Total 1,634,124 333,017 20.4%
Source: HSC Trust laboratory reports and the National Testing Programme
From 01 January 2021 to 02 January 2022 (week 52), the total number
of individuals tested was 2,047,024 and positivity was 17.1%. Overall,
more individuals have now been tested as part of the National Testing
Programme, and positivity is now higher (20.4%) compared to HSC
laboratories (3.7%).
42COVID-19 Weekly Epidemiological Bulletin Up to week 52 (02 January 2022)
Global situation
As of 04 January, WHO has been notified of 290,959,019 confirmed
cases of COVID-19, including 5,446,753 related deaths.
Appendix
PHA Health Protection COVID-19 surveillance systems
The PHA Health Protection Directorate has established the following
surveillance systems to monitor COVID-19 activity across the spectrum
of community and heath care settings. As new systems are developed
they will be added to this report.
Case epidemiology
SARS-CoV2 testing was first developed by the National Reference
Laboratory (Public Health England) for all of the United Kingdom on 24
January 2020. On 7 February 2020, SARS-CoV2 testing was developed
locally by the Regional Virus Laboratory, Belfast Health and Social Care
(HSC) Trust and performed testing across NI. Since 23 March, 28
March, 3 April and 13 May respectively, Northern HSC Trust, Southern
HSC Trust, Western HSC and South Eastern HSC Trust laboratories,
have been performing SARS-CoV2 testing.
The PHA Health Protection Directorate laboratory surveillance system
collates SARS-CoV2 laboratory data on all tests from HSC Trust
laboratories.
As an individual may have more than one test for clinical purposes, the
laboratory data is then collated to enable monitoring of individuals rather
than tests performed by laboratories. This is done using the Organism-
Patient-Illness-Episode (OPIE) principle, a standard approach used
across the UK.7 The episode length used nationally is 6 weeks (42
days), and is being reviewed as more data becomes available.
7
Public Health England. 2016. Laboratory reporting to Public Health England: A guide for diagnostic laboratories.
[ONLINE] Available at:
https://assets.publishing.service.gov.uk/government/uploads/system/uploads/attachment_data/file/739854/PHE_
Laboratory_Reporting_Guidelines.pdf. [Accessed 21 April 2020]
43COVID-19 Weekly Epidemiological Bulletin Up to week 52 (02 January 2022)
If an individual is infected on two separate occasions by the same
organism (within the episode of infection) they will be represented by
one distinct record. It is still unclear to what extent second infections
occur in COVID-19. The exception to this is where the first result is
negative and is then followed by a positive result on a second occasion.
In such circumstances, the later positive result will be recorded rather
than the earlier negative one. If an individual is infected on two separate
occasions by the same organism (outside the episode of infection with
recovery implied) they will be represented by two distinct records,
regardless of the test result. This is a standard approach which is taken
across a range of infectious diseases.
All laboratories report a standardised data set which includes individual
demographics, test result and source (location) at the time the specimen
was taken. Data are collated to produce information on the number and
trend of individuals tested at HSC Trust laboratories and the number and
trend of confirmed cases in NI.
National Testing Programme
The National Testing Programme in NI consists of drive through
(regional test sites), mobile test unit sites, home testing and satellite
testing of nursing homes.
Everyone in NI with symptoms of COVID-19 is eligible for testing. Close
contacts of COVID-19 positive individuals will also be contacted to book
a test.
Testing is prioritised through the website gov.uk for essential workers
who are self-isolating because they are symptomatic, or have household
members who are symptomatic, to help enable essential workers to
return to work as soon as safe.
Testing is available for the general public through the website nhs.uk.
The StopCOVID NI contact tracing app is now available from the Google
or Apple App store.
Testing for non-HSC essential workers and the general public is
currently conducted in drive-through sites operating in Belfast,
44COVID-19 Weekly Epidemiological Bulletin Up to week 52 (02 January 2022)
Enniskillen, Craigavon, Derry/Londonderry and Antrim. In addition there
are also mobile testing units currently operating within NI, and walk
through test sites operating in Omagh, Newry, Lisburn, Ballymena and
on Ulster University and Queen’s University campuses.
Home testing can be requested by any individual meeting the criteria
with a test kit(s) being mailed to the individual and household contacts.
Tests are processed in laboratories outside the normal health and social
care network and data fed back to the Public Health Agency via the
Business Services Organisation.
The data has been included in the case epidemiology and virology
testing surveillance sections. These data should be interpreted with
caution when interpreted alongside the HSC laboratory data, because
they include testing undertaken as part of the outbreak response i.e.
possibly asymptomatic people with a certain age, gender or area profile.
Testing numbers may be skewed to different local government districts
depending on whether an outbreak was detected and managed.
For more information, see here.
Care home outbreak surveillance
Care home is a term that includes all nursing homes and residential
homes in Northern Ireland that are registered with the Regulation and
Quality Improvement Agency (RQIA) and can either be HSC Trust or
independently owned. There are 476 active care homes in NI.
All care homes have a requirement to notify the PHA Health Protection
duty room of suspected outbreaks of any infectious disease. A
suspected outbreak of COVID-19 occurs when two or more residents
and/or staff meet the case definitions for suspected COVID-19,
confirmed COVID-19, influenza-like illness or worsening shortness of
breath.
The PHA Health Protection Directorate care home outbreak surveillance
system collects and collates data on all initial notifications of suspected
COVID-19 outbreaks from the duty room clinical records.
45COVID-19 Weekly Epidemiological Bulletin Up to week 52 (02 January 2022)
The care home COVID-19 outbreak surveillance system is updated
every day to reflect public health management. If the risk assessment
subsequently excludes an outbreak of the initial notification then the
surveillance data will be updated.
Primary care surveillance
Sentinel testing
The GP sentinel testing surveillance system builds on the existing flu
sentinel testing system where 36 general practices (‘spotter’ practices),
representing approximately 11% of practices across Northern Ireland,
are commissioned to carry out flu testing in suspected influenza-like
illness.
Individuals registered at a spotter practice with symptoms of suspected
COVID-19 and who are well enough to self-care in their own home are
referred to a Trust testing facility for testing. The service commenced in
13 spotter practices in Belfast and South Eastern HSC Trust locality at
the end of April and is currently being rolled out to the other 23 practices
in Northern, Southern and Western HSC Trust localities.
Laboratories reports from spotter practices are identified from the
laboratory (virology) surveillance and are collated to produce information
on the number of individuals tested and the number of confirmed cases.
Critical care surveillance
Until 28 September 2020, the PHA Health Protection COVID-19 critical
care online reporting system captured the incidence of COVID-19
infections in critical care and aims to improve the understanding of
severe disease.
This system should complement critical care data collected by the
Health and Social Care Board for service planning purposes and the
publicly available reports on COVID-19 in critical care NI by the Intensive
Care National Audit and Research Centre (iCNARC) (here).
Since 28 September 2020, data collection for critical care surveillance
has been streamlined to coincide with the well-established surveillance
46COVID-19 Weekly Epidemiological Bulletin Up to week 52 (02 January 2022)
of influenza patients in critical care in conjunction with the Critical Care
Network Northern Ireland (CaNNI).
Data is collected on all individuals admitted to an Intensive Care Unit
(ICU) or High Dependency Unit (HDU) with a positive COVID-19 result,
from either before or during the ICU/HDU admission.
Mortality surveillance
Medical Certificate of Cause of Death for confirmed/suspected
COVID-19
The traditional method for examining the number of deaths, and the
range of causes of death, takes information from death certificates that
are reported to the General Registrar’s Office (GRO). The death
certificate contains two parts. Part 1 describes the immediate causes of
death and Part 2 provides information on related conditions that may
also have contributed to death. The numbers of deaths from COVID-19
are based on COVID-19 being recorded on any part of the death
certificate (i.e. Part 1 or Part 2).
These include all deaths in which a doctor feels that COVID-19 was
either a direct or indirect cause of death. It includes confirmed cases
(deaths with a positive laboratory result) and probable or suspected
cases, where a doctor assesses that COVID-19 was a cause of death
but there is either no lab test or the test was negative. It captures deaths
in all settings, such as hospitals, care homes, hospices and the
community. It takes up to five days for most deaths to be certified by a
doctor, registered and the data processed, meaning these deaths will be
reported on about a week after they occurred.
Inclusion of references to COVID-19 in Part 2 of the death certificate
may slightly over estimate the number of individuals where COVID-19 is
a significant contributor to death.
All-cause excess deaths
The PHA Health Protection Directorate reports the weekly number of
excess deaths from any cause for NI using the Mortality Monitoring in
Europe (EuroMOMO) model. EuroMOMO provides a coordinated, timely
and standardised approach to monitoring and analysing mortality data
47COVID-19 Weekly Epidemiological Bulletin Up to week 52 (02 January 2022)
across the UK and Europe, to ensure that signals are comparable
between countries. Further information is available here.
Based on mortality data supplied by NISRA, EuroMOMO produces the
number of expected and observed deaths every week, corrected for
reporting delay and standardised for the population by age group and
region. Excess mortality is reported if the number of observed deaths
exceeds the number of expected deaths, and is defined as a statistically
significant increase in the number of deaths reported over the expected
number for a given point in time.
Case definitions
Case definitions are determined by Public Health England, on the advice
of the New and Emerging Respiratory Virus Threats Advisory Group
(NERVTAG). As the pandemic evolves and more evidence emerges the
definitions will change to ensure individuals are appropriately identified.
Possible case of COVID-19 (as of 28 September 2020)
As of 02 October, case definitions for inpatient and community settings
were consolidated into one list. Unusual presentations are also
highlighted.
Individuals with
new continuous cough OR
high temperature OR
a loss of, or change in, normal sense of smell (anosmia) or taste
(ageusia)
Individuals with any of the above symptoms but who are well enough to
remain in the community should follow the stay at home guidance and
get tested.
Clinicians should be alert to the possibility of atypical presentations in
patients who are immunocompromised.
Alternative clinical diagnoses and epidemiological risk factors should be
considered.
48COVID-19 Weekly Epidemiological Bulletin Up to week 52 (02 January 2022)
A wide variety of clinical symptoms have been associated with COVID-
19.
Patients with acute respiratory infection, influenza-like illness, clinical or
radiological evidence of pneumonia, or acute worsening of underlying
respiratory illness, or fever without another cause should have a COVID-
19 test, whether presenting in primary or secondary care.
In addition, the following situation should prompt clinicians to consider
COVID-19 testing:
Onset of delirium (acute confusion) in older people, or in those with
dementia or cognitive impairment. New infections in people with
dementia may manifest as delirium.
Confirmed case of COVID-19
An individual with clinical symptoms and a positive SARS-CoV2
specimen result.
Critical care COVID-19 case
A case that has either been admitted to an ICU/HDU in NI with a pre-
existing positive result for SARS-CoV2, or received a positive result for
SARS-CoV2 post-admission to ICU/HDU.
Influenza-like Illness (ILI)
Acute respiratory disease with sudden onset of symptoms and:
at least one systemic symptom (fever ≥37.8°C, myalgia, malaise,
headache) AND
at least one respiratory symptom: cough (with or without sputum),
shortness of breath (and/or wheezing), sore throat, nasal
discharge, sneezing or congestion
Further Information
This bulletin is produced by the Health Protection Surveillance Team on
behalf of the Director of Public Health. Correspondence should be
directed to: Dr Stephen Bergin, Acting Director of Public Health, Public
49COVID-19 Weekly Epidemiological Bulletin Up to week 52 (02 January 2022)
Health Agency, 12 – 22 Linenhall Street, Belfast, BT2 8BS. Email:
Stephen.Bergin@hscni.net .
© Public Health Agency: 05 January 2022.
50You can also read