Measuring Access and Egress Distance and Catchment Area of Multiple Feeding Modes for Metro Transferring Using Survey Data
←
→
Page content transcription
If your browser does not render page correctly, please read the page content below
sustainability

Article
Measuring Access and Egress Distance and Catchment Area
of Multiple Feeding Modes for Metro Transferring Using
Survey Data
Xia Li, Zhenyu Liu and Xinwei Ma *

                                          School of Civil and Transportation Engineering, Hebei University of Technology, Tianjin 300401, China;
                                          diyilixia@126.com (X.L.); lzy13920014892@163.com (Z.L.)
                                          * Correspondence: xinweima@hebut.edu.cn

                                          Abstract: Multiple feeding modes, including walking, bus, private bike, docked bike-sharing, private
                                          electric bike (e-bike), car, and taxi, are applied for better accessibility in a metro-based trip. It is
                                          crucial to understand their access/egress distances and corresponding catchment areas of metro
                                          stations. This paper determines these two distances and accessible areas of stations for different
                                          feeding modes based on Nanjing Population Survey data and GIS data by using a network-based
                                          approach in Nanjing, China. Considering the distribution of access/egress distance, regression
                                          models are established for the exploration of the threshold of distance to delineate catchment areas.
                                          What is more, the spatio-temporal characteristics of multiple feeding modes are analyzed. The results
                                          indicate that the average feeding distance of walking is the shortest, but docked bike-sharing has the
                                          shortest average feeding time, about 8 min. The average feeding time of private e-bikes is close to
                                          that of the private bike, but the feeding distance of private e-bikes is about 1.3 times as long as that of
                                          private bikes. Moreover, the origin of an over-10 km transfer for accessing metro stations is usually
                                far away from metro lines and the transferring station is mostly the terminal station. Generally, longer
                                   access distance means larger catchment area but the result is also influenced by the condition of street
Citation: Li, X.; Liu, Z.; Ma, X.         network. Moreover, catchment areas for the same feeding modes are different between urban and
Measuring Access and Egress               suburban areas.
Distance and Catchment Area of
Multiple Feeding Modes for Metro
                                          Keywords: multiple feeding modes; metro; access distance; egress distance; catchment area
Transferring Using Survey Data.
Sustainability 2022, 14, 2841.
https://doi.org/10.3390/su14052841

Academic Editor: Marilisa Botte           1. Introduction
Received: 12 January 2022                       Metro has become a promising means for alleviating congestion and mitigating envi-
Accepted: 23 February 2022                ronmental issues caused by automobiles [1]. In the last decade, rapid development of metro
Published: 28 February 2022               has been taking place at an unprecedented pace in China, impelled by economic progress
                                          and urbanization. Regarded as a sustainable travel mode, metro usually does not provide
Publisher’s Note: MDPI stays neutral
                                          door-to-door service to travelers [2]. In general, a metro-based urban trip consists of at
with regard to jurisdictional claims in
                                          least three segments: an access segment from origins to metro stations, an in-metro seg-
published maps and institutional affil-
                                          ment, and an egress segment from stations to final destinations, involving transfers among
iations.
                                          multiple modes [3]. The integration of metro with other feeding modes usually enhances
                                          the accessibility of metro-based trips. Deep understanding of access/egress distances and
                                          catchment areas for different feeding modes is required for seamless connection between
Copyright: © 2022 by the authors.         metro and other modes. At the same time, determining access distances, egress distances,
Licensee MDPI, Basel, Switzerland.        and catchment areas of metro stations for multiple feeding modes helps formulate targeted
This article is an open access article    strategies to improve walking-related facilities, adjust bus lines, locate docked bike-sharing
distributed under the terms and           points, and tap the potential of mode shift for car users [4,5].
conditions of the Creative Commons              Therefore, in order to reflect the difference of multiple feeding modes, including walk-
Attribution (CC BY) license (https://     ing, bus, private bike, docked bike-sharing, private e-bike, taxi, and car on access/egress dis-
creativecommons.org/licenses/by/          tances and corresponding catchment areas for metro stations, this study mainly focuses on:
4.0/).

Sustainability 2022, 14, 2841. https://doi.org/10.3390/su14052841                                        https://www.mdpi.com/journal/sustainability
Sustainability 2022, 14, 2841                                                                                            2 of 16

                                •    Calculating network-based access/egress distance and further determining the thresh-
                                     old to depict the service area by using the regression model for every mode;
                                •    Comparing the transferring distances, corresponding spatio-temporal characteristics,
                                     and accessible areas for multiple feeding modes based on visualization.
                                     The remainder of this paper is structured as follows: First, we review access/egress
                                distances and catchment areas of metro stations for different feeding modes in Section 2.
                                Next, study area, data source, and the methods employed are given in detail in Section 3.
                                In Section 4, the comparison of access/egress distances and catchment areas of metro for
                                these feeding modes are presented, and analysis of spatio-temporal characteristics is also
                                covered. Finally, we draw a conclusion and make an outlook for this paper.

                                2. Literature Review
                                      This section provides a comprehensive review of works related to this topic. To date,
                                most research on the access/egress distances and catchment areas of metro stations can be
                                categorized into three areas: integration of metro with walking, integration of metro with
                                private bike, docked bike-sharing, and private e-bike, and integration of metro with bus,
                                car, and taxi.

                                2.1. Integration of Metro with Walking
                                      Walking is regarded as the most important mode to complete a trip based on metro [6].
                                However, the upper limits for passenger walking distance are different between metro
                                stations across the entire system and different cities [7]. Walking distances ranging from
                                300 m to 800 m are considered as the commonly accepted walking distances to metro
                                stations [8,9]. Kuby et al. assigned a fixed value of 800 m for walking access distance, which
                                is the standard walking distance used to delimit catchment areas of metro station in most
                                transit research [10,11]. A transit access survey including revealed and stated information,
                                and Rastogi et al. reported that walking mode is dominant within an access distance of
                                1250 m, with an average distance of 910 m for different categories of commuters in Mumbai,
                                India [12]. Several studies concentrated on predicting walking access/egress distance by
                                means of regression analysis. For instance, Wang et al. not only obtained 657 m and 1092 m
                                as the mean and 85th percentile value of egress distance, respectively, in Minneapolis
                                and St. Paul metropolitan area, but also adopted Poisson models to explore the effects of
                                building environments on egress distance [3]. Another research carried out in Nanjing,
                                China, estimated the mean walking distance for accessing different metro station contexts
                                as 882 m for common stations, 682 m for transfer ones, 1291 m for terminal stations, 848 m
                                for underground ones, and 1031 m for elevated metro stations [13].

                                2.2. Integration of Metro with Private Bike, Bike-Sharing, and E-Bike
                                      A marriage between bike and metro presents new opportunities for sustainable trans-
                                portation [14]. The integration of bike and metro transit helps overcome the demerits of
                                metro, for example, to solve the last-mile issue [15]. In terms of the threshold distance of
                                cycling to metro stations, Taylor et al. concluded a bike access distance of 2.4 km through
                                a stated preference survey [16]. A more accurate assessment of bike access distance con-
                                ducted in the Los Angeles and Atlanta regions illustrated that the average cycling distance
                                for Atlanta is 1730 m, which is significantly different from that of 4436 m in the Los Angeles
                                area [17]. Lee et al. chose the 85th percentile value of the access distance as the bike access
                                distances of 1.96 km for origin (home)-to-station trips and 2.13 km for station-to-work trips
                                using regression and cumulative distribution models [18]. Notably, some studies focused
                                on the incorporation of bike-sharing system and metro. Cheng et al. used the multinomial
                                logit model to determine changes in metro service coverage after the launch of bike-sharing
                                system and found that the coverage expands in Kaohsiung [19]. Research presented by
                                Ma et al. estimated that 10% increase of Capital Bikeshare ridership will contribute to a
                                2.8% increase in Metrorail ridership in Washington, D.C. [20]. In addition, private e-bikes
                                have been recently deemed as an independent mode in daily travels rather than a feeder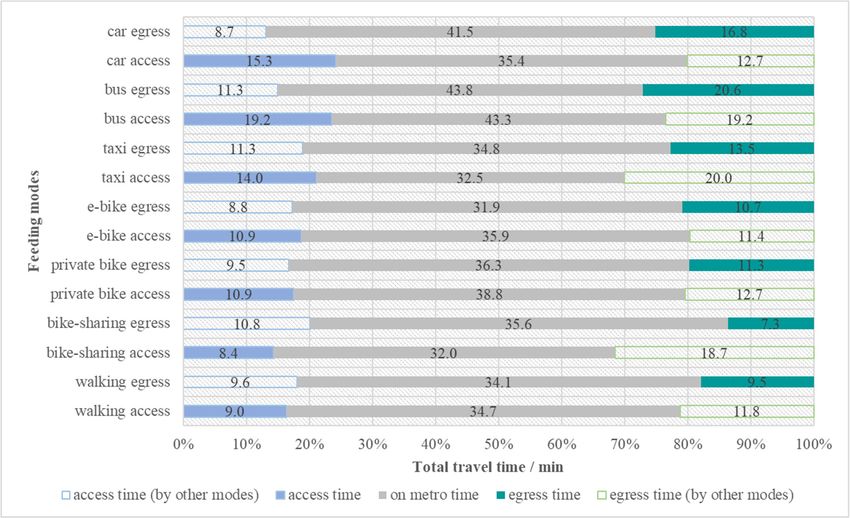
Sustainability 2022, 14, 2841                                                                                            3 of 16

                                mode to metro. For one part, private e-bikes make it possible to substitute motorized
                                modes when the distance is perceived to be too long for regular bikes [21]. For another
                                part, unlike conventional bikes, private e-bikes requires fewer physical efforts for a higher
                                speed to cover longer distance [22]. As for travel distance, Plazier et al. found that private
                                e-bikes, which can provide a good alternative to the use of a car, covers an average of
                                14.1 km in commuting [23]. Talamini and Ferreira found that e-bike taxicab service can
                                enlarge the catchment area of the transit system and thus reduce the social exclusion of
                                rural enclaves in the city [24]. Using dockless bikeshare trajectory data, Lin et al. found
                                that the average size of bike-sharing catchment increases from 4.34 km2 (inner zone) to
                                7.26 km2 (suburban zone) and the sizes of the bike-sharing catchment were positively
                                associated with good metro service and frequent morning trips [25]. Recently, Guo et al.
                                used 100 m buffer for the measurement of the integration of dockless bike-sharing and
                                metro access/egress [26]. They found that the majority of access/egress feeding trips had a
                                distance range of 500–2000 m. In addition, they suggested that the shared bikes are better
                                to put with a priority at the area immediately adjacent to metro stations (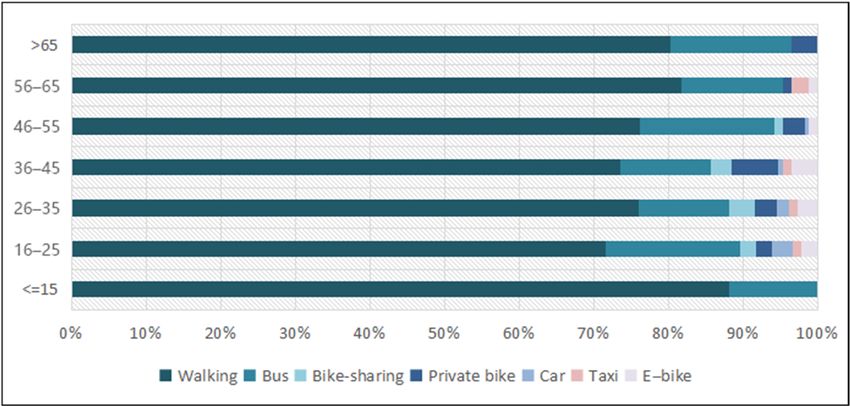
Sustainability 2022, 14, x FOR PEER REVIEW 4 of 16
Sustainability 2022, 14, 2841 passengers’ choice of transfer modes. To combine the advantages of metro and other 4feed- of 16
ing modes, a better understanding of the access/egress distances and corresponding catch-
ment areas is necessary. Therefore, this paper attempts to fill the research gaps by figuring
out the characteristics of multiple feeding modes on access/egress distances and catch-
Therefore, this paper attempts to fill the research gaps by figuring out the characteristics of
ment areas in Nanjing, China.
multiple feeding modes on access/egress distances and catchment areas in Nanjing, China.
3. Methodology
3. Methodology
3.1. Study Area
3.1.
Nanjing, as the capital of Jiangsu Province, China,
Nanjing, China, covers
covers anan area
area of of 6, 587km
6587 km22 with
with
aa total
total population
population of of 8.33
8.33 million
million [35].
[35]. In the last twotwo decades,
decades, it has,
has, along
along withwith other
other
Chinese metropolises,
Chinese metropolises, witnessed
witnessed sustained
sustained andand rapid
rapid urbanization,
urbanization, economic
economic growth,
growth, andand
motorization. Nanjing
motorization. Nanjing hashas aa huge
hugeand andcomplex
complexurbanurbantransportation
transportationsystem,
system,wherewheremulti-
mul-
tiple
ple modesofoftransport
modes transportinteract
interactwith
witheach
eachother.
other.They
Theymainly
mainlyinclude
includemetro,
metro,bus,bus, private
private
bike, docked
bike, docked bike-sharing,
bike-sharing, private e-bike, walking, car, and and taxi.
taxi. To adapt
adapt to to increasing
increasing
urban
urban growth
growthand andmeet
meettravel
traveldemand,
demand,the theNanjing
Nanjing Metro
Metro has opened
has opened 11 11operating
operating lines as
lines
of
as December
of December 2021, a total
2021, of 191
a total of stations [36]. [36].
191 stations These lines,lines,
These coupled with over
coupled with 700overbus700lines,
bus
constitute a powerful
lines, constitute public traffic
a powerful publicnetwork [37]. Besides,
traffic network robust use
[37]. Besides, of private
robust use ofe-bikes
private and
e-
conventional bikes thanksbikes
bikes and conventional to thethanks
city’s plain
to thetopography
city’s plainalso helps meetalso
topography the helps
travel meet
demand the
to a great
travel extent.to a great extent.
demand
Figure
Figure 11displays
displaysthethestudy
studyarea
areaofof
this paper,
this thethe
paper, light blue
light region
blue is the
region is main districts
the main dis-
of Nanjing, and the downtown refers to the area inside the inner ring
tricts of Nanjing, and the downtown refers to the area inside the inner ring of Nanjing. of Nanjing. Since
the
SinceNanjing Metro Metro
the Nanjing openedopened
6 metro6 lines
metrowhenlinesthe datathe
when was collected
data in 2015, in
was collected the2015,
current
the
research will determine
current research the access/egress
will determine distances
the access/egress and catchment
distances areas of metro
and catchment areas of stations
metro
along these
stations lines
along overall.
these lines overall.
Figure 1.
Figure 1. Illustration
Illustration of
of study
study area.
area.
3.2.
3.2. Data
Data Collection
Collection
In this paper, the
In this paper, therequired
requireddata
datamainly
mainly includes
includes Nanjing
Nanjing Population
Population Survey
Survey datadata
and
and GIS data of Nanjing, provided by Jiangsu Institute of Urban Planning
GIS data of Nanjing, provided by Jiangsu Institute of Urban Planning and Design and and Designthe
and the Jiangsu
Jiangsu InstituteInstitute
of UrbanofTransport
Urban Transport
Planning. Planning.
The surveyThewas
survey was conducted
conducted from
from Tuesday
Tuesday
to Thursdayto Thursday for two
for two weeks weeks
(16–18 (16–18
June, June,
23–25 23–25
June) June)and
in 2015, in 2015, andfiles
the data the data files
comprise
comprise personal information,
personal information, householdhousehold information,
information, and traveland travel information,
information, a total ofa 162,190
total of
162,190
trips. To measure access/egress distances and catchment areas of metro stations for
trips. To measure access/egress distances and catchment areas of metro stations for
multiple feeding modes, we picked the travel data with origin–metro station–destination
travel pattern and corresponding personal data, a total of 2891 trips. The data in detail
contains the following information: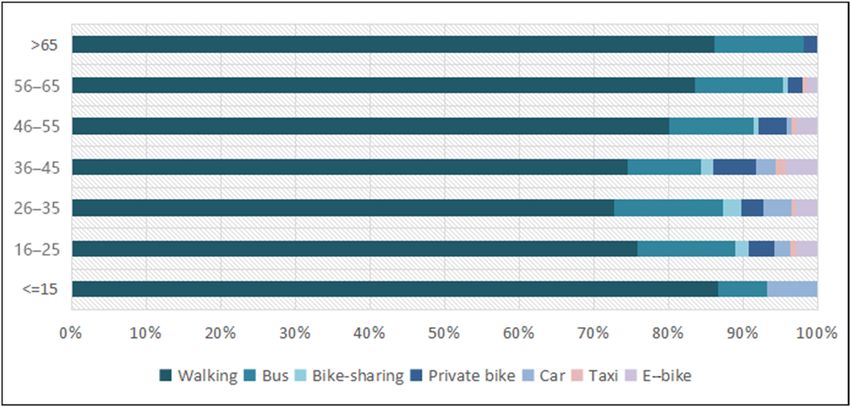
Sustainability 2022, 14, x FOR PEER REVIEW 5 of 16
multiple feeding modes, we picked the travel data with origin–metro station–destination
travel pattern and corresponding personal data, a total of 2891 trips. The data in detail
Sustainability 2022, 14, 2841 5 of 16
contains the following information:
• Trip data, including the longitude and latitude of origin and destination; the name of
aligned metro station; feeding modes and corresponding transferring time consump-
• Trip data, including the longitude and latitude of origin and destination; the name of
tion.
aligned metro station; feeding modes and corresponding transferring time consumption.
• Personal data, including gender; age; education; income, etc.
• Personal data, including gender; age; education; income, etc.
It should be pointed out that the initial travel data, which is used for the analysis of
It should be pointed out that the initial travel data, which is used for the analysis of
transfer mode share, includes 2891 access segments, while only 1706 egress segments are
transfer mode share, includes 2891 access segments, while only 1706 egress segments are
due to the lack of feeding modes documented in the egress phase. To measure the access
due to the lack of feeding modes documented in the egress phase. To measure the access
or egress distance for different feeding modes, some ambiguous data that has no exact
or egress distance for different feeding modes, some ambiguous data that has no exact
names of transferred metro stations is excluded and the remaining data contains 1468 trips
names of transferred metro stations is excluded and the remaining data contains 1468 trips
of access and 1125 trips of egress.
of access and 1125 trips of egress.
In addition,
In addition, the
the GIS
GIS data
data obtained
obtained includes
includes geographic
geographic information
information of
of street
street network,
network,
6 metro lines, and all the positions of metro stations. A later section uses aforementioned
6 metro lines, and all the positions of metro stations. A later section uses aforementioned
data for
data for the
the analysis
analysis of
of access/egress
access/egress distance
distance and
and catchment
catchment area.
area.
3.3. Access/Egress
3.3. Access/Egress Distance
Distance Calculation
Calculation
Both Euclidean
Both Euclideandistance
distanceandandnetwork-based
network-baseddistance
distance can
can bebe obtained
obtained byby ArcGIS
ArcGIS us-
using
ing geocoded data of origins and destinations. As the Euclidean distance
geocoded data of origins and destinations. As the Euclidean distance does not cover detours, does not cover
itdetours, it isthan
is shorter shorter
the than the distance
distance people
people travel totravel to access/egress
access/egress the metro thestations
metro stations in
in actual
actualnetwork.
street street network. Therefore,
Therefore, a network-based
a network-based approach approach is adopted
is adopted in thisby
in this paper paper
way byof
way of Network
Network AnalystAnalyst tool in ArcGIS.
tool in ArcGIS. As Figure As 2Figure
shows, 2 this
shows, this method,
method, relying relying
deeply deeply
on the
on the integrity
integrity of street of street network,
network, is expectedis to
expected to find
find a path witha the
path with the
shortest shortest
distance distance
between an
between an origin/destination
origin/destination and a metroand a metro
station. station.that
Assuming Assuming
travelersthat
tendtravelers
to take tend to take
the shortest
path on street
the shortest network,
path thisnetwork,
on street path foundthisby thefound
path method by is regarded
the methodas is the actualas
regarded path
thethe
ac-
traveler
tual pathtakes.
the traveler takes.
Figure 2.
Figure 2. Paths
Paths of
of different
different feeding
feeding modes
modes generated
generatedon
onthe
thestreet
streetnetwork.
network.
After the calculation
After calculation of
of access
accessand
andegress
egressdistance
distanceofofevery
every trip, thethe
trip, threshold
thresholdof ac-
of
access/egress distance
cess/egress distance cancan be determined
be determined for different
for different feeding
feeding modes. modes. Generally,
Generally, the
the thresh-
threshold of access/egress
old of access/egress distance,distance,
which canwhich
covercan cover
most most
metro metro passengers’
passengers’ trips, as
trips, is deemed is
deemed
the 85thas the 85th percentile
percentile of the cumulative
of the cumulative distribution
distribution of access/egress
of access/egress distance
distance [1,3]. [1,3].
In other
In other most
words, words, most travelers
travelers are willing
are willing to or
to access access or egress
egress stationsstations by a certain
by a certain feeding feeding
mode
mode within the threshold.
within the threshold.
As for the method to estimate the threshold, an arrival cumulative percent graph was
initially presented by Hino et al. to estimate the spatial extent that people can reach to
accessible adjacent station area [38]. Based on this approach, Lee et al. revealed a clear
correlation between the cumulative arrival distribution of metro passengers and the distance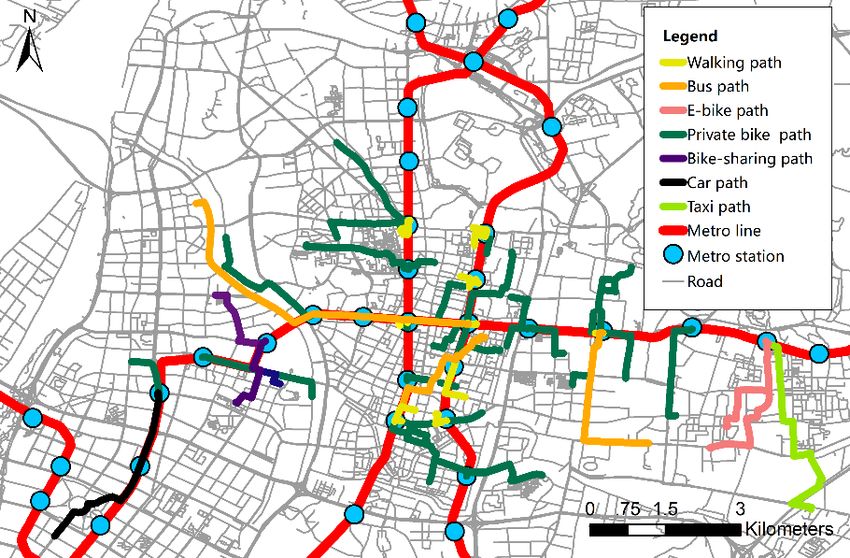
Sustainability 2022, 14, 2841                                                                                           6 of 16

                                from the station and obtained the 85th percentile value by using Quadratic regression and
                                Cubic regression later [18], which are respectively expressed as:

                                                                      y = α0 + α1 x1 + α2 x12                              (1)

                                                                  y = β 0 + β 1 x1 + β 2 x12 + β 3 x13                     (2)
                                where x1 is access distance, y is cumulative percent (%), while αi (i = 0, 1, 2) and β j ( j =
                                0, 1, 2, 3) are regression coefficients for Quadratic and Cubic model, respectively.
                                     In this paper, we adopt Lee’s method to establish Quadratic model and Cubic model for
                                multiple feeding modes in view of the non-linear distribution of access/egress distance re-
                                spectively [18], and then choose the better explanatory model to determine the 85th percentile
                                value of the both distances, meaning that the dependent variable y will be fixed as 85%.

                                3.4. Catchment Area Delineation
                                     By and large, two methods are widely applied for shaping catchment areas of metro
                                stations [4,13]. One, the circular buffer method, does not take into account the conditions
                                of roads and the other comes into being based on the street network. The former, which
                                is easier and labor-saving for us to get the results, covers areas that are not accessible
                                for multiple feeding modes, and thus may overestimate service areas compared with the
                                network-based method. Given the objective of this study, it is more reasonable to adopt the
                                second approach to obtain more precise data of catchment areas.
                                     Catchment areas of metro stations for multiple feeding modes are identified as the
                                areas that can be accessed by these modes, whose spatial boundaries are determined by the
                                corresponding distance threshold of every feeding mode. In general, the 85th percentile of the
                                access distance is widely accepted for catchment area delineation in relevant studies [1,17],
                                which is also employed in this paper. This value is estimated by the regression models
                                mentioned in the last section. Once the threshold is ascertained, the catchment area based
                                on street network can also be generated by ArcGIS. Moreover, the corresponding area of
                                these service areas can be then calculated. The process of catchment area delineation is
                                similar to the access/egress distance calculation on the network: first, the target metro
                                station is added to the network; then the service area boundary on the network is found
                                along every possible path on the network from a metro station. Additionally, a boundary
                                vertex is marked on the network taking the access distance as the cut-off length; when all of
                                the roads starting from the station experience a process like this, an out-of-shape catchment
                                area of the station is finally generated [4].

                                4. Results
                                4.1. Analysis of Personal and Travel Characteristics
                                     Demonstrated in Figure 3, the analysis for survey data reveals several distinctive
                                characteristics of metro passengers’ choice of transfer mode. Walking, as valid observations
                                show, is dominant in both access and egress stages, accounting for 71.22% and 69.6%,
                                respectively. This conclusion is consistent with the previous findings [4,39]. Following it
                                is the bus, which takes up 11.73% of access trips to metro and 13% of metro egress trips.
                                This result coincides with the finding from [40], in which the second most used access
                                mode for metro is bus. In this research, a distinction is made between private bike, docked
                                bike-sharing, and private e-bike. As Figure 3 shows, private bikes have a modest share at
                                3.32% and 3.1% for accessing and egressing stations. In Nanjing, private bikes are forbidden
                                to bring on the metro, so one private bike can only be chosen as the feeding mode for
                                one-way, accessing, or egressing. Besides, the weather during the survey implementation
                                was not very good, more than half time it was rainy, which had a certain negative impact
                                on the use of bicycles [40]. Docked bike-sharing, however, is not as popular as expected,
                                with the two shares at 1.56% for access and 2.2% for egress, respectively. This may be
                                because docked bike-sharing was just in its infancy when the survey was conducted in
                                2015. Specifically, it is visible through a larger docked bike-sharing use at egress than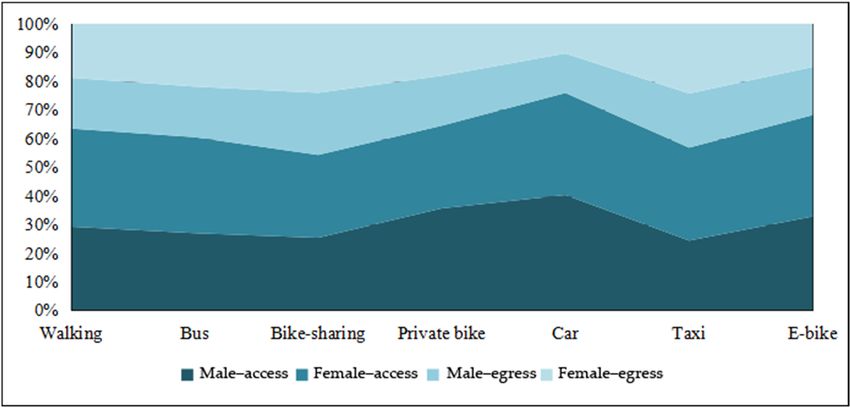
on the use of bicycles [40]. Docked bike-sharing, however, is not as popular as expect
with the two shares at 1.56% for access and 2.2% for egress, respectively. This may
because docked bike-sharing was just in its infancy when the survey was conducted
Sustainability 2022, 14, 2841 2015. Specifically, it is visible through a larger docked bike-sharing use at egress 7 of 16 than
cess. This situation may be caused by the convenience of bike-sharing use for egressi
metro. In Nanjing, docked bike-sharing stations are allocated at most metro statio
withinaccess.
300 This situation
m [41]. may be caused
Passengers by therent
can easily convenience
shared of bike-sharing
bikes use forthe
after exiting egressing
metro statio
metro. In Nanjing, docked bike-sharing stations are allocated at most metro stations within
Private e-bikes, which represent one of the fastest growing segments of the transport m
300 m [41]. Passengers can easily rent shared bikes after exiting the metro stations. Private
ket, for theirwhich
e-bikes, part,represent
are getting
one ofrising concerns
the fastest growingfrom the of
segments public [42]. They
the transport market,enjoy
for a high
sharetheir
than docked
part, bike-sharing
are getting of 2.66%
rising concerns from theinpublic
accessing metro,
[42]. They enjoywhile the
a higher share
share thanof the t
modes is nearly equal to each other in the egress phase. At the same time, perhaps co
docked bike-sharing of 2.66% in accessing metro, while the share of the two modes is nearly
equaltravel
sidering to eachcost,
otheronly
in theaegress
smallphase. At the same
percentage time, perhaps
of people considering
access/egress travelstations
metro cost, by
only a small percentage of people access/egress metro stations by car or taxi. Other choices,
or taxi. Other choices, mainly including motorcycles, e-bikes, taxicabs, and
mainly including motorcycles, e-bikes, taxicabs, and official cars, take up 6.50% of access
official ca
take up
trips6.50% of and
to metro access
7.7%trips to metro
of metro and 7.7% of metro egress trips.
egress trips.
0.73% 2.66% 6.50% 0.9% 2.1% 7.7%
2.28% Walking 1.2% Walking
3.32%
1.56% Bus 3.1% Bus
2.2%
Bike-sharing Bike-sharing
11.73% Private bike 13.0% Private bike
71.22% Car 69.6% Car
Taxi Taxi
E-bike E-bike
Others Others
(a) (b)
Figure 3. Distribution
Figure ofoftransfer
3. Distribution modeshares
transfer mode shares of accessing
of accessing (a)egressing
(a) and and egressing (b) station.
(b) station.
The distributions of transfer mode choice in both access and egress phases by gender
The distributions of transfer mode choice in both access and egress phases by gend
group and age group are depicted in Figure 4. In terms of different gender, the distribution
group of and agemode
transfer group are isdepicted
choice in Figurewith
basically consistent 4. Inthe
terms of different
previous distributiongender, the distrib
of transfer
tion of transfer
mode share. mode
Due tochoice is basically
the different consistent
sample sizes of access with
tripsthe
andprevious distribution
egress trips, it is unrea- of tra
sonable to compare the number of trips of the same gender
fer mode share. Due to the different sample sizes of access trips and egress in these two phases directly.
trips, it is u
Furthermore, the sample size of women was larger than that of men. Although there
reasonable to compare the number of trips of the same gender in these two phases direct
is no remarkable difference between males and females within the same feeding mode,
Furthermore,
compared withthe sample
women, size of women
men prefer to use was
privatelarger
bikesthan thatstations,
to access of men. Although
private e-bikesthere is
remarkable difference between males and females within the same
to egress stations, and to use cars in both feeding phases. According to (b) and (c), the feeding mode, co
pareddistribution
with women, of transfer
menmodepreferchoice
to by
useseven age groups
private bikesforto accessing station is similar
access stations, private to e-bikes
that for egressing station. Teenagers under 15 years old are more
egress stations, and to use cars in both feeding phases. According to (b) and (c), likely to choose walking to the dis
access and egress with metro. This is reasonable because they may have no personal bikes
bution of transfer mode choice by seven age groups for accessing station is similar to th
and e-bikes. Besides walking, they are also likely to take their parents’ car to access to the
for egressing station.
metro stations due toTeenagers
parents’ habitunder 15 years
of escorting their old are to
children more
schoollikely
in the to choose
morning walking
[43].
access and egress with metro. This is reasonable because they may have no personal bik
However, they choose buses instead of parents’ cars to egress to the metro stations due to
parents not
and e-bikes. havingwalking,
Besides time to escort
theythem. People
are also between
likely 26 and
to take 35 years
their old may
parents’ car prefer
to access to
riding a shared bike to metro stations or to destinations from stations than other age groups,
metro stations due to parents’ habit of escorting their children to school in the morni
while it seems that people who are at 35–45 would like to take their own bikes or private
[43]. e-bikes
However, they modes
as feeding choosecomparing
buses instead
to otherof
ageparents’ carspassengers
groups. Old to egressmainly
to thechoose
metro statio
due to parents
walking not having
to access and egress time
withto escort
metro, them.byPeople
followed bus andbetween 26 and
private bikes. 35 years
This finding is old m
reasonable because old travelers prefer healthy and economical travel
prefer riding a shared bike to metro stations or to destinations from stations than oth modes.
age groups, while it seems that people who are at 35–45 would like to take their own bik
or private e-bikes as feeding modes comparing to other age groups. Old passeng
mainly choose walking to access and egress with metro, followed by bus and priv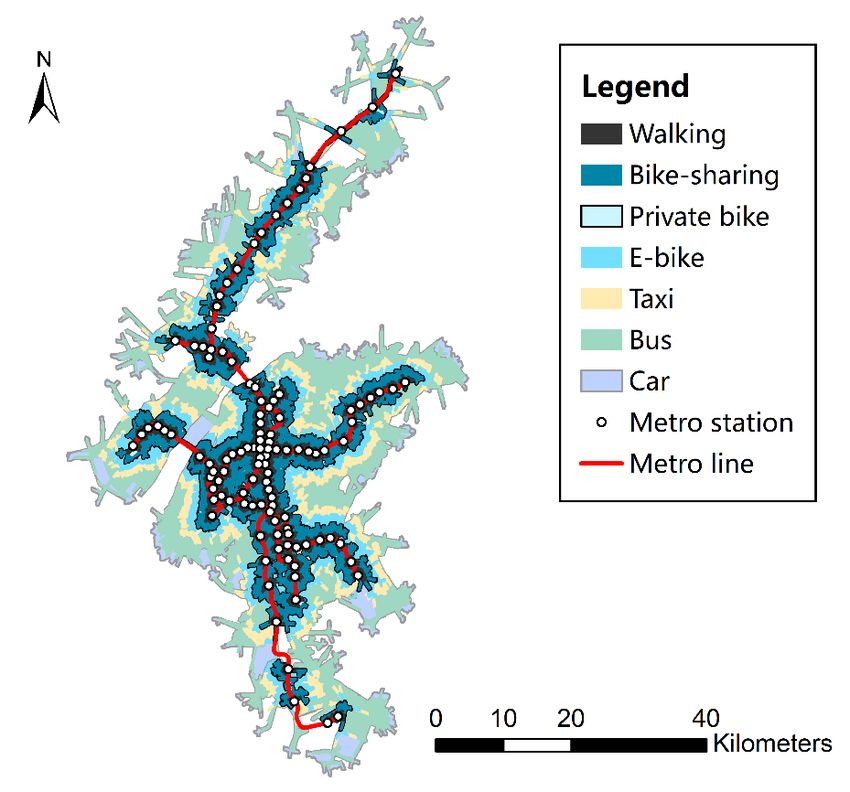
Sustainability 2022, 14, x FOR PEER REVIEW                                                                                    8 of 16

Sustainability 2022, 14, 2841                                                                                                  8 of 16
                                  bikes. This finding is reasonable because old travelers prefer healthy and economical
                                  travel modes.

                                 (a) Trip distribution of transfer mode choice of access and egress by gender.

                                     (b) Trip distribution of transfer mode choice of access by age groups.

                                     (c) Trip distribution of transfer mode choice of egress by age groups.
                                  Figure 4. Distribution of mode choice of access and egress by gender group (a), age group (b,c).
                                  Figure 4. Distribution of mode choice of access and egress by gender group (a), age group (b,c).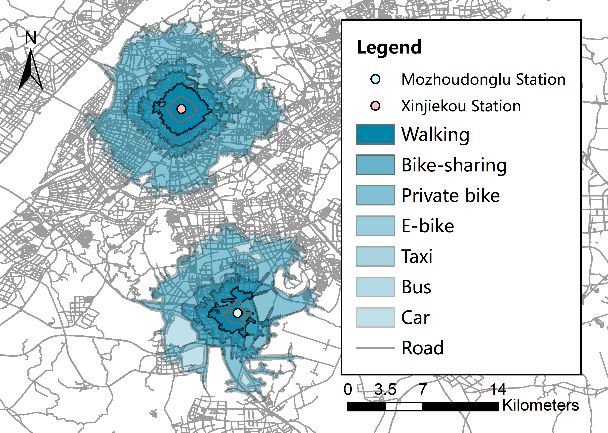
Sustainability 2022, 14, 2841                                                                                                                          9 of 16

                                          4.2. Access/Egress Distance of Metro Station
                                               The access distances and egress distances of metro stations on the basis of street
                                          network for each trip are calculated by GIS method. As mentioned, quadratic regression and
                                          cubic regression between the access distance x1 /egress distance x2 and cumulative percent
                                          y (%) are developed for multiple feeding modes in access and egress phases, and a better
                                          explanatory model is presented in Table 1. It can be concluded that the models displayed
                                          in the table obtain preferable performance with R2 greater than 0.95 and significance lower
                                          than 0.01, except for taxis in both phases. Despite a relatively small sample size, the
                                          significance of two distance models of taxi is still below 0.05, which is satisfactory as well.
                                          The purpose of establishing regression models is to find out the 85th percentile value of the
                                          cumulative distribution of the access/egress distance. By fixing the dependent variable y
                                          as 85 (%), the 85th percentile value of different feeding modes is calculated and the results
                                          are shown in Table 2.

                                          Table 1. Regression models of access and egress distance.

                         Feeding Mode                                       Regression Model                                              R2      Sig.
                                Walking                  y = −7.212 + 0.068x1 + 2.630 ×   105 x1 2     − 1.747 ×     108 x1 3            0.994   0.000
                      Docked bike-sharing                                                      2
                                                           y = 117.062 − 0.257x1 − 0.0002x1 − 3.272 ×            108 x1 3                0.986   0.000
                           Private bike                  y = 3.026 − 0.018x1 + 4.008 ×   105 x1 2    − 7.847 ×      109 x1 3             0.989   0.000
     Access               Private e-bike                y = −19.468 + 0.026x1 + 4.293 × 106 x1 2 − 9.877 × 1010 x1 3                     0.990   0.000
                                 Taxi                  y = −145.618 + 0.204x1 − 7.354 × 105 x1 2 + 8.564 × 109 x1 3                      0.970   0.015
                                 Bus                    y = −19.005 + 0.024 x1 − 1.735 × 106 x1 2 + 4.413 ×1011 x1 3                     0.987   0.000
                                 Car                    y = −12.547 + 0.022x1 − 1.654 × 106 x1 2 + 4.671 ×1011 x1 3                      0.985   0.000
                                Walking                 y = −9.005 + 0.090x2 − 1.793 × 106 x2 2 − 8.520 × 109 x2 3                       0.974   0.000
                      Docked bike-sharing               y = −53.019 + 0.083x2 − 1.619 × 105 x2 2 + 1.311 × 109 x2 3                      0.992   0.000
                           Private bike                 y = −14.261 + 0.032x2 + 9.282 ×     106 x2 2   − 2.471      ×109 x2 3            0.988   0.000
     Egress               Private e-bike                y = −30.122 + 0.061x2 − 1.072 ×     105 x2 2   + 7.190 ×     1010 x2 3           0.992   0.000
                                 Taxi                            y = −15.409 + 0.029x2 − 1.763 ×         106 x2 2                        0.920   0.021
                                 Bus                    y = −19.774 + 0.022x2 − 1.611×      106 x2 2   + 4.074   ×1011 x2 3              0.985   0.000
                                 Car                     y = 3.177 − 0.002x2 + 1.826×    106 x2 2   − 8.580   ×1011 x2 3                 0.960   0.000

                                          Table 2. Results of access and egress distance.

                                                 Access (m)                                                   Egress (m)
      Feeding Mode                                                               N                                                               N
                                        Mean            85th Percentile                                Mean              85th Percentile
          Walking                         784                 1255              955                     777                      1271            775
   Docked bike-sharing                    1809                2418               40                    1993                      2969            36
        Private bike                      1741                2469               63                    1761                      2470            39
       Private e-bike                     2423                3673               49                    2220                      3679            28
             Taxi                         3590                4785               21                    4467                      4955            16
              Bus                         4906                8097              206                    5739                      10506           157
              Car                         4910                8854               52                    7844                      10605           20

                                               The average access and egress distances of walking, docked bike-sharing, private
                                          bikes, and private e-bikes are almost identical. Relatively speaking, the egress distances
                                          of taxi, bus, and car are longer than that of their access distance due to different travel
                                          characteristics of individuals and different sample size in trip collection and distribution. It
                                          is not surprising that walking has the shortest distance among all feeding modes, with the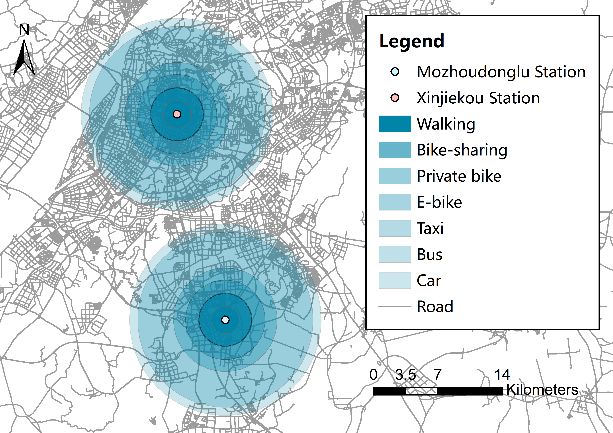
Sustainability 2022, 14, 2841                                                                                             10 of 16

                                mean value at 784 m and 777 m for access and egress, respectively, which is also in line with
                                the previous studies’ determination that 800 m is the standard walking distance to metro
                                station [11]. Following walking is cycling. The characteristics of docked bike-sharing and
                                private bike somewhat differs. From Table 2, it can be found that the average access and
                                egress distance of docked bike-sharing are both slightly larger than that of the private bike
                                due to the docking bike-sharing stations. As for private e-bikes, the advantages in speed
                                and physical exertion make the feeding distance longer than that of conventional bikes.
                                Besides, perhaps due to the fares and convenience concerns, the mean feeding distance of
                                taxi is not as long as that of car and the distribution of distance for taxi is more concentrated.
                                The average access and egress distances are 3590 m and 4467 m, respectively. At the same
                                time, car and bus share the similar mean distance in access phase. As for egressing metro
                                station, the mean distance of bus is shorter than car but its 85th percentile of egress distance
                                nearly equals to that of car. This indicates that car users may shift to bus if better bus
                                services are provided while accessing or egressing metro stations. The average detour
                                index, which represents the extent of detouring, is calculated by dividing total network
                                distance by total Euclidean distance [44]. For walking, the value is 1.32 for both access
                                and egress phases, which is between the recommended value of 1.2 and the maximum
                                value of 1.4 proposed by Vuchic et al. [45]. The average detour indexes of other feeding
                                modes are also within this range, indicating to some extent a relatively good street network
                                of Nanjing.

                                4.3. Analysis of Spatio-Temporal Characteristic for Multiple Feeding Modes
                                      In order to further understand the characteristics of multiple feeding modes, the
                                total travel time is analyzed as shown in Figure 5. The total travel time consists of three
                                parts, including the time from origin to metro station, the time on the metro (including
                                transferring time and waiting time), and the time from the metro station to destination.
                                A total of 1672 trips with complete travel time records are extracted and the mean value
                                of time consumption of different feeding modes for the three parts are calculated as well.
                                In general, the average total travel time for taking bus as a feeder mode is the longest,
                                and there is a similar conclusion in Yang’s research [30]. For the same mode, the average
                                time for accessing stations is similar to that for egressing stations, which is about 9 min
                                for walking, about 8 min for docked bike-sharing, and about 11 min for both private bike
                                and private e-bike, while the feeding distance of private e-bike is about 1.3 times as long
                                as that of private bike. As for taxi and car, the mean value is about 14 min and 16 min,
                                respectively. Besides, bus has the longest average feeding time, which is about 20 min. At
                                the same time, accessing or egressing stations by bus and car consumes more time in the
                                second phase, which is partly due to the inconvenience of transfers. For bus, it is possible
                                that the schedules are not effectively coordinated between bus and metro lines. Regarding
                                car, the parking facilities may not be well provided around metro stations. Moreover, in
                                terms of total travel time, most cases are less than one hour except when taking car and bus
                                as feeding modes. It is notable that bus requires more access and egress time, though the
                                average feeding distance is shorter comparing with car due to the multiple bus stops and
                                relatively slower speed [46], which implies that the efficiency of this kind of long-distance
                                travel needs to be improved.
tainabilitySustainability
2022, 14, x2022,
FOR14,
PEER
2841 REVIEW 11 of 16 11 of
Figure 5. Total
Figure travel
5. Total time
travel timefor
for multiple feeding
multiple feeding modes.
modes.
As shown
As shown in in Figure 6,
Figure 6, every
every1 1kmkm is considered
is considered as a grade,
as a then different
grade, thencategories
differentofcategor
access trips are divided according to access distance. Different sizes of circles indicate the
of access trips are divided according to access distance. Different sizes of circles indic
origin of access trips with different network-based distances. Similarly, there is some kind
the origin of accessfor
of characteristic trips with
egress different
phase, network-based
but further discussion is not distances.
given due Similarly, there is som
to the limitation
kind of
of the
characteristic
length of thisfor egress
paper. Thephase,
choice but further mode
of accessing discussion is not
is largely given due
influenced by theto the lim
accessibility of multiple feeding modes around the origin, and
tation of the length of this paper. The choice of accessing mode is largely influenced the short access trips occur
mostly in places around metro stations where the street network is denser, using walking,
the accessibility of multiple feeding modes around the origin, and the short access tr
docked bike-sharing, private bike, or private e-bike. A longer distance access is generally
occurachieved
mostlybyincar places
and bus,around
and themetro stations
origin with accesswhere
distance the street
greater thannetwork
10 km is is denser, usi
usually
walking, docked
far from bike-sharing,
the metro lines and theprivate bike,station
transferring or private
is mostlye-bike. A longer
the terminal distance
station of the access
generally
metro.achieved
It should be bynoted
car that
andsomebus,access
and thetripsorigin with access
with distances superiordistance
to 10 km greater than 10 k
start in the
vicinity of metro stations, and this situation can be explained by
is usually far from the metro lines and the transferring station is mostly the terminal s way of the corresponding
integrated metro stations not being the nearest ones. In light of the location of the origin of
tion of the metro. It should be noted that some access trips with distances superior to
long-distance access, two categories can be roughly divided—one is far away from metro
km start
lines,inbut
thethevicinity
surroundingof metro
streetstations, and this situation
network conditions are relatively can be explained
good, and the other byisway of t
corresponding
not only far integrated
away from metro metro stations
lines but also not being
located in the nearest
an area with ones. In light
lower street of the locati
network
of thedensity.
originWith the former, the focus
of long-distance access,is mainly on the improvement
two categories can be of bus service,
roughly such as
divided—one is
providing real-time information of bus line and adjacent metro station. Concerning the
away from metro lines, but the surrounding street network conditions are relatively goo
second category, more attention should be paid to whether the origin of access trips falls
and the other
within the is not of
range onlybus far away
stops. from
If there is metro lines but
no guarantee that also
a buslocated
service canin an area
fully meetwith low
streetthe
network
demand density.
of accessing With the former,
stations, the focus is mainly
then the corresponding transfer onmetrothestation
improvement
should of b
service, such as providing real-time information of bus line and adjacent metro statio
provide convenient transfer conditions for car users. A previous study has shown that lack
of parking
Concerning thefacilities
second around metro stations
category, is the primary
more attention cause be
should of the
paidinconvenience
to whether of the
car origin
transfer [47].
access trips falls within the range of bus stops. If there is no guarantee that a bus serv
can fully meet the demand of accessing stations, then the corresponding transfer me
station should provide convenient transfer conditions for car users. A previous study h
shown that lack of parking facilities around metro stations is the primary cause of t
inconvenience of car transfer [47].Sustainability 2022,14,
Sustainability2022, 14,2841
x FOR PEER REVIEW 12
12 of
of1616
Figure 6. Spatial distribution of access distance.
Figure 6. Spatial distribution of access distance.
4.4.Catchment
4.4. CatchmentAreaAreaofofMetro
MetroStation
Station
Insteadof
Instead of using
using a circular buffer
buffer to todelineate
delineatethe thecatchment
catchmentareas,areas, weweadopt
adoptan an
ap-
proach based on street network to estimate the accessible areas of
approach based on street network to estimate the accessible areas of metro stations by metro stations by mul-
tiple feeding
multiple modes
feeding modes[4]. As
[4].shown
As shownin Figure 7, the7,service
in Figure areas areas
the service of different feeding
of different modes
feeding
are marked
modes by different
are marked colors,colors,
by different and theanddetermination
the determination of boundaries
of boundaries of areas for each
of areas for
each
mode mode
is upis up to the
to the 85th
85th percentileofofaccess
percentile accessdistance.
distance. Generally,
Generally, longer
longer access
accessdistance
distance
means
meanslarger
largercatchment
catchmentarea, area,but
butthe
thepresented
presentedresult
resultisisalso
alsoaffected
affectedby bythe
thecondition
conditionofof
street
streetnetwork.
network.In Inthe
thefollowing
followingpicture,
picture,thethepart
partdrawn
drawnwithwiththethedeepest
deepestcolor
colorrepresents
represents
the
the catchment areas of metro-walking pattern, that is to say, most people couldwalk
catchment areas of metro-walking pattern, that is to say, most people could walktoto
access or egress stations willingly within this range. Docked bike-sharing
access or egress stations willingly within this range. Docked bike-sharing and private and private
bikes
bikesare
arerelatively
relativelyclose
closeinindistance,
distance,thus
thusthe
thedifference
differenceininservice
servicearea
areaisisless
lessobvious.
obvious.TheThe
catchment
catchmentarea areaofofbus
busalmost
almostoverlaps
overlapsthat thatprovided
providedby bycar,
car,which
whichmight
mightindicate
indicatethat
that
bus–metro
bus–metrointegration
integrationcompetes
competeswith withcar–metro
car–metrointegration
integrationfor forlong-distance
long-distancetrips.
trips.
Meanwhile, it is notable that the catchment areas of metro stations vary between the
downtown and suburban areas owing to different densities of street networks. There-
fore, two typical stations, Xinjiekou station in downtown, and Mozhoudonglu station in
suburban areas, are picked, and their catchment areas are calculated by both a network-
based method and circular method, then compared. As Figure 8 shows, the service area
of Mozhoudonglu station for all feeding modes is smaller than that of Xinjiekou station,
revealing that the lower density of network leads to narrower areas accessible for travelers.
Moreover, the network-based service area of Xinjiekou station almost overlaps its circularSustainability 2022, 14, 2841 13 of 16
Sustainability 2022, 14, x FOR PEER REVIEW 13 of 16
buffer. By contrast, the circular buffer, without considering the conditions of street network,
seems to overestimate the catchment area of Mozhoudonglu station.
Figure 7. Catchment area delineation.
Meanwhile, it is notable that the catchment areas of metro stations vary between the
downtown and suburban areas owing to different densities of street networks. Therefore,
two typical stations, Xinjiekou station in downtown, and Mozhoudonglu station in sub-
urban areas, are picked, and their catchment areas are calculated by both a network-based
method and circular method, then compared. As Figure 8 shows, the service area of
Mozhoudonglu station for all feeding modes is smaller than that of Xinjiekou station, re-
vealing that the lower density of network leads to narrower areas accessible for travelers.
Moreover, the network-based service area of Xinjiekou station almost overlaps its circular
buffer. By contrast, the circular buffer, without considering the conditions of street net-
Figure7.7.Catchment
Catchmentarea
areadelineation.
delineation.
work, seems
Figure to overestimate the catchment area of Mozhoudonglu station.
Meanwhile, it is notable that the catchment areas of metro stations vary between the
downtown and suburban areas owing to different densities of street networks. Therefore,
two typical stations, Xinjiekou station in downtown, and Mozhoudonglu station in sub-
urban areas, are picked, and their catchment areas are calculated by both a network-based
method and circular method, then compared. As Figure 8 shows, the service area of
Mozhoudonglu station for all feeding modes is smaller than that of Xinjiekou station, re-
vealing that the lower density of network leads to narrower areas accessible for travelers.
Moreover, the network-based service area of Xinjiekou station almost overlaps its circular
buffer. By contrast, the circular buffer, without considering the conditions of street net-
work, seems to overestimate the catchment area of Mozhoudonglu station.
(a) Circular buffer. (b) Network-based buffer.
Figure 8. Comparing catchment areas of stations in suburb and downtown.
Figure 8. Comparing catchment areas of stations in suburb and downtown.
5. Conclusions
It is impossible for people to make door-to-door trips by metro without any transfers.
The combination of multiple feeding modes and metro ensures better travel accessibility.
For those in charge of city planning and management, it is essential to figure out the
characteristics of different feeding modes with respect to access/egress distances and
catchment areas of metro stations. This paper uses travel data and GIS data to calculate
(a) Circular buffer. (b) Network-based buffer.
the network-based distance in both access and egress phases and portrays the catchment
Figure 8. Comparing catchment areas of stations in suburb and downtown.Sustainability 2022, 14, 2841 14 of 16
areas of metro stations for different modes including walking, bus, private bike, docked
bike-sharing, private e-bike, taxi, and car.
Findings are as follows:
With regard to transfer mode shares, the distribution of access phase is almost in
accordance with that of egress phase. Walking is the most used feeding mode, sharing at
nearly 70% of all transfer trips. Possibly affected by the weather, docked bike-sharing is not
as prominent as expected, but is also competitive compared with private bike. To determine
the 85th percentile value of access/egress distance, quadratic models and cubic models are
applied for multiple feeding modes. Mostly, the average egress distances of these feeding
modes are slightly longer than their average access distances. Walking has the shortest
feeding distance while docked bike-sharing supports the shortest time cost in both access
and egress phase, about 8 min. Private e-bike has superiority over the conventional bike
for a longer distance within nearly the same time consumption. Car requires less time to
achieve longer access and egress distance than bus. In addition, the spatial characteristics
of distribution of access distance demonstrates that the long-distance access trips are very
worthy of attention for improvement. As for catchment area delineation, the key factor is
the 85th percentile of access distance. A bigger threshold means larger accessible areas of
metro stations generally. Circular buffer better suits the determination of service area of
metro stations in downtown than that in suburbs.
To summarize, this paper compares both access distance and egress distance and
catchment area for multiple feeding modes of metro stations based on a network method.
This study has several limitations. First, some emerging transport modes are not involved,
such as dockless bike-sharing, electric bike-sharing, and scooters, which provides somewhat
of an incomplete picture of multiple feeding modes for metro transferring. Second, the
value of access/egress distance and catchment area of multiple feeding modes may vary
according to different weather and season. Deeper comparative analysis can be conducted if
the survey data can be collected over a longer period. Third, this paper only uses Nanjing as
a case study. It may also be useful to obtain the survey data from other cities to examine the
multiple feeding modes patterns in other contexts, which could provide some comparisons.
In addition, this work could be extended by dividing road networks into different types
(e.g., footpath, underground passages, and overpasses) on the basis of different feeding
modes. Moreover, it would be interesting to explore the competing, complementing, and
extending relationships between multimodal connections and metro by examining the
spatial relationship of multimodal connections’ origins/destinations and the locations of
metro stations. Finally, future studies need to explore how different weather condition,
socio-economic, land use, urban density features, and housing buildings influence the
access/egress distance and catchment area of multiple feeding modes for metro.
Author Contributions: The authors confirm their contributions to this paper as follows: X.L.: Con-
ceptualization, Methodology; X.M.: Conceptualization, Data curation, Writing—Original draft prepa-
ration, Writing—Reviewing and Editing; Z.L.: Data curation, Investigation. All authors checked the
results and finalized the manuscript. All authors have read and agreed to the published version of
the manuscript.
Funding: This research was funded by National Natural Science Foundation of China, grant number
51908187 and 52172304, and the APC was funded by National Natural Science Foundation of China,
grant number 51908187.
Institutional Review Board Statement: Not applicable.
Informed Consent Statement: Not applicable.
Data Availability Statement: Not applicable.
Conflicts of Interest: The authors declare no conflict of interest.Sustainability 2022, 14, 2841 15 of 16
References
1. Zuo, T.; Wei, H.; Rohne, A. Determining transit service coverage by non-motorized accessibility to transit: Case study of applying
GPS data in Cincinnati metropolitan area. J. Transp. Geogr. 2018, 67, 1–11. [CrossRef]
2. Givoni, M.; Rietveld, P. The access journey to the railway station and its role in passengers’ satisfaction with rail travel. Transp.
Policy 2007, 14, 357–365. [CrossRef]
3. Wang, J.; Cao, X. Exploring built environment correlates of walking distance of transit egress in the Twin Cities. J. Transp. Geogr.
2017, 64, 132–138. [CrossRef]
4. Wang, Z.-J.; Chen, F.; Xu, T.-K. Interchange between Metro and Other Modes: Access Distance and Catchment Area. J. Urban Plan.
Dev. 2016, 142, 04016012. [CrossRef]
5. Weiss, A.; Habib, K.N. Examining the difference between park and ride and kiss and ride station choices using a spatially
weighted error correlation (SWEC) discrete choice model. J. Transp. Geogr. 2017, 59, 111–119. [CrossRef]
6. Hsiao, S.; Lu, J.; Sterling, J.; Weatherford, M. Use of Geographic Information System for Analysis of Transit Pedestrian Access.
Transp. Res. Rec. 1997, 1604, 50–59. [CrossRef]
7. Zhao, J.; Deng, W.; Song, Y.; Zhu, Y. Analysis of Metro ridership at station level and station-to-station level in Nanjing: An
approach based on direct demand models. Transportation 2014, 41, 133–155. [CrossRef]
8. Jun, M.-J.; Choi, K.; Jeong, J.-E.; Kwon, K.-H.; Kim, H.-J. Land use characteristics of subway catchment areas and their influence
on subway ridership in Seoul. J. Transp. Geogr. 2015, 48, 30–40. [CrossRef]
9. Wang, Y.; Correia, G.; de Romph, E.; Timmermans, H. Using metro smart card data to model location choice of after-work
activities: An application to Shanghai. J. Transp. Geogr. 2017, 63, 40–47. [CrossRef]
10. Kuby, M.; Barranda, A.; Upchurch, C. Factors influencing light-rail station boardings in the United States. Transp. Res. Part A
Policy Pract. 2004, 38, 223–247. [CrossRef]
11. Cardozo, O.D.; García-Palomares, J.C.; Gutiérrez, J. Application of geographically weighted regression to the direct forecasting of
transit ridership at station-level. Appl. Geogr. 2012, 34, 548–558. [CrossRef]
12. Rastogi, R.; Rao, K.V.K. Travel Characteristics of Commuters Accessing Transit: Case Study. J. Transp. Eng. 2003, 129, 684–694.
[CrossRef]
13. Zhao, J.; Deng, W. Relationship of Walk Access Distance to Rapid Rail Transit Stations with Personal Characteristics and Station
Context. J. Urban Plan. Dev. 2013, 139, 311–321. [CrossRef]
14. Ji, Y.; Fan, Y.; Ermagun, A.; Cao, X.; Wang, W.; Das, K. Public bicycle as a feeder mode to rail transit in China: The role of gender,
age, income, trip purpose, and bicycle theft experience. Int. J. Sustain. Transp. 2017, 11, 308–317. [CrossRef]
15. Li, Z.; Wang, W.; Yang, C.; Ding, H. Bicycle mode share in China: A city-level analysis of long term trends. Transportation 2017, 44,
773–788. [CrossRef]
16. Taylor, D.; Mahmassani, H. Analysis of stated preferences for intermodal bicycle-transit interfaces. Transp. Res. Rec. 1996, 1556,
86–95. [CrossRef]
17. Hochmair, H.H. Assessment of Bicycle Service Areas around Transit Stations. Int. J. Sustain. Transp. 2015, 9, 15–29. [CrossRef]
18. Lee, J.; Choi, K.; Leem, Y. Bicycle-based transit-oriented development as an alternative to overcome the criticisms of the
conventional transit-oriented development. Int. J. Sustain. Transp. 2016, 10, 975–984. [CrossRef]
19. Cheng, Y.-H.; Lin, Y.-C. Expanding the effect of metro station service coverage by incorporating a public bicycle sharing system.
Int. J. Sustain. Transp. 2018, 12, 241–252. [CrossRef]
20. Ma, T.; Liu, C.; Erdoğan, S. Bicycle Sharing and Public Transit Does Capital Bikeshare Affect Metrorail Ridership in Washington,
DC? Transp. Res. Rec. 2015, 2534, 1–9. [CrossRef]
21. Fyhri, A.; Fearnley, N. Effects of e-bikes on bicycle use and mode share. Transp. Res. Part D Transp. Environ. 2015, 36, 45–52.
[CrossRef]
22. Fyhri, A.; Heinen, E.; Fearnley, N.; Sundfør, H.B. A push to cycling exploring the e-bike’s role in overcoming barriers to bicycle
use with a survey and an intervention study. Int. J. Sustain. Transp. 2017, 11, 681–695. [CrossRef]
23. Plazier, P.A.; Weitkamp, G.; Berg, A.E.V.D. “Cycling was never so easy!” An analysis of e-bike commuters’ motives, travel
behaviour and experiences using GPS-tracking and interviews. J. Transp. Geogr. 2017, 65, 25–34. [CrossRef]
24. Talamini, G.; Ferreira, D.P. An informal transportation as a feeder of the rapid transit system. Spatial analysis of the e-bike taxi
service in Shenzhen, China. Transp. Res. Interdiscip. Perspect. 2019, 1, 100002. [CrossRef]
25. Lin, D.; Zhang, Y.; Zhu, R.; Meng, L. The analysis of catchment areas of metro stations using trajectory data generated by dockless
shared bikes. Sustain. Cities Soc. 2019, 49, 101598. [CrossRef]
26. Guo, Y.; Yang, L.; Lu, Y.; Zhao, R. Dockless bike-sharing as a feeder mode of metro commute? The role of the feeder-related built
environment: Analytical framework and empirical evidence. Sustain. Cities Soc. 2021, 65, 102594. [CrossRef]
27. Pan, H.; Shen, Q.; Xue, S. Intermodal Transfer between Bicycles and Rail Transit in Shanghai, China. Transp. Res. Rec. J. Transp.
Res. Board 2010, 2144, 181–188. [CrossRef]
28. Wang, Z.-J.; Liu, Y.; Chen, F. Evaluation and Improvement of the Interchange from Bus to Metro Using Smart Card Data and GIS.
J. Urban Plan. Dev. 2018, 144, 05018004. [CrossRef]
29. Santoso, D.S.; Sakamoto, K.; Yajima, M.; Kubotoa, H. Trip Characteristics of Commuters Accessing Rail Transit by Considering
Distance and Slope with Integration of Public Bus as a Feeder. J. East. Asia Soc. Transp. Stud. 2015, 11, 1479–1494.You can also read