Microsoft Power BI Embedded - Product Profile By Wayne W. Eckerson May, 2018 - Amazon S3
←
→
Page content transcription
If your browser does not render page correctly, please read the page content below
Microsoft Power BI Embedded
        Product Profile

    By Wayne W. Eckerson
         May, 2018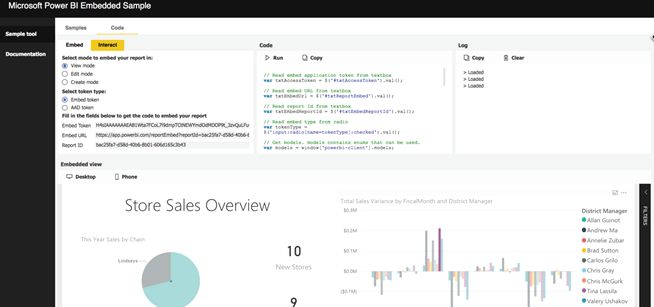
Microsoft Power BI Embedded

This product profile is associated with an Eckerson Group report titled The Ultimate Guide to Embedded
Analytics: Keys to Product Selection and Implementation, which was published in February 2018. This
profile addresses criteria for evaluating embedded analytics products described in the report.

   Summary
   In 2017, Microsoft shipped a revamped version of Power BI Embedded that enables developers to embed
   Power BI content into web applications. Unique among embedded analytics products, Power BI
   Embedded is a platform-as-a-service (PaaS) that administrators can start, stop, and pause on demand.
   Priced by the hour, Power BI Embedded offers the same functionality and REST APIs as Power BI service
   on Azure, making it easy for organizations and independent software vendors (ISVs) to deliver all the
   benefits of Power BI inside other applications.

In an information economy, data is king. This is one reason organizations are racing to embed reports,
dashboards, and self-service capabilities into new cloud applications and customer portals. Enterprises
and ISVs alike are choosing to outsource the delivery of reports, dashboards, and self-service
capabilities to analytics specialists.

These trends have created a vibrant market for embedded analytics products that can be customized to
mimic the look, feel, and functionality of host applications. The market for embedded analytics is
expected to reach $51.78 billion by 2022, growing at a 14.1% compound annual rate, according to
market research from Markets and Markets.

Microsoft Power BI Embedded Background

Microsoft reintroduced Power BI in 2015 with a modern design, aggressive pricing, tight integration with
Azure, and interactive visual capabilities. The new product was a hit, especially with Microsoft shops and
Office 365 customers eager to move computing to the cloud, making it a leading BI player virtually
overnight.

In 2017, Microsoft beefed up the embedded capabilities of Power BI, converging it with the Power BI
Service and Power BI REST APIs to create Power BI Embedded. The new PaaS analytics environment
provides a seamless experience for Power BI developers to embed Power BI content into both internal
and external applications. Microsoft also revamped the pricing, using the same capacity-based model as
Power BI Premium but priced by the hour instead of by the month.

© Eckerson Group 2018                     www.eckerson.com                                                 2

Microsoft Power BI Embedded
Our review of Microsoft Power BI Embedded uses evaluation criteria defined in our companion report,
The Ultimate Guide to Embedded Analytics: Keys to Product Selection and Implementation.
Embedding Functionality
With Microsoft Power BI Embedded, customers can embed Power BI reports, charts, dashboards, tiles,
and Q&A (i.e., natural language search) into any web-based application. The applications do not need to
run on Microsoft Azure; they just need to be registered with Azure Directory Services, which is quick and
easy to do.
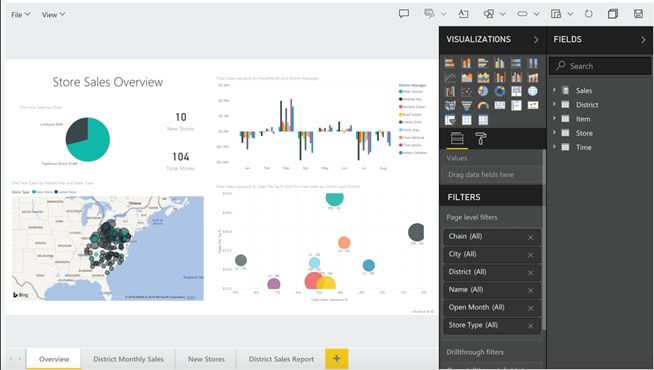
All content is fully interactive; clicking on any object in a display filters remaining objects. With reports
specifically, developers allow users to view, edit, or create content from scratch. In the edit and create
modes, Power BI Embedded exposes a Web-based authoring environment, which displays all metrics,
dimensions, and filters used to create a report. This enables organizations to provide self-service
analytics inside another application. (See figure 1.)
Figure 1. Report Edit Mode in Power BI Embedded
If a user has permission to edit a report, Power BI embedded exposes an authoring environment composed
of the metrics, dimensions, and filters used to create the report, which users can drag and drop onto the
canvas to create their own data views.
© Eckerson Group 2018 www.eckerson.com 3Microsoft Power BI Embedded
Developers create reports and content using Power BI Desktop, a popular Windows-based tool that
enables developers to create data models and populate them with data from more than 75 sources
using pre-built connectors. Although Power BI Desktop is not embeddable, the web-based authoring
environment (see figure 1) supports most Power BI Desktop functions except data modeling and
sourcing. However, the REST API enables developers to create a mechanism by which embedded users
can import new Power BI Desktop models and data sources.
All content is rendered in HTML5 so output (i.e., reports and dashboards) can be displayed on mobile
devices. Typically, developers use a design template to create mobile-specific content in either portrait
or landscape format with single or multiple columns to optimize mobile device displays. Power BI
Embedded content does not automatically resize views to fit devices. It exposes content within an
iFrame, which is a separate window within a web page—essentially, walled off HTML code. Power BI
Embedded does support gestures for mobile, so users who want to dive deeper into the visual details
can just double-tap anywhere on the visual, and it opens in focus mode.
Embedding APIs. Currently, Microsoft offers two APIs for embedding:
1) A REST API provides programmatic access to Power BI dashboard resources such as datasets,
tables, and rows. Also, developers can use the Power BI REST API to create custom apps that push
data into a Power BI dashboard. The API returns JSON documents.
2) A JavaScript API lets developers embed reports, charts, tiles, and dashboards into web pages
using iFrames. Although iFrames are easy to deploy, they have some limitations, such as screen
resizing (see above). However, Microsoft has overcome some of these challenges. For instance, with
Microsoft’s Javascript library, developers can send a data point from Power BI to update a table or
trigger an alert in the host application.
Many developers use these embedded APIs with Microsoft Power Shell, a command line scripting
language for managing and administering Azure resources.
GUI Customization
Organizations can customize the look and feel of Power BI (i.e., white labeling) using cascading style
sheets. It currently doesn’t offer themes (i.e., templates) or point-and-click configuration files for
configuring fonts, styles, colors, etc. However, with the REST API, customers can create their own
analytics front end and GUI that calls the Microsoft Power BI Embedded service to populate screen
objects. Microsoft also offers .NET developers an SDK for its REST API.
© Eckerson Group 2018 www.eckerson.com 4Microsoft Power BI Embedded Extensibility Microsoft has published the source code to Power BI visualizations on GitHub and encourages developers to build new visualizations and embed them in the Power BI gallery or in embedded applications. Currently, more than 100 custom visualizations are available in the Power BI gallery, with ratings and reviews, which users can import and download directly into their dashboards. In addition, Power BI customers can download more than 120 content packs from within the tool. The content packs, which are authored by Microsoft and 40 other authors, are report templates and data models for analyzing data from specific applications, such as Adobe, Google, Insightly, and Marketo. Microsoft has also created more than 10 solutions templates—essentially data marts in a box—for specific applications, such as Twitter, Facebook, and Salesforce, which developers can download and embed in their applications. Finally, hundreds of Power BI authors and developers have contributed to the community site more than 1,000 items that others can download and use. These include dashboard themes, data stories or dashboards, R scripts to support machine learning functions, and metrics. In addition, Microsoft hosts a partners’ gallery where more than 100 partners display more than 250 dashboards that users can view (but not download). Data Architecture Power BI offers more than 100 data connectors, including native connectors for relational and multidimensional databases and connectivity to big data systems, such as Apache Spark, Impala, and HDFS, and to cloud services like Marketo, Salesforce, and Microsoft Dynamics. Power BI Desktop has data modeling and preparation features (i.e., extract, transform, and load) that developers use to connect to data sources and clean, format, integrate, and aggregate data. Once a model is built, developers upload it to the Power BI service where users can query the model. The queries can either run dynamically at query time against one or more source systems, or they run against pre-fetched data in an in-memory tabular database. The tabular database runs in either Power BI (10 GB limit) or Azure Analysis Services, the Microsoft cloud-based multi-dimensional database, where scalability depends on node capacity of the underlying service. © Eckerson Group 2018 www.eckerson.com 5
Microsoft Power BI Embedded

Security

There are multiple ways to embed Power BI content depending on the degree of authentication and
access control required. Each approach has a different licensing model. Number 3 (Power BI Embedded)
is the focus of this product profile.

     1. Publish to Web. Power BI generates embed code—a small, snippet of Javascript code—that can
     be easily inserted into a web page to create an iFrame for the Power BI content, such as a chart,
     report, or dashboard. The limitation here is that anyone who can access the web page can see the
     content. Also, the content can’t use a direct query connection or support row-level security.
     2. Embed for Your Organization. Developers embed content in internal web pages, such as
     Microsoft SharePoint or Microsoft Teams, using the Power BI REST API. Administrators need to
     register the host application or website with Azure Active Directory, and users must have a Power BI
     license and log in before they can access the content.
     3. Embed for Customers (Power BI Embedded). This last option is designed for ISVs or
     enterprises with external customers who may not be Power BI users. Through use of tokens, users
     need not log on to Power BI to view or interact with embedded content; they just log into the host
     application, which transfers authentication and access control rights to Power BI via the token. The
     tokens enforce application- and row-level security so customers can access only authorized reports
     and data.

Multi-Tenancy

Power BI supports multi-tenancy through the use of Workspaces, which are essentially groups inside
Power BI service. Administrators load embedded content (i.e., Power BI desktop files) into the
Workspace in which the host application is registered. From there, administrators can display all content
to all embedded users or create multiple Workspaces, one for each customer or tenant, for example.

Microsoft offers sample code to create a Workspace and manage content in it. Developers can use the
REST API to automatically create a new Workspace for each new customer added to the host application
and populate it with cloned reports. Thus, when new users log in to the host application, they see
reports with data relevant to them. And when they create a new report, it is saved into their Workspace.

Most Power BI Embedded customers today run the following multi-tenant deployment options:
    1) Direct query option. The developer creates a unique set of reports for each tenant, running
    against a single remote data source with row-level security.
    2) Data cache option. The developer creates a unique cached data set for each tenant, who runs a
    common set of reports. But each tenant only sees its data.

© Eckerson Group 2018                     www.eckerson.com                                             6
Microsoft Power BI Embedded
Software and Systems Architecture
Unlike most embedded analytics products, Power BI Embedded does not require a server, nor does it
run on premises or offer source code. It’s a PaaS service with REST and JavaScript APIs that runs in the
cloud. Power BI Embedded requires a web connection, works with either native or cloud applications,
and can query on-premises databases through the on-premises data gateway for Power BI.
Pricing
Originally, ISV customers had trouble estimating costs because Microsoft charged for each page render.
Hence, Microsoft shifted to hourly pricing based on the size of the node running the embedded service.
Customers can choose from six node types and can run multiple nodes simultaneously. Nodes vary by
number of virtual cores and RAM and range in price from $1/hour to about $32/hour. (See figure 2.)
Figure 2. Power BI Embedded Pricing
Customers can sign up for a two-month free trial of Power BI Pro. They only need to purchase capacity
once they move their embedded application into production. Once in production, customers can start,
stop, pause, and restart nodes based on demand, saving money when capacity is not being used. They
also can automatically set up Azure Alerts to add or reduce capacity when usage surpasses predefined
levels, ensuring compliance with service level agreements. Microsoft offers a white paper to help ISVs
estimate capacity of their embedded environments.
© Eckerson Group 2018 www.eckerson.com 7Microsoft Power BI Embedded
Documentation and Samples
Power BI Embedded comes with some terrific documentation and sample code. Microsoft’s GitHub site
enables developers to run and interact with sample reports, tiles, visuals, Q&A, and dashboards. From
the page, users choose in what mode to run the report (view, edit, create), copy embed tokens and URLs,
and view the code. (See figure 3).
Figure 3.
Microsoft also provides Power BI developer samples, a wiki, an active blog site, and comprehensive API
documents.
Conclusion
Microsoft Power BI Embedded is a no-brainer for Microsoft shops and cloud-based ISVs who want to
bring Power BI to their customers. As a PaaS offering, Power BI Embedded is different from other
embedded analytics products. It’s a service, not software; it’s priced by the hour; and it can be paused,
started, or stopped on demand. Thus, it offers an easy way for organizations to embed visual and
interactive content, including self-service capabilities, into customer-facing applications.
© Eckerson Group 2018 www.eckerson.com 8Microsoft Power BI Embedded
Wayne W. Eckerson is an internationally recognized thought leader in the business
intelligence and analytics field. He thinks critically, writes clearly, and presents
persuasively about complex topics. He is a sought-after consultant, noted speaker,
and bestselling author. He can be reached at wayne@eckerson.com.
Need help with your business analytics or data management and governance strategy?
Want to learn about the latest business analytics and big data tools and trends?
Check out Eckerson Group research and consulting services.
© Eckerson Group 2018 www.eckerson.com 9You can also read