Mighty River Power Capital Markets Day - 2 October 2013 - Amazon AWS
←
→
Page content transcription
If your browser does not render page correctly, please read the page content below
2 October 2013

Mighty River Power
Capital Markets Day
CAPITAL MARKETS DAY

Disclaimer

The information in this presentation has been prepared by Mighty River Power Limited with due care and attention. However,
neither the company nor any of its directors, employees, shareholders nor any other person shall have any liability whatsoever to
any person for any loss (including, without limitation, arising from any fault or negligence) arising from this presentation or any
information supplied in connection with it.

This presentation may contain projections or forward looking statements regarding a variety of items. Such projections or forward
looking statements are based on current expectations, estimates and assumptions and are subject to a number of risks,
uncertainties and assumptions. There is no assurance that results contemplated in any projections and forward looking
statements in this presentation will be realised. Actual results may differ materially from those projected in this presentation. No
person is under any obligation to update this presentation at any time after its release to you or to provide you with further
information about Mighty River Power Limited.

A number of non-GAAP financial measures are used in this presentation. You should not consider any of these in isolation from,
or as a substitute for, the information provided in the audited consolidated financial statements which are available at
www.mightyriver.co.nz.

The information in this presentation is of a general nature and does not constitute financial product advice, investment advice or
any recommendation. Nothing in this presentation constitutes legal, financial, tax or other advice.

CAPITAL MARKETS DAY

Agenda
1.00pm      Introduction and Health & Safety

1.15pm      Operations

2.15pm      Retail

3.00pm      Afternoon tea break

3.30pm      Metrix

3.45pm      Development

4.30pm      Capital Management

5.00pm      Q&A
CAPITAL MARKETS DAY

Our company and the environment we operate in
> Operate in a competitive and well-functioning market that has led to world-best
  outcomes
    >   for security, level of renewables and resilience to future fuel shocks
    >   Consumer benefits now occurring from major investments
> Our portfolio well positioned for demand-supply dynamics
    >   current excess capacity, reflecting flat demand and increased renewable generation
    >   potential for reduction in excess capacity, as more flexible take-or-pay requirements
        lead to further response from fossil fuel generators
> Inherent portfolio advantages mean greater earnings surety under most market
  conditions, including weak Waikato hydro conditions
> Multi-brand retail strategy delivers a tailored customer experience through
  innovation in an intensely-competitive market
> Metrix, our technology business with unique multiple technology platforms,
  provides opportunity for earnings-accretive growth
> Development business continues to position for weak domestic outlook and
  medium term economically-viable growth options offshore
> Focus on sustainable earnings and capital management underway and ongoing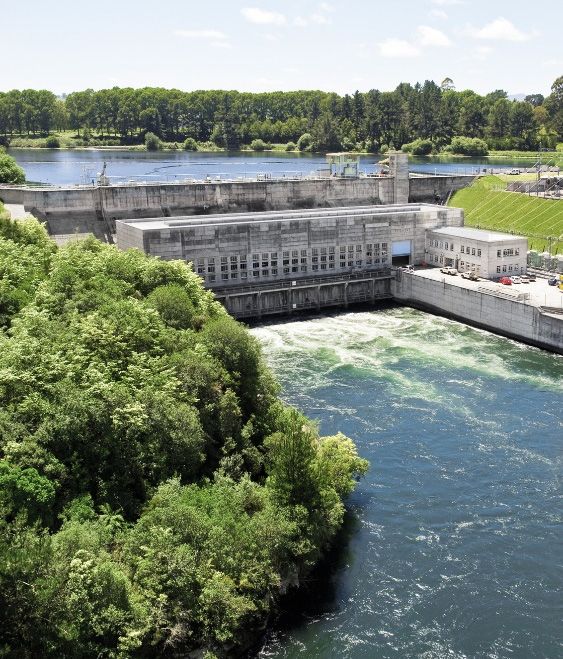
CAPITAL MARKETS DAY

Health & Safety
> Health & Safety focus on ‘zero harm’ is an absolute     TOTAL RECORDED INJURY
  priority                                                FREQUENCY RATE
                                                          2.5
> Critical industry opportunity with common contractors
  and sub-contractors - StayLive generators’ group        2.0
> Company (and other generators) TRIFR well below
  electricity sector averages                             1.5
       > our TRIFR shows 17% improvement y-o-y; and
          59% improvement over past five years            1.0
       > Ngatamariki project TRIFR (involving 1 million
                                                          0.5
          person-hours) of 0.98 vs 3.54 for last major
          project (Nga Awa Purua)
                                                          0.0
> LTIFR at similar levels for the last 5 years                   FY2009    FY2010    FY2011     FY2012     FY2013

> Significant and on-going effort into Health & Safety
  processes, specific focus to improve critical risk       LOST TIME INJURY FREQUENCY RATE
  identification, including systems and culture            (EMPLOYEES AND ON-SITE
                                                           CONTRACTORS)
> Sentenced for ‘near-miss’ incident in September 2013     0.6
      > $32,000 for drilling contractor; $16,000 for
                                                           0.5
        Mighty River Power as principal for failing to
        take all practicable steps                         0.4
      > Judge referenced one-off nature of incident and    0.3
        Company’s good safety record and robust safety     0.2
        processes
                                                           0.1
      > early guilty plea from the Company; focus on
        capturing learnings and implementing               0.0
        improvements in future risk identification                FY2009    FY2010     FY2011     FY2012     FY2013
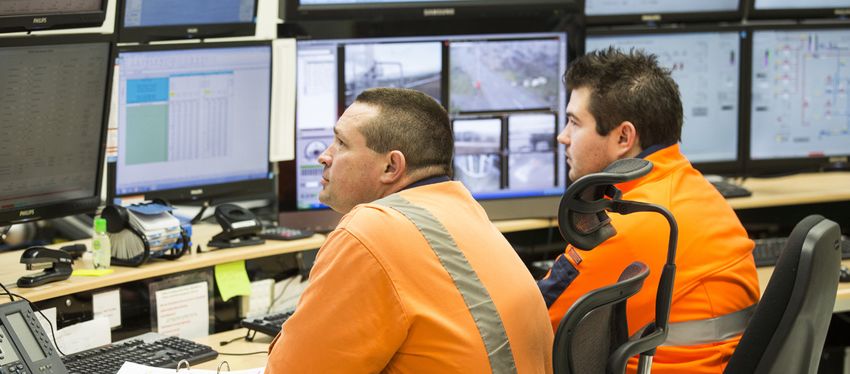
Operations
Capital Markets Day

Presented by:
Fraser Whineray       Phil Gibson
General Manager       Wholesale Markets Manager
Operations

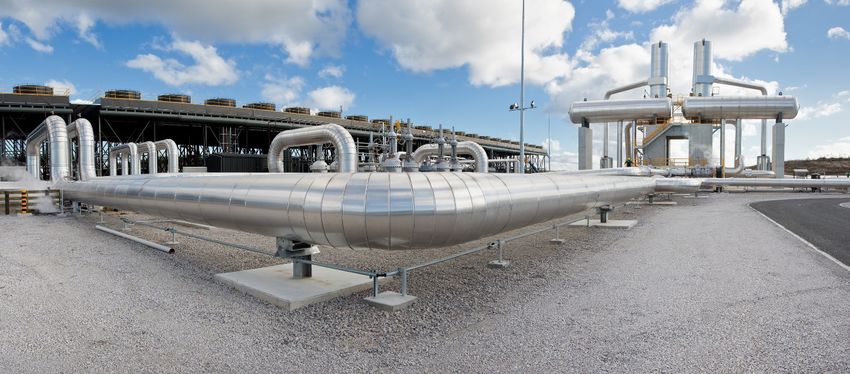
OPERATIONS

Operations
Operations is responsible for:
> Managing the generation of electricity to be sold on the wholesale market and to certain large
  commercial customers
> Managing wholesale electricity value and risk position through a range of levers
> Operation and maintenance of power stations and upstream fuels

OPERATIONS

Market Structure

OPERATIONS

Wholesale/portfolio decisions and governance

                                     Governance – Management/Board

     SHORT‐TERM                                      MEDIUM‐TERM                           LONG ‐TERM
 Cover risk and achieve                          Optimise sales book and              Future earnings growth
   best value for fuel                                fuel choices                    and asset management
             Pricing                                         Pricing                              Pricing
        Competitors                                     Competitors                          Competitors
   Dispatch Optimisation
                                                    Portfolio net position              Portfolio net position
          Fuel Value
                                                      Outage Planning                    Asset Management
    Outage scheduling
        Transmission                                     Plant Mode                            New Plant

               Fuel                                           Fuel                                  Fuel

                                                                                          Decisions made in conjunction with
     Decisions made in conjunction with retail         Decisions made by Operations
                                                                                          Development
OPERATIONS
Demand and supply
> Excluding industrial, demand flat over last six years
> deindustrialisation trend seen since 2003
> Meridian Tiwai negotiations more positive than expected
> 170MW step down in Meridian contract volume in 2015
> provides clear signal and time for thermal response, including others contracting with Tiwai
> Thermal units in New Zealand are large relative to the total market
> 170MW step-down equivalent to a 15% reduction by the three CCGTs
NATIONAL CONSUMPTION
45,000
40,000 Thermal Generation
35,000 for FY2013
GWh
30,000
25,000
20,000
03 1998
09 1998
03 1999
09 1999
03 2000
09 2000
03 2001
09 2001
03 2002
09 2002
03 2003
09 2003
03 2004
09 2004
03 2005
09 2005
03 2006
09 2006
03 2007
09 2007
03 2008
09 2008
03 2009
09 2009
03 2010
09 2010
03 2011
09 2011
03 2012
09 2012
03 2013
National Consumption Rolling 12 months
National Consumption Excl. Tiwai Rolling 12 months
National Consumption Excl. all Direct Connect Rolling 12 monthsOPERATIONS
Thermal utilisation reducing
> Record level of thermal surplus due to combination of:
> long lead time generation build pipelines
> sustained period of flat to declining demand growth
> Introduction of non-discretionary renewables (geothermal and wind) has led to displacement of
base-load thermals
> Thermal generators’ response constrained by fuel commitments
THERMAL UTILISATION AND CAPACITY, AND GEOTHERMAL CAPACITY
100% 25,000
Thermal and Geothermal Capacities
80% 20,000
Utilisation
60% 15,000
40% 10,000
(GWh)
20% 5,000
0% ‐
2003 2004 2005 2006 2007 2008 2009 2010 2011 2012
Diesel Capacity Coal Capacity Gas Capacity Geothermal Capacity
Southdown Otahuhu TCC Huntly Main
Huntly 6 Whirinaki e3p
Note: in the above graph thermal capacity is stacked and the geothermal capacity is overlaidOPERATIONS
Thermal response underway
> Contact
> Investment in Ahuroa gas storage facility allows reduced take-or-pay quantities and converts gas supply from base
load to peaking/firming
> Signal to mothball Taranaki CCGT (TCC) from start of 2014 to defer maintenance capex
> Considering disconnection of OTA steam turbine and conversion to OCGT
> Genesis
> Recently announced the second of its units going into storage before the end of 2013
> Only two Huntly 250MW units available from 2014 – expect very low utilisation
> Mighty River Power
> Converted Southdown from base-load to peaking mode from 2003
> Gas supply arrangements reducing during 2014. No gas contracted from 2016
> Earnings from ACOT over winter – offset gas transmission costs
WINTER SECURITY MARGIN ASSESSMENT
Basecase
40%
No new thermal + decommissioning of one CCGT
Energy Security Margin
High Demand
30%
20%
10%
0%
2012
2013
2014
2015
2016
2017
2018
2019
2020
Source: System Operator, TranspowerOPERATIONS
What does it all mean for wholesale prices?
> Future wholesale market price outcomes heavily dependent on key drivers of supply and demand
> Futures curves and independent forecasts consistently low for some time
> Market expects some increase over time to wholesale and futures prices
> Current commercial prices would not cover fuel and variable operating cost of thermals
> ASX CAL14 saw $3 lift in response to Contact TCC announcement in August 2013
THIRD PARTY WHOLESALE ELECTRICITY PRICE ASX FUTURES SETTLEMENT PRICE (OTA)
FORECASTS
120 90
110 80
100 70
Nominal Price ($/MWh)
90 60
80 50
$/ MWh
70 40
60 30
50 20
40 10
FY14
FY15
FY16
FY17
FY18
FY19
FY20
0
FY2014 FY2015
Credit Suisse Deutsche Bank FNZC
Goldman Sachs Macquarie UBS As at 30 June 2012 As at 5 April 2013 (date of PFI)
As at 30 June 2013 As at 26 September 2013OPERATIONS
Mighty River Power portfolio dynamics
AVERAGE WHOLESALE PRICE (WKM)
> Traditionally run ‘short’ on an annual
90
energy basis
80
> mean Waikato hydrology and
70
Southdown at circa 30% load
60
> risk managed with additional thermal
$/MWh
utilisation and contracts 50
40
> Portfolio risk assessed by internal VaR
30
model against risk appetite
20
> Actual short position has range driven by 10
high/low inflow scenarios to Waikato 0
Hydro and wholesale prices FY2009 FY2010 FY2011 FY2012 FY2013
> Mixture of sales channels to residential,
SALES PORTFOLIO
commercial and industrial customers
Industrial Commercial Residential
nationwide - spreads exposure to location
risk and portfolio decay/price risk 8,000
7,000
> Current commercial contracts market
6,000
clearing at low/negative margins for risk
5,000
GWh
4,000
3,000
2,000
1,000
0
FY2009 FY2010 FY2011 FY2012 FY2013OPERATIONS
CFD and ASX
INDUSTRIAL CFD SALES
> Industrial Sales CFDs Other Industrial Sales
Kawerau Contract
> Fixed Price Fixed Volume contract, typical in
2,500
Industrial sales channel
2,000
> buyer takes some volume risk compared to 1,500
GWh
FPVV contracts, CFDs normally priced 1,000
accordingly 500
0
> 30% of total sales and 75% of net CFDs FY2009 FY2010 FY2011 FY2012 FY2013
> Inter-generator CFDs
NET INTER-GENERATOR CFD*
> generators use CFDs to manage fuel, plant and
transmission outages 3,000
2,000
> ASX and broker markets provide useful
reference for OTC markets 1,000
GWh
> 15% of net CFDs 0
-1,000
> ASX futures market
-2,000
> exchange traded market for quarterly futures FY2009 FY2010 FY2011 FY2012 FY2013
contracts Buy CFD Sell CFDs
> Mighty River Power participates as a Market ASX CFD
Maker 600
> useful alternative for hedging inter-island risk 400
> 10% of net CFDs 200
GWh
0 Location
Hedging
-200
*Includes VAS on both buy and sell side CFDs
-400
FY2009 FY2010 FY2011 FY2012 FY2013OPERATIONS
How is our portfolio placed to respond to short-term market conditions?
> Base-load geothermal and all-year -round rain-fed Waikato hydro delivers reliable generation compared to other renewable
portfolios
> South Island hydrology is negatively correlated to wholesale price. Taupo inflows are typically not correlated which limits
downside variability but has the opportunity for upside
> Flexible gas generation delivers peaking capacity and hydro firming for dry year risk mitigation (~1000GWh of potential
Southdown)
> All generation located in the central North Island in close proximately to growing parts of the economy – less basis risk
TAUPO AND SI STORAGE PERCENTAGES AND MEANS
100%
90%
Storage Percentage of Average
80%
70%
60%
50%
40% North/South # of QTRs
30%
Wet/Wet 11
Wet/Dry 4
20% Dry/Wet 5
10% Dry/Dry 1
Dry/Dry Taupo storage % SI Storage % Mean Taupo Storage % Mean SI Storage % 80% Mean SI Storage %
0%
Apr-09
Apr-10
Apr-11
Apr-12
Apr-13
Jul-08
Jul-09
Jul-10
Jul-11
Jul-12
Jul-13
Oct-08
Jan-09
Oct-09
Jan-10
Oct-10
Jan-11
Oct-11
Jan-12
Oct-12
Jan-13
Oct-13OPERATIONS
Risk Management Processes
Board
Market and Credit Risk Management Policy
Risk Assurance and Audit Committee
Executive Risk Management Committee
BACK OFFICE
FRONT OFFICE MIDDLE OFFICE
Administration of
Customer and competitor facing Position, Credit and Exposure transactions/cash flows
transactions Control
Transaction
External relationships Reconciliation
Confirmation
Competitor Insight Counterparty Credit Settlement
Accessed Credit
Market Insight Debt Management
Exposure
Offer and Acceptance Policy Compliance EA NotificationMARKET DYNAMICS
Market regulation
> Energy prices for end consumers set by deregulated, competitive market forces
> Deregulated wholesale market based on supply and demand established in 1990s, with full retail
competition from 1998
> Transmission and distribution considered monopoly assets – ownership separation from generation or
retailing businesses and separately regulated
> Independent Regulatory Agencies
> Commerce Commission – competition law and determination of returns for regulated asset base
> Electricity Authority (EA) is primary regulator of electricity markets - promotes competition in, reliable supply
by, and the efficient operation of, the electricity industry for the long-term benefit of consumers
> Framework has been settled since 1999 after a period of significant reform in mid to late 1990sOPERATIONS
A well functioning market
> Current market structure has led to highly competitive market which has resulted in world-leading
outcomes:
> 1,200MW renewable investment over last 10 years displacing fossil fuel
> best generation projects brought to market first
> security of supply highest for two decades
> retail churn around 20% (second only to Victoria, Australia)
> Initiatives have seen further improvements in wholesale markets
> transmission investment approvals/commisioning
> increased liquidity and price certainty
> Retail markets can benefit from investment in wholesale market
> Electricity Authority survey (February 2013) stated “prices in [this] market reflect the outcomes
expected in a workable market”
EA MARKET PERCEPTIONS SURVEY
Instantaneous Frequency
Retail OTC Futures Spot reserves keeping
2013
2011
Source: UMR research negative positiveOPERATIONS Transmission Pricing Review > The EA announced a new Transmission Pricing Mechanism (TPM) in October 2012 for consultation with proposed implementation in 2015 > The proposal was extremely complex, applied to all transmission (not just HVDC) and was retrospective in nature > Initial consultation attracted strong negative feedback by wide-cross section of submitters > EA has delayed proposed implementation date by one year and intends to release a further series of consultation papers on key elements of the proposal in FY2014 > Ability to recover generator charges key to any new proposal > Any decrease in Tiwai demand would change reallocation/beneficiaries
OPERATIONS

Transmission Pricing Review
OPERATIONS
Transmission
> Core infrastructure for electricity markets RELATIVE WHOLESALE PRICE – OTAHUHU
TO BENMORE
> Underpin national competition for customers
5 Bi-pole outages
Transmission upgrades
4 HVDC Commissioned
> Transpower $3.5 billion programme expected to
Location factor
complete in March 2014 3
> North Island Grid Upgrade Programme 2
(NIGUP) providing improved security of supply 1
commissioned in October
0
> Wairakei Ring providing increased transfer
Aug
Sep
Oct
Apr
Aug
Sep
May
Jul
Nov
Dec
May
Jul
Jun
Jan
Feb
Mar
Jun
through central North Island
> High Voltage Direct Current (HVDC) Pole 3 RELATIVE WHOLESALE PRICE – OTAHUHU
TO WHAKAMARU
> HVDC Pole 2 control systems commissioning
underway 1.18
1.16
> lower opportunity for price separation between NIGUP Commissioned
1.14
North and South Islands
Location factor 1.12
> increases South Island generators’ ability to 1.10
compete in wholesale and end-user markets in 1.08
the North Island 1.06
1.04
> reduces risk of retailers competing against
1.02
South Island generators in the South Island
1.00
01 Oct
06 Oct
11 Oct
16 Oct
21 Oct
26 Oct
31 Oct
04 Jan
09 Jan
14 Jan
19 Jan
24 Jan
29 Jan
05 Nov
10 Nov
15 Nov
20 Nov
25 Nov
30 Nov
05 Dec
10 Dec
15 Dec
20 Dec
25 Dec
30 DecOPERATIONS
Reinvestment capital expenditure
> $72 million of reinvestment capital expenditure for
FY2014
> two wells at Kawerau and on-going hydro lifecycle work
> Higher than average reinvestment capital expenditure
for the rest of the decade given the hydro lifecycle
programme
> Arapuni generators - three complete; all four competed
end of 2013
> Ohakuri runners - two complete and all four expected to
be complete at the end of FY2014
> Next phase of programme will focus on Whakamaru
rehabilitation
> Geothermal reinvestment capital expenditure is lumpy
as the sustainable resource is managed
> dynamic system in which we manage around 200 wells
> On-going requirement for make-up wells
> released drilling rig in September on completion of
Kawerau wells
> completion of almost ten years of continuous drillingOPERATIONS
Market Dynamics
> Operate in a highly competitive and well-functioning market that has led to world-best outcomes
> for security, level of renewables and resilience to future fuel shocks
> Our portfolio well positioned for demand-supply dynamics
> current excess capacity, reflecting flat demand and increased renewable generation
> potential for future reductions in excess capacity, as more flexible take-or-pay requirements lead to further
response from fossil fuel generators
> Inherent portfolio advantages means greater earnings surety under most market conditions,
including weak hydro conditions
> Centralised management of wholesale price risk and optimising value across integrated portfolioRetail Capital Markets Day Presented by: Matthew Olde Bryan Dobson Luke Blincoe Acting General Manager Sales, Marketing and Service GM Bosco Connect Retail Manager and GLO-BUG
RETAIL

Retail
> Retail responsible for:

       > Marketing and selling electricity to residential and business customers through Mighty River Power’s
         consumer brands (Mercury Energy, GLO-BUG, Bosco Connect and Tiny Mighty Power)
       > Managing customer segmentation and mix to maximise value
RETAIL
Retail
FPVV BUSINESS AND RESIDENTIAL SALES
6,000
MIGHTY RIVER POWER RETAIL ELECTRICITY
5,000
CUSTOMERS BY BRAND (FY13)
4,000
GWh
3,000
2,000
1,000
-
GLO‐BUG FY09 FY10 FY11 FY12 FY13 FY14 PFI
Mercury
Other Tiny Mighty 16,956 Business Residential
Energy Power
44,504
349,833 16,567 MARKET SHARE OF NATIONAL DEMAND
Bosco
(EXCL TIWAI)
Connect
10,981 40,000
30,000 18% 19% 21% 21% 21% 22%
GWh
20,000
10,000
(note: excludes gas customers) -
FY08 FY09 FY10 FY11 FY12 FY13
Rest of Market excl Tiwai MRP Sales volumes
Source – Transpower information exchange, MRP dataRETAIL
Competitive Landscape
> Retail competition a key focus for the Electricity Authority (EA):
> What’s My Number campaign impact
> increased liquidity in hedge markets, reduction of basis risk through transmission investment allowing more
flexibility in retailer portfolio mix, and model use of systems agreements
> EA currently reviewing options to reduce participant prudential requirements and further increase consumers’
propensity to compare and switch retailers
> High security margins drive elevated competition levels
CUSTOMER ELECTRICITY SWITCHING RATES BY MARKET
30%
% of annual customer churn
25%
20%
15%
10%
5%
0%
2010 2011 2012
Source – VaasaETTRETAIL
Competitive Landscape
> Mass market switching activity approaching the 2011 peak, especially in Auckland
> Despite being over-represented in Auckland (68% of Mighty River Power customers Auckland-based), retail
book churning below market average
> Grew mass market volume since FY08 ahead of increase in retail competition backed by additional
generation capacity
RESIDENTIAL CUSTOMER SWITCHING IN AUCKLAND MIGHTY RIVER POWER ICPS &
& NZ SHARE OF CONSUMPTION
25% 450
24%
400
350 22%
20%
MRP Market Share %
300 20%
ICP's (000's)
15% 250 18%
200
16%
10% 150
14%
100
5% 50 12%
- 10%
0% FY08 FY09 FY10 FY11 FY12 FY13
Jan-10
May-10
Jul-10
Sep-10
Nov-10
Jan-11
May-11
Jul-11
Sep-11
Nov-11
Jan-12
May-12
Jul-12
Sep-12
Nov-12
Jan-13
May-13
Mar-10
Mar-11
Mar-12
Mar-13
Non Auckland
Auckland
AKL Market Churn NZ Market Churn Share of NZ Consumption (excl. Tiwai)
Mercury AKL Churn Mercury NZ Churn
Source: Electricity AuthorityRETAIL
Mass Market Pricing
> Headwinds in mass market pricing due to the supply / demand balance and increased competition
> Headline prices not reflective of offers and discounts offered in the market
> Lines and transmission charges typically make up 40% of end prices
AVERAGE DOMESTIC ENERGY PRICE BY PROPORTION OF MERCURY CUSTOMERS
RETAILER FOR NZ: 2006 - 2013 ON HEADLINE PRICING
2009
18 3%
17
16
15
c/kWh
14 97%
13
12 2013
11
10
May-06 May-07 May-08 May-09 May-10 May-11 May-12 May-13 39%
Contact Energy Genesis Energy
Mercury Energy Meridian Energy
61%
TrustPower Contact Energy Online OnTime
TrustPower Friends Extra
Source: Ministry of Business, Innovation & Employment & MRP Analysis
Non Standard Pricing Headline PricingRETAIL
Contract Market
> Increased market activity evident in the commercial contract and CFD markets
> Successful in increasing commercial book in 2012 before ASX markets fell. Average contract tenure 2.8
years
> Successfully contracted volume ahead of Ngatamariki commissioning
> Recent market pricing not aligned with Company view of return for risk
COMMERCIAL FPVV SALES VOLUMES & PRICING
10.5 800
10.0 700
9.5
600
9.0
Gwh per quarter
500
c / kWh
8.5
400
8.0
300
7.5
200
7.0
6.5 100
6.0 0
Sep-10 Dec-10 Mar-11 Jun-11 Sep-11 Dec-11 Mar-12 Jun-12 Sep-12 Dec-12 Mar-13 Jun-13
MRP FPVV Commercial Sales Volumes Energy Link FPVV Index ASX OTA
Source – Energy Link, ASX, MRP dataRETAIL
Cost Management
> Whilst acquisition costs correlate to the level of switching activity, underlying OPEX continues to be
actively managed, partially mitigating the cost of increased churn
> Reductions in underlying costs reflect process efficiencies in billing, credit and service functions
RETAIL OPERATING COSTS
100% 25%
90%
% of FY09 Operating & Direct Cost Base
80% 20%
70%
60% 15%
% Churn
50%
40% 10%
30%
20% 5%
10%
0% 0%
FY09 FY10 FY11 FY12 FY13
Acquistion Costs Servicing Costs Mercury Churn %RETAIL
Debt Management and Disconnections
> A sustained focus on credit assessment, WRITE-OFF COST PER ICP (2012)
80
collection efficacy and leveraging prepay
Average write-off per ICP
is resulting in lower bad debt write-offs 60
than industry
40
> Guiding principles for debt management
20
focus on early intervention and
appropriate payment solutions 0
> Mercury disconnection rates are falling
Source – Veda, Electricity Authority
CREDIT PERFORMANCE
0.40% 0.70%
0.35% 0.60%
Net debt write off rate
Disconnection rate
0.30%
0.50%
0.25%
0.40%
0.20%
0.30%
0.15%
0.20%
0.10%
0.05% 0.10%
- 0.00%
FY09 FY10 FY11 FY12 FY13
Net debt write-offs as a % of revenue Arrears disconnection rate - Mighty River
Arrears disconnection rate - Industry
Source – Electricity Authority, MRP dataRETAIL
Consumer Brands
> A multi-brand strategy enables a tailored customer experience and cost efficiency
Brand Established Customers Description Service Experience
1993 350,000 • Mass market, multi‐ • Full‐service call centre
segment • Comprehensive online service suite
• Scale operation • Multiple communication channels
• Increased use of online and email channels for both
marketing and service
2006 10,000 • CBD apartments • Concentrates on low‐cost service channels
• Low cost operating • Delivers better value to both customer and retailer as a
model for low result
consumption, high
turnover segment
2008 17,000 • Smart meter prepay • Online and app‐based self‐service, pay‐service call centre
product available
• Pay‐as‐you‐go • Uses technology including in‐home display and
budget management smartphones to deliver more control to the customer
service • Eliminates credit management cost
2009 17,000 • Regional towns • Full‐service decentralised call centre
• Local presence, • Regional, personalised service proposition
community
engagementRETAIL
GLO-BUG
> GLO-BUG is a smart meter and cloud hosted prepay solution that provides
a range of tools (IHD, smart phone apps, web) to help customers manage
their energy account more easily
> Delivers a socially responsible solution by reducing the total cost of energy
for most credit distressed customers through avoided fees associated with
late payment behaviour
> on average a customer migrating from Mercury to GLO-BUG reduces their total
cost of energy by around $300 on average
> GLO-BUG well positioned to benefit from wider use of credit checking;
Meridian and Mercury refer credit distressed and credit check fail
customers to GLO-BUG
> Recognised industry solution
> transfer of Meridian prepay customer base
> won the Innovation Award at the Deloitte Energy Excellence Awards in 2012
GLO-BUG CUSTOMERS
20,000
16,000
12,000
ICPs
8,000
Includes transfer of Meridian
4,000 prepay customers
-
Jan-08 Jan-09 Jan-10 Jan-11 Jan-12 Jan-13RETAIL
Tiny Mighty Power
> Distributed contact centre in selected towns enables lower operating costs and more effective
engagement through community presence (e.g. Schools programme)
> Sustained local presence enables higher market penetration (in the towns) than could be achieved
with the traditional retail approach of one-off acquisition campaign
Area (Market Entry) Market Share %
TINY MIGHTY ICPS
Marlborough (Sep 10) 15.7%
18,000 Whakatane (Jul 12) 14.6%
Waipa (Nov 09) 13.4%
16,000
Wairarapa (Aug 10) 10.7%
14,000 Thames Valley (Sep 10) 3.3%
12,000 Rotorua (Jan 13) 1.2%
Taupo (Jan 13) 1.0%
10,000
ICPs
8,000
6,000
4,000
2,000
-
Nov-09
May-10
Jul-10
Sep-10
Nov-10
May-11
Jul-11
Sep-11
Nov-11
May-12
Jul-12
Sep-12
Nov-12
May-13
Jul-13
Mar-10
Mar-11
Mar-12
Mar-13
Jan-10
Jan-11
Jan-12
Jan-13
Source: Electricity AuthorityRETAIL
Innovation
> Focused on strengthening customer
relationship beyond basic electricity supply: MERCURY ENERGY RESIDENTIAL PRODUCT
> 43k dual fuel customers (since April 2002) PENETRATION
100%
> 35k Star Supporter Club members
donating $850k p.a. to Starship via monthly 90%
bill (since May 2004) 80%
> 36k Mercury Perks members receive 70%
entertainment, travel, food and wine 60%
discounts (since April 2010)
50%
> 95k residential customers on fixed price 40%
contracts (since November 2010)
30%
> 65k GEM users to date, incl. >60% repeat
20%
users (since March 2013)
10%
0%
Jun-09 Jun-10 Jun-11 Jun-12 Jun-13
Electricity only 2 products 3 products 4+ products *
* Products include: Dual Fuel, Fixed Price Contracts, Mercury Perks, Star Supporters Club, Active
GEM usersRETAIL
Innovation
> The Good Energy Monitor (GEM) is delivering increased customer engagement
> Active GEM users display higher level of satisfaction and lower likelihood to switch
CUSTOMER PERCEPTIONS SINCE LAUNCH OF GEM
60%
% of Mercury customers that agree
50%
40%
30%
20%
10%
0%
Innovative and Save energy Leading the way Comes up with Offers Appeals to you Takes away the
Progressive and money new ideas something more hassle
different
Feb-13 Jun-13
Source: Colmar BruntonRETAIL Demo of GEM live $#
Metrix
Capital Markets Day

Presented by
Matthew Olde                       Tim O’Halloran
GM Business Strategy & Solutions   GM Metrix
METRIX

Introduction
> Technology Business
> Advanced Metering Infrastructure (AMI) and Services
METRIX

Business model
> Three key components underpin a flexible business model
      > buy and deploy AMI or leverage third party AMI
      > operate AMI control systems and manage rich information
      > deliver AMI services and field services for retailers or their agents

    AMI TECHNOLOGY                               METRIX SYSTEMS                   CUSTOMERS

  P2P AMI
                                                                                     Retailers
                                                              Retailers Service
                                                              Integration

                                                                                    Distribution
         Collector
                                                                                     networks

                                                                Field Services
     Mesh AMI
METRIX
Client base
> Increased electricity retailer ICP churn provides opportunities for increased deployment
CLIENT BASE JUNE 2013
Contact 13%
Meridian
7%
Glo-Bug Powershop 4%
7%
Other 11% Genesis 3%
Mercury 61% Other 3%
Bosco 1%METRIX
Enabling retailer propositions
> AMI propositions are now coming to life
> Mercury - Good Energy Monitor
> GLO-BUG Prepay/GLO-BUG and IPHONE
> Powershop
> Contact EnergyMETRIX
The AMI market in Auckland
> Metrix has a long heritage in New Zealand’s biggest retail/residential market
> Now 85% deployed with AMI
> Metrix holds 70% market share
> Ongoing deployment programme in Auckland
AUCKLAND AMI METERING MARKETS JUNE 2013
Metrix AMI
AMS AMI
LegacyMETRIX
AMI market nationally
Market structure
> Rollout of AMI is driving market consolidation in electricity metering
> Three AMI providers now deployed 50% AMI
> Retailer-led model
> Beginning to see maturity in service interoperability among the three AMI providers
JUNE 2013
Metrix AMI, 329
Legacy upgrade assigned,
577
Other, 1043
AMS AMI , 505
Legacy upgrade
uncommitted , 466
Arc AMI , 135METRIX
The AMI market nationally
Operating environment
> Expect stabilisation following recent, extensive
changes to the electricity metering regulations
> Significant investment in systems interface
with the Electricity Registry completed
> Compliance deadline of 1 April 2015 rapidly
approaching for Category 1 metering
installations
> all metering installations up to 3-phase 100
Amps require full certification
> Elevated levels of Electricity ICP churnMETRIX Operating statistics > $101m of capital expenditure over the last five financial years > EBITDA doubled from FY2009 to FY2013 Year ended 30 June FY2013 FY2012 FY2011 FY2010 FY2009 Capital Expenditure ($m) 8.4 16.6 33.0 25.8 17.1 AMI 314,586 281,340 240,586 120,877 35,104 Legacy Meters 58,663 84,405 121,726 192,213 279,119 Legacy Meters – 3 phase 23,908 25,673 33,005 33,296 32,542 Load Control (hot water) 270,332 268,163 252,380 227,504 226,239 Pre‐pay 13,586 14,679 15,198 14,765 12,095 Total Assets 681,075 674,260 662,895 588,655 585,099
METRIX

Growth opportunity
Expansion activity
> Deploying AMI into new regions for Mighty River Power
  consumer brands
> Providing exclusive AMI services on the Counties Power
  network
> Further AMI opportunities available in the market

Capital investment
> Future capex spend depending on growth opportunities
  around $20m - $40m p.a.
      > PFI FY14 forecast was $12.8m
> Revenues flow immediately following deployment
Development Capital Markets Day Presenters: Mark Trigg Samuel Moore Dennis Radich GM Development Manager Strategy & Planning Generation Development Manager
DEVELOPMENT

A significant role in both of the Company’s core business strategies

> Maximising the value of the existing business
      > Technical Resources Team (Rotorua) provides specialist
        technical services to Operations through Geoscience;
        Reservoir Engineering; Asset Management; Well Services;
        Chemistry
> Securing economically attractive development options
      > Business Development Team (Auckland based)
      > Chilean operations and development team (Santiago based)
DEVELOPMENT
The trend in the domestic market required an adjustment to strategy
> Reset the level of domestic activity
> maintain a small number of long-dated options with sufficient diversity of scale, fuel type and technology
> align the resourcing to match the reduced activity levels
> consider the optimal configuration of existing gas generation
> Increase our focus on existing investments in offshore jurisdictions
> removed the intermediary between the Company and its offshore investments in Chile and California,
enabling significantly greater direct management involvement
> fully controlled entity in Chile
> Board representation, management and technical collaboration in EnergySource (California)DEVELOPMENT
Domestic activity curtailed consistent with demand requirements
> Small focused number of
opportunities being maintained
> wind and geothermal preferred
> Other lesser opportunities
abandoned
> Lower touch/lower cost approach as
we await market recovery
> Significant reductions in resourcing
undertaken or planned
> headcount peaked at circa 150
(inclusive of Chile) during
Ngatamariki construction
> trending towards 90
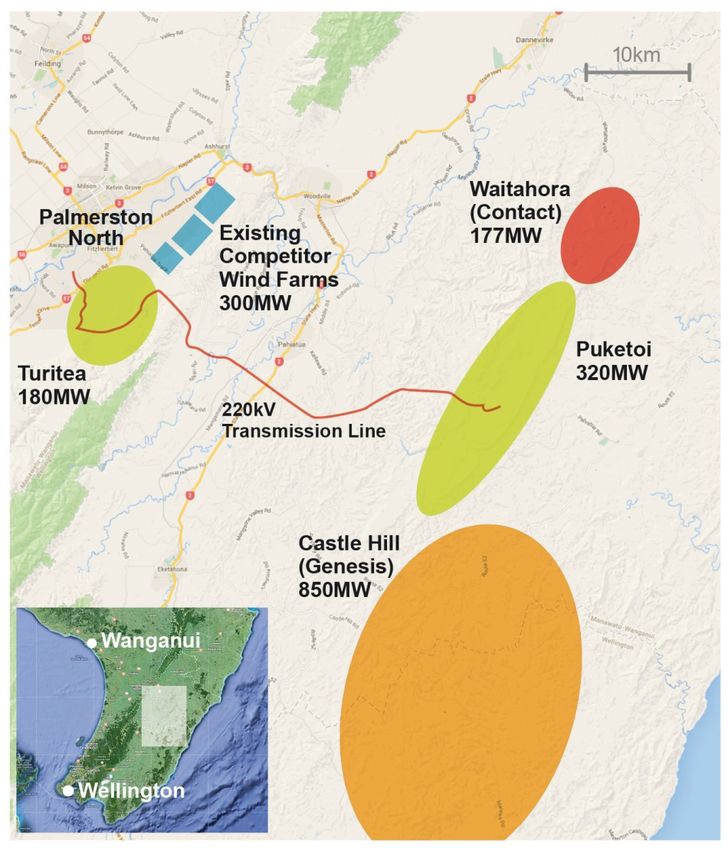
> 2/3 in technical resourcesDEVELOPMENT A strong position in wind has been created > Two very high quality, consented Class 1 (high wind speed) sites South East of Palmerston North > Fully consented 220kV transmission line route to link projects to the Transpower grid > Transmission line consent large enough to accommodate all four wind projects in the area (note Waitahora & Castle Hill consented without transmission) > Staged execution options to meet market opportunities > Also a third (earlier stage) Class 1 site, Cape Campbell, in Marlborough with long-term development rights
DEVELOPMENT

Offshore an opportunity to leverage niche capabilities and create a new growth channel

> The Company has, during the 10 year period of domestic development, built up institutional
  knowledge in
       > geothermal risk assessment
       > development capability
       > technical resource capability
       > geothermal operations

> The small size of the global geothermal market created opportunity to leverage that strategic
  advantage not held in any other fuel sources

> Additional risks in new jurisdictions offset by diversifying existing risks
      > soft domestic market with increased regulatory uncertainty
      > long term domestic contract price uncertainty

> Route to maintain institutional knowledge in absence of new domestic opportunity

> Consider the programme as a continuous one, not bounded by geography per se
       > US-based John L Featherstone plant (HR1) in commercial operation prior to completion of Ngatamariki,
         first evidence of that transition
       > further Salton Sea (US) development seen as next most likely project
DEVELOPMENT
After five years we have created a platform from which we can control future
direction
> Created the opportunity to consider a number of development options via GeoGlobal Energy (GGE)
that would have been inaccessible otherwise
> Have direct control of those investment opportunities we elected to pursue
> direct investment in EnergySource with a preferred position in John L Featherstone plant
> direct ownership of Chilean entity and resource rights
> financial interest in German assets currently under management control of GGE, but including a repurchase
option (nominal cost) should certain financial criteria not be met by GGE
> Transformed the structure of original investment (designed to meet SOE constraints) to enable
direct management and control
> absorbed the management of the assets / investments into our own development structure with significantly
reduced cost
> closer alignment of incentives between partners
> leverage of existing resources and systems that successfully delivered the domestic programme over the
past decade
> apply patient approach to development as required with full control over capital allocation decisionsDEVELOPMENT
Investment in John L Featherstone has already paid dividends
> Initial USD92m investment
> 20% holding in EnergySource
> preferred equity interest in John L
Featherstone Plant
> post construction refinancing led to lump
sum distribution of USD118m
> Post tax cash flow returns influenced by “flip”
dates
> circa USD1m until tax equity flip forecast in
late 2017
> circa USD4.5m from then until MRP
“preferred” return completed in 2021
> circa USD2m thereafter
> Resourcing
> EnergySource has operational and
development teams based in San Diego
and Salton Sea
> hold one (of three) board seats
> interaction at management and technical
levels giving direct access to information
> Hudson Ranch II
> EnergySource has PPA for a further project
> has additional landDEVELOPMENT
Salton Sea represents a significant opportunity
> Field
> Cal Energy has operated 10 plants with 327MWe US GEOTHERMAL FIELD BY RUNNING
net (340MWe gross) since 2000 CAPACITY
> no make-up wells required to support pressure Geysers
decline (small number due to well condition) Salton Sea
> State Coso
Running capacity
Heber
> ongoing significant retirements of gas plant due to Steamboat
restrictions on ‘Once Through Cooling’ East Mesa
> San Onofre (2200MW nuclear) closure Dixie Valley Additional
resource
> geothermal baseload characteristics / benefits are Blue Mountain
potential
starting to be recognised in context of large Roosvelt
amount of intermittent renewables Puna
> But we are mindful of 0 500 1,000 1,500
MW
> Californian utilities near the 20% Renewable
Portfolio Standards requirements but some way to
Source: Running Capacity: International Geothermal Assn
go to reach 33% requirement by 2020 Database
> longevity of federal tax incentives always Additional resource potential: Western Governors'
uncertain Association Geothermal Task Force Report, Jan 2006
> Future
> Mighty River Power elected not to exercise its option to increase its stake to 33% - value based decision
> discussions are ongoing with partners about alternative mechanisms by which we may increase our
participation
> access to greater acreage of development land would enable participation in huge potential of fieldDEVELOPMENT
Chile overview
Geothermal potential PUCHULDIZA
> Large number of geothermal fields throughout Chile
> Mighty River Power has direct ownership of two of the top
concessions:
> Tolhuaca (central Chile)
> Puchuldiza (northern Chile)
Market potential
SANTIAGO
> Strong growth economy (resources driven)
> Strong electricity demand growth
> Recognized electricity supply challenges TOLHUACA
> Politically stable
> Good regulatory regime and established institutions
> Deep and sophisticated capital markets for infrastructure
investment
> Long term attractive outlookDEVELOPMENT
Chile is a strong demand growth market
TOTAL ELECTRICITY DEMAND
> Average historical electricity demand growth
70,000
rate of >6% p.a.
60,000 1990‐2011 CAGR: 6.4%
> Demand driven both by commodity export 50,000
sector and increasingly by domestic demand 40,000
GWh
(middle class expansion from 1990) 30,000
> Two contracting markets for generators to sell 20,000
10,000
into:
0
> Regulated client (distributor/retailers) tender 1990 1992 1994 1996 1998 2000 2002 2004 2006 2008 2010
market
Source: Chilean Ministry for Energy
> “Free client” market for bilateral contracts with
large end users >2MW TOTAL SIC NETWORK GENERATION
60,000
50,000
40,000
GWh 30,000
20,000
10,000
0
Hydro Thermal Other
Source: CDEC‐SICDEVELOPMENT
Supply challenges driving favourable price outlook
SIC SPOT PRICES
> Chile imports about 75% of its total primary
energy supply 400
350
> Beginning in 2004, Argentina curtailed
300
exports of natural gas to Chile 250
US$/MWh
> Base load generation historically dominated 200
by coal and hydro 150
100
> Energy price outlook reflects likely 50
dependence on imported LNG for new 0
(CCGT) capacity 2002 2003 2004 2005 2006 2007 2008 2009 2010 2011 2012 2013
> growing opposition to new coal & hydro Spot price at Temuco 220kV node
> some gas-fired plants converted to liquid Source: CDEC‐SIC
fuels REGULATED CLIENT DEMAND
> LNG import capacity constrained 50,000
> Renewables targets increasing* from 10% 40,000
to 20% by 2025
30,000
> Non-conventional renewable energy credits
GWh
available for geothermal generation 20,000
> Generators are paid a firm capacity charge 10,000
for being available
0
2012 2013 2014 2015 2016 2017 2018 2019 2020 2021 2022 2023
Contracted volume Regulated client demand
* Passed by Senate; now back with Congress
Source: CNEDEVELOPMENT
World geothermal players are active in Chile
> Large number of exploration concessions have been granted
> Some of world’s largest geothermal companies are present
> All attempting to solve similar issues of bridging geothermal potential with market opportunity
> Starting to see consolidation and exit over time of more speculative resource holders
> Potential for further consolidation of industry as experienced developers optimise portfolios and
speculators exit
> Mighty River Power’s current focus
> de-risking project execution through commercial partnerships
> revenue security (e.g. PPA)
> deepening understanding of resource position
> sizing the local platform to near term activity levelsDEVELOPMENT
Successful geothermal development requires recognition that -
> Patience is necessary
> Successful partnerships require alignment of incentives and preferably
> complementary strategic capabilities
> robust financial capacity of each partner
> Scale becomes valuable to spread technical platform costs
> Risk diversification is valuable
> through multiple fields for resource diversity
> different jurisdictions enable regulatory and pricing risk diversity
> A detailed understanding of market dynamics is important
> a core strength in our home market
> a key strategic capability sought in partners for other jurisdictions
> Staged development is a rational response to long-term resource uncertainty
> Overheads need to be managed through the development cycle2 October 2013 Capital Management Capital Markets Day Presented by: William Meek Tim Thompson Chief Financial Officer Treasury Manager
CAPITAL MANAGEMENT

Capital Structure
Disciplined approach to capital allocation
> Balance sheet consistent with a stand alone
  credit profile of ‘bbb’ by S&P (or equivalent)1
> Dividend policy targets dividend yield attractive
  to shareholders while cognisant of a sustainable
  financial structure
           > working capital requirements
           > the medium term asset investment programme
           > short to medium term risks on earnings
> Focus on maintaining an appropriate portfolio of
  high quality investment opportunities
           > evaluate against all competing uses for cash
> Capital management is addressed on an on-
  going basis by management and the Board

1.   Mighty River Power’s BBB+ corporate credit rating reflects S&P’s view that in the
     event of financial distress there is a “moderate” likelihood of the New Zealand
          Capital
     sovereign       management
                providing                  as normal
                           extraordinary support to ensurebusiness
                                                             the company’s financial
     obligations are met in a timely  manner.
                                   practice
2.    Free Cash Flow defined as Operating Cash Flow after interest paid and tax less
     reinvestment capex
CAPITAL MANAGEMENT
Capital Allocation
> FY2014 forecasts reflect full year cash flow
contribution from Ngatamariki
> FY2014 Capex forecast reduced relative to
PFI to be in the range of $125m to $175m
> FY14 PFI forecasts dividend of $182m (13
cents per share)
> forecast Payout 107% of adjusted Net Profit
and 71% of Free Cash Flow
> gross yield circa 8% (fully imputed)
> Modest deleveraging forecast if capex at
low end of forecast range
> On-going focus on sustainable earnings
looking forward driven by:
> normalisation of generation output (average
hydro, full year of Ngatamariki)
> improvements in business wide
effectiveness and efficiency
* Other cash flows from investing and financing activities as disclosed in
Mighty River Powers FY2013 financial results and prospectusCAPITAL MANAGEMENT
Balance sheet management
> Mix of short and long term funding
DEBT MATURITY PROFILE AS AT 30 JUNE
> weighted average maturity exceeding 5 years
350
> $300m of new facilities arranged in FY2013
($200m of bank and $100m of domestic 300
wholesale bonds)
> no maturing facilities in FY2014 (excluding CP) 250
> option to convert RCAF into longer term debt
200
> Liquidity
$m
> $475m of committed but unutilised bank 150
facilities
> $100m of commercial paper outstanding 100
> Cost of Funds
50
> cost of funds likely to remain at current levels
until 2018 due to long term hedging undertaken
0
in 2008 prior to ramp in capex/debt to support
2014
2015
2016
2017
2018
2019
2020
2021
2022
2023
2024
2025
2026
geothermal development programme
Financial Years
Drawn Undrawn1
375 100 125 550 260
Facility Type ($m)
RCAF - Undrawn RCAF - Undrawn: CP Cover
1. $100m of outstanding commercial paper deducted from undrawn debt
RCAF - Drawn Wholesale Bonds
2. USD proceeds fully swapped to NZD via cross currency swaps
US Private Placement22CAPITAL MANAGEMENT
Balance sheet management
Cost of Funds INTEREST RATE HEDGING
1400 8.0%
> Term funding and interest rate hedging (swaps)
undertaken prior to undertaking geothermal
7.0%
development programme 1200
> reduce funding and liquidity risk and provide
cash flow certainty in the medium term 6.0%
1000
> most swaps not hedge accounted currently so
Swap Rate (%)
fair value movements recognised through P&L 5.0%
800
> to reduce P&L volatility accounting policy now
$m
requires all new hedges to be hedge accounted 4.0%
> The significant fall in interest rates in NZ (and 600
3.0%
globally) post 2008 has resulted in these
hedges being out of the money 400
2.0%
> FY2013 fair value benefit of $25.6 million
> FY2012 fair value cost of $92.8 million 200
1.0%
> Debt re-financing has negligible impact on cost
of funds excepting credit spread which is largely 0 0.0%
driven by debt market and term
FY2008
FY2009
FY2010
FY2011
FY2012
FY2013
> Cost of funds will be higher than benchmark
funding rates until hedges expire in 2018
Debt 10yr IRS (Annual Average)CAPITAL MANAGEMENT
Capital expenditure
> $1.4b invested in geothermal domestically since CAPITAL EXPENDITURE
2006 450
> cumulative revaluations of new geothermal
assets exceed $0.5b at 30 June 2013 400
> Lower capital expenditure forecast on a go 350
42
14
forward basis reflecting no large scale domestic
generation development programme 300
> FY2014F capital expenditure reduced to $125m 38
250 10
- $175m (PFI: $199.1m)
$m
274
> Reinvestment capex $72m (2 new wells at 200 280 44
Kawerau and on-going hydro lifecycle
refurbishment) 150 173 50
225
> $13m for Ngatamariki carried forward from 119
100 53
FY2013
> other capex includes AMI 50
66 74 69 72
> contingent provision capex largely relates to 57
26
offshore geothermal, discussing alternatives at 0
FY2009
FY2010
FY2011
FY2012
FY2013
FY2014F
Energy Source
Potential other new investment Other new investment
Geothermal ReinvestmentCAPITAL MANAGEMENT
Capital Structure
> Mighty River Power Board is committed to maintaining a ‘bbb’ stand alone credit profile
> S&P favour the use of cash flow metrics to assess the financial risk profile of the company
> key comparative measures for Mighty River Power and it’s peers are Funds from Operations (FFO) coverage
and leverage metrics
FFO / DEBT* FFO INTEREST COVERAGE*
50% 7.0
45% 6.5
FFO Interest Coverage (x)
40% 6.0
FFO / debt (%)
35% 5.5
30% 5.0
25% 4.5
20% 4.0
15% 3.5
10% 3.0
2008
2009
2010
2011
2012
2013
2014
2008
2009
2010
2011
2012
2013
2014
Financial Years Financial Years
Mighty River Power Contact Meridian Genesis Mighty River Power Contact Meridian Genesis
> Mighty River Power metrics presently tighter than competitors
> Key credit metrics expected to improve in FY14 due to lift in earnings from removal of one-
off costs and commissioning of Ngatamariki
*Calculated using S&P existing criteria and metric definitions
Source: S&P Credit Reports and Mighty River Power calculations based on publicly available informationCAPITAL MANAGEMENT
Credit criteria
> S&P is currently reviewing the criteria for rating corporate industrial companies and utilities
> stated rationale being to make the ratings process more transparent and comparable across industries and
jurisdictions
> Criteria for intermediate risk, standard volatility unchanged from 2009 core ratios but S&P specifics
to NZ generators historically lower than published ratio bands
> FFO/debt: 30-45%, Debt/EBITDA: 2-3x
> we believe S&P are potentially seeking to pre-empt impacts on ratios when interest rates rise given
currently record low rates globally
> S&P have indicated that the new criteria will likely be in place from the start of calendar year 2014
> consultation was concluded in September 2013
> S&P have indicated that 10% of credits will likely be affected .
> the likelihood of upgrades and downgrades across all S&P credits has been assessed as equal by S&PCAPITAL MANAGEMENT
Sustainable earnings focus
> Weak demand and supply conditions means the company has moved from growth phase to consolidation phase
> potential for demand/supply surprises particularly on supply side reflecting thermal response
> FY2014 EBITDAF guidance confirmed at PFI levels
> generation down over 260GWh against expected levels in Q1 FY2014
> Ngatamariki commissioned and handed over. Generation over Q1FY2014 similar to forecast but income
recognition two months later than expected
> improved LWAP/GWAP ratio due to peakier hydro profile and NIGUP improving location factor between
generation and Auckland.
> FY2014 PFI operating expenditure of $250.5 million
> FY2013 operating expenditure at $318.7 million included $68.7 million one-off IPO and international
geothermal related costs - $250.0 million
> FY2012 operating expenditure of $264.4 million included $10.0 million one off costs - $254.4 million
> Capital markets insights coupled with review processes have identified focus areas to drive sustainable earnings
> in Q4 FY2013 saw $18.4 million savings –two thirds of which are permanent savings
> Group-wide efficiency and effectiveness programme underway to deliver sustainable benefits through time
> rationalisation of suppliers, centre led procurement
> right sizing business for current market environment and activity levels
> consolidation of support servicesCAPITAL MARKETS DAY
Capital management considerations
> Sustained level of elevated reinvestment capital planned – c$10m p.a over rest of the decade
> A lower requirement for domestic growth capex exists but capital required over medium term to
advance international geothermal
> Clarity required around new S&P credit criteria connected to sustainable financial structure
> A number of capital management options exist in absence of growth investments
> change to ordinary dividend: Policy needs to be sustainable and cognisant of rating, working capital
requirements, the medium term asset investment programme and earnings volatility
> special dividend: one-off return of excess capital but cognisant of the above, unimputed if large
> share buy-back: would need to be in the best interests of the company and shareholders
> Dividend policy
> policy expressed as 90% - 110% of adjusted profits cognisant of a sustainable financial structure, working
capital requirements, the medium term asset investment programme and short to medium term risks on
earnings
> FY2014F dividend declared of 13 cents/share. Forecast to be fully imputed –a further 3 cents worth of
imputation credits available as at the end of FY2014
> 71% of free cash flow (FY2013 pay-out was 78% of FCF)
> Capital management outcomes will be announced at ASM (7 November 2013)You can also read